Soybeans: The Global Protein Powerhouse🟡 1. Introduction
Soybeans might not look like much at first glance — small, round, unassuming. But behind every bean lies a global story of protein demand, export flows, and economic policy.
They feed livestock, fuel vehicles, nourish entire populations, and move markets. In fact, soybeans sit at the intersection of agriculture, industry, and geopolitics — making them one of the most actively traded and strategically watched commodities in the world.
If you’re looking to understand how soybeans move markets — and how you can trade them effectively — this article is your starting point.
🌍 2. Why the World Cares About Soybeans
Few agricultural commodities carry the weight soybeans do. Their importance spans both the food and energy sectors — and their global footprint is enormous.
Here’s why they matter:
Protein Meal: After processing, about 80% of the soybean becomes high-protein meal used to feed poultry, pigs, and cattle.
Soybean Oil: Roughly 20% is extracted as oil — a key ingredient in cooking, industrial products, and increasingly, biodiesel.
Biofuels: As the push for renewable energy grows, soybean oil plays a major role in sustainable fuel strategies.
Top producers:
United States — historically the world’s largest producer.
Brazil — now rivals or exceeds U.S. production in some years.
Argentina — a dominant player in soybean meal and oil exports.
Top importers:
China — imports over 60% of globally traded soybeans.
EU, Mexico, Japan — also large buyers.
Soybeans are a bridge commodity — connecting livestock feed, food manufacturing, and renewable energy. That’s why traders from Chicago to Shanghai watch every yield forecast and export announcement closely.
💹 3. CME Group Soybean Contracts
Soybeans trade on the CME Group’s CBOT platform, with two main futures products:
o Standard Soybeans
Ticker: ZS
Size = 5,000 bushels
Tick = 0.0025 = $12.50
Margin = ~$2,150
o Micro Soybeans
Ticker: MZS
Size = 500 bushels
Tick = 0.0050 = $2.50
Margin = ~$215
Soybean futures are among the most actively traded agricultural contracts, offering deep liquidity, tight spreads, and excellent volatility for strategic traders. Keep in mind that margins are subject to change — always confirm with your broker. Micro contracts are ideal for scaling in/out of trades or learning market structure without large capital risk.
📅 4. The Soybean Calendar
Soybeans follow a seasonal cycle that creates rhythm in the market — and a potential edge for informed traders.
In the United States:
🌱 Planting: Late April to early June
☀️ Pod development / blooming: July and early August (weather-sensitive)
🌾 Harvest: September through November
In Brazil:
🌱 Planting: October to December
🌾 Harvest: February through April
This staggered calendar means that soybean markets have multiple weather risk windows each year. It also means the export flows and global pricing dynamics shift between the Northern and Southern Hemispheres throughout the calendar year.
That’s why soybeans tend to have two major volatility windows — mid-summer (U.S. crop concerns) and early Q1 (South American weather). Traders often build seasonal strategies around these patterns — buying weakness before key USDA reports, fading rallies during overbought harvests, or trading futures spreads between U.S. and Brazilian supply flows.
🔄 5. How Soybeans Are Traded Globally
Soybeans move through a complex international web of growers, crushers, exporters, and consumers. As a trader, understanding this flow is essential — because each node introduces price risk, opportunity, and reaction points.
Key players:
o Hedgers:
U.S. and Brazilian farmers hedge production risk using futures or options on futures.
Exporters hedge shipping schedules against fluctuating basis and FX risk.
o Crushers:
Companies like Cargill or Bunge buy soybeans to crush into meal and oil.
Crush margin (aka “board crush”) affects demand and influences futures spreads.
o Speculators:
Institutional funds trade soybeans as a macro or relative value play.
Retail traders use micro contracts (MZS) to capture directional or seasonal moves.
o China:
Its purchasing pace (or sudden cancellations) can move markets dramatically.
Announcements of bulk U.S. purchases could trigger short-covering rallies.
Additionally, soybeans are sometimes traded indirectly via their by-products:
Soybean Meal (ZM)
Soybean Oil (ZL)
These contracts often lead or lag ZS based on demand shifts in feed or fuel.
📈 6. What Makes Soybeans Unique to Trade
Compared to wheat and corn, soybeans are:
More weather-sensitive during July and August (especially to drought and heat).
More globally integrated, thanks to China’s dominant import role.
More complex, due to crush dynamics and multiple end-use markets.
This multifaceted nature is why many professional traders monitor soybeans, even if they aren’t actively trading them every week.
📌 7. Summary / Takeaway
Soybeans are one of the most important — and most tradable — commodities in the world. They feed livestock, fuel industry, and anchor the agricultural markets across two hemispheres.
Their unique role in food, fuel, and feed makes them more than just another contract — they’re a barometer for global health, demand, and policy.
Whether you’re trading the standard ZS contract or getting started with MZS, mastering soybeans means understanding weather, trade flows, product demand, and seasonality.
🧭 This article is part of our agricultural futures trading series.
📅 Watch for the next release: “Weather and Corn: A Deep Dive into Temperature Impact”
When charting futures, the data provided could be delayed. Traders working with the ticker symbols discussed in this idea may prefer to use CME Group real-time data plan on TradingView: www.tradingview.com - This consideration is particularly important for shorter-term traders, whereas it may be less critical for those focused on longer-term trading strategies.
General Disclaimer:
The trade ideas presented herein are solely for illustrative purposes forming a part of a case study intended to demonstrate key principles in risk management within the context of the specific market scenarios discussed. These ideas are not to be interpreted as investment recommendations or financial advice. They do not endorse or promote any specific trading strategies, financial products, or services. The information provided is based on data believed to be reliable; however, its accuracy or completeness cannot be guaranteed. Trading in financial markets involves risks, including the potential loss of principal. Each individual should conduct their own research and consult with professional financial advisors before making any investment decisions. The author or publisher of this content bears no responsibility for any actions taken based on the information provided or for any resultant financial or other losses.
Beyond Technical Analysis

Your Crypto Wallet Isn’t Safe AnymoreA security update is splitting the market in two; some think they’re safe, others are running scared!
Security becomes dangerous when it makes you careless — and right now, that’s exactly where we are!
Whales aren’t just switching wallets, they’re changing where the money flows… and you need to know
Hello✌
Spend 3 minutes ⏰ reading this educational material .
🎯 Analytical Insight on Bitcoin: A Personal Perspective:
Bitcoin has recently established multiple daily resistance levels and has now executed a strong breakout above its long-standing descending channel. This move is backed by a significant increase in buying volume, signaling renewed bullish momentum. From a short-term perspective, I anticipate at least a 6% upside, with a target around the $110,000 zone. 📊🚀
Now , let's dive into the educational section,
🔐 New Security in Crypto
Tech like MPC and smart contract wallets look fancy but come with a lot of questions underneath.
If your private key isn’t in your hands, then you don’t really own your wallet.
Most people feel safe because they don’t have to memorize a seed phrase. But that one phrase could save or ruin you.
🧠 Trader Psychology and Feeling Safe
False security makes traders ignore managing their risk and stop doing real analysis.
Thinking “everything’s safe” shuts down your brain — right when the market is about to turn.
In crypto, fear and greed run the show; security is just an excuse to get greedy.
📈 Market Reaction to Security Updates
Tokens like TWT, SFP, and KASPA pump after security upgrades, but those pumps are often fake.
When exchanges roll out security updates, smart money is actually pulling out, because whales want real control, not just a safe look.
📉 Security Without Responsibility?
Social recovery means relying on a group of people. What if someone in that group betrays you?
Users think it’s easier now, but easier doesn’t always mean safer — sometimes it’s way riskier.
🕵️♂️ Watch What Whales Do
Data from TradingView shows old-style wallets are gaining users after MPC updates.
Whales prefer a hardware wallet and a paper backup over smart recovery systems any day.
📊 Tools You Need to Know ( in TradingView )
Use Wallet Flow and Smart Money Index on TradingView to track where the money’s moving.
The Wallet Activity heatmap tells you when the market is gearing up for a big move.
🤯 Feeling Safe = Market Blind Spot
When everyone feels safe, that’s exactly when the most liquidations happen.
Calm markets are traps built by whales to catch others off guard.
🔄 Final Thoughts
Security should be a tool, not an illusion. If you put all your trust in tech, you no longer control your money.
A pro trader doubts even when the market says it’s safe, because in crypto, nothing is ever guaranteed.
However , this analysis should be seen as a personal viewpoint, not as financial advice ⚠️. The crypto market carries high risks 📉, so always conduct your own research before making investment decisions. That being said, please take note of the disclaimer section at the bottom of each post for further details 📜✅.
Give me some energy !!
✨We invest countless hours researching opportunities and crafting valuable ideas. Your support means the world to us! If you have any questions, feel free to drop them in the comment box.
Cheers, Mad Whale. 🐋

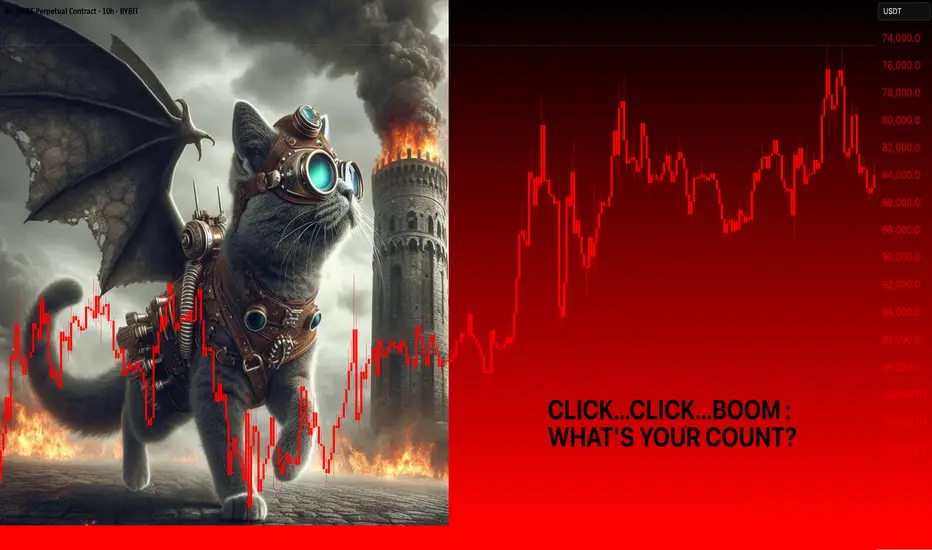
Click…Click…Boom : What’s Your Count?Hello Traders and welcome to Crypto Aera.
The inspiration for today’s episode comes from a conversation I had recently.
Someone asked me, "I’m moving up in my position size, and there’s this knot in my stomach. I’m numb to smaller figures, but now I’m stressed." That stayed with me.
A few days later, I stood on a beach, watching the waves lap against a shore covered in endless pebbles.
As I began stacking them, I noticed a pattern. The higher the stack climbed, the more precise I had to be. I spent longer searching for flat, perfectly matched pebbles.
You see, you can’t throw a large pebble on top of a small one, followed by another large one, and expect stability. The tower will hesitate, teeter for a moment, and then collapse under the weight of imbalance.
Trading is no different. It’s physics, it’s art, it’s strategy. Your foundation—your portfolio—can only carry so much unless each decision is deliberate, consistent, aligned.
A misplaced pebble, much like a poorly timed trade, and you’re staring at the rubble of a once-promising stack, left with barely 8%—if you’re fortunate.
Similar-sized, flat pebbles stack because consistency breeds strength. The higher you go, the more thoughtful you must become. The rules of pebble stacking and trading are inseparable.
Now, let’s address that knot in your stomach.
How do you conquer it?
You embrace the crash.
You let the tower burn—not on its own terms, but on yours.
You take control.
Cut the trade, close it yourself.
It may seem like a minor act, but it’s not.
Holding on for hours, days, endlessly hoping, is how you wear yourself down, tumble-dry your psyche into exhaustion.
But here’s the alchemy of transformation: you choose the moment.
Pick the time, pick the place, and sever the cord.
Because waiting for the market to punish you, to bring your tower down, is surrender.
Hope is a subtle assassin, and hesitation will chain you to stagnation.
Don’t allow it.
Let the tower fall, let it crash.
That moment—the collapse—is not an end.
It’s a doorway.
It’s the reset button, the gateway to moving forward.
Guilt?
Leave it behind.
Regret?
That’s weight you can’t afford.
Be nimble, be decisive.
Don’t get swept away by the explosion; walk yourself out of that burning tower with precision and strength.
Scars are avoidable if you leave on your terms.
Every trade is a deliberate action, a piece of a larger construction.
Each choice builds your tower, step by step, click by click.
The market’s tide can shift in an instant, but you can decide whether you stand still, hesitating, or take action to preserve what you can.
So I’ll ask you:
What’s your count?
How many pebbles have you stacked?
How many missteps have you learned from?
Each toppled stack is not failure—it’s a masterclass in rebuilding, stronger and sharper.
Balance risk and reward, ambition and patience.
Understand that every pebble plays a role. Yes, at the bottom of the stack it's not a heavy burden... it's when you see growth... that's where things tend to get wobbly.
And next time you feel that knot in your stomach, remember this: you are the architect of your stack. You are the one who decides when to burn the tower and when to build it higher.
Don’t hesitate.
Act.
Thank you for tuning in to Crypto Aera's Mental Analysis Navigation.
Until next time: keep stacking, keep counting, and keep mastering.
PS: Split your stacks.
Over and Out,
Craft
Behind the Numbers : Meet Your Dark SideIn the heart of every trader lies an unspoken duality—a relentless pursuit of precision battling against a ravenous hunger for chaos.
It begins innocuously enough: the first trade, the first click, the first taste of triumph. But beneath the surface, hidden in the shadows of spreadsheets and tickers, a darker force stirs. It’s cunning, calculating, and seductive—a predator dressed in the guise of ambition.
You meet this dark side not in moments of triumph, but in the haunting seconds between fear and greed. It whispers to you as the market turns against you, as the screens bleed red and your pulse quickens. It watches as your composure fractures, as your carefully laid plans buckle under the weight of desperation. It thrives in the silence, in the endless ticking of the clock as you hesitate, second-guess, and linger on the edge of ruin.
The dark side is not an external force; it is you. It is your impatience when the chart doesn’t move fast enough, your overconfidence when the numbers briefly tilt in your favor. It is the knot in your stomach, the feverish obsession, the siren call of doubling down when you know you shouldn’t. It is your recklessness disguised as boldness and your hesitation masked as strategy.
You don’t fight the dark side.
You negotiate with it.
You confront it, standing toe-to-toe, dissecting its motives and unmasking its lies.
To do otherwise is to surrender—becoming a puppet to your own fear, enslaved to the same impulses that destroy those who lack the discipline to conquer themselves.
In trading, the battlefield is not the market. It’s the war within you. And to emerge victorious, you must first meet your adversary:
YOURSELF.
Craft

The Hot Seat: Adapt or BurnSo, you've found yourself squarely in the hot seat.
Welcome to the Trading Trail, Dorothy—except this isn’t Kansas, and you’re lightyears from home.
This is new terrain, uncharted and merciless. In prior episodes, I barely skimmed over the dark side of trading—the facets of your psyche that stealthily pilot your decisions. Perhaps it left you sighing, unsure of where to begin. Let's change that today.
Consider this a no-frills exposé into the abyss—the countless unseen facets of your being that dictate your behavior on autopilot. As traders, many scream manipulation as markets sway violently against their carefully plotted plans. Yet, all the market truly does is wield a figurative hot pogo stick, jabbing precisely where your weak points lie—not maliciously, but with unerring precision.
Let’s be honest.
Western Hollywood scripts spoon-feed us formulaic redemption arcs. Fifteen minutes in, the hero lands their mission. Fifteen minutes before the credits roll, the final showdown begins.
Tomato, tomahto—it’s predictable fluff.
But real life doesn’t stick to screenplay rules. It’s jagged, it’s raw, and the narrative rarely ties up neatly. If you’re seeking depth, you won’t find it in blockbuster tropes—you’ll find it by doxxing your own dark side.
That’s right—exposing the facets of yourself you don’t even realize exist. It’s intense, it’s uncomfortable, but it’s transformative.
Here's a quick roll call of scenarios you might recognize:
- You close your trade prematurely due to impatience and wavering conviction.
- You've DCA'd your account into oblivion, clutching blind hope from a TA analysis you were too stubborn to question—aka Disney goggles.
- Revenge trading—you've been there, too. We all have.
Here’s the brutal truth: every “loss” is nothing more than the market holding up a mirror to your imbalances. Every poke, every jab, is a lesson about you.
Your job isn’t to whine about manipulation, but to analyze yourself. Figure out where you are falling short, because the longer you deny your flaws, the deeper that pogo stick sears into your psyche. Embrace the battlefield; don’t cower. The market is your adversary, yes—but it’s also your greatest teacher.
Now, the million-dollar question—where do you begin?
Start by delving into the layers of yourself.
Explore tools like the Myers-Briggs personality test—it’s one type of gateway to understanding your cognitive tendencies.
Answer impulsively, not meticulously, to ensure untainted results.
Once you unearth your MBTI type, dive deeper. YouTube has a treasure trove of creators offering insights, and here’s a quirky trick: pay attention to the memes that resonate with your dark humor—if it makes you laugh, it may hold clues to your personality type.
Go further. Unearth whether you align with alpha, beta, gamma, or sigma archetypes. And don’t cheat—being an alpha isn’t necessary for trading success. Honesty is paramount. The market will sniff out dishonesty like a bloodhound.
Are you a Heyoka empath? Research it thoroughly, as such individuals often absorb and act under external influences. Understanding this facet could shield your portfolio from emotional sway.
Perhaps astrology speaks to you.
If it does, approach it with sophistication—understanding your sun, moon, and ascendant sign is merely scratching the surface.
True mastery lies in uncovering the full depth of your natal chart through the myriad systems that exist.
Trading and astrology, though seemingly worlds apart, share a startling resemblance: both rely heavily on indicators, and both are prone to human inconsistency.
Ultimately, explore yourself as though you’re reconstructing a high-performance machine.
What happens when your rev limiter is in the red, the tires gripping the pavement at 144mph—do you fishtail with control or spin into oblivion?
That’s trading in its essence, but you’re motionless in a chair, adrenaline pumping, palms sweating.
The goal?
Serenity.
No matter whether you rake in gains or cut losses, your micro-expression remains unchanged—
neutral and poised. Not numb or robotic, but wholesome and unshakeable.
When you embrace this awareness, you transform. You shed skin like a serpent, emerging sharp, agile, and complete.
Suddenly, the market loses its fangs.
You dodge the pogo stick like a lethal machine, executing trades with finesse.
You stop being a victim, instead becoming a warrior.
The market ceases to intimidate, recognizing you as an equal contender.
There are countless tools to learn more about yourself. Skip the IQ tests—this isn’t about being book-smart.
Explore psychological tests, data intake styles, and sensory preferences.
What works for others may not work for you, and that’s okay. Clarity is the key.
And before you dive in each day, try the Human Benchmark website—a simple way to check your mental acuity.
If you’re off your game, sleep.
The trade can wait.
Finally, ponder the Dark Triad—a concept that brushes against psychopathy, narcissism, and Machiavellianism. It’s not just a speculative theory—it exists all around us.
Are you one?
Are you dealing with one?
Knowing yourself will sharpen your moral compass and guide your decisions in the battlefield.
Trading isn’t just a skill.
It’s an intimate confrontation with your entire self—the good, the bad, and the shadowy. And like any great narrative, the real depth doesn’t come from shortcuts—it comes from the untamed, unvarnished truth.
Craft

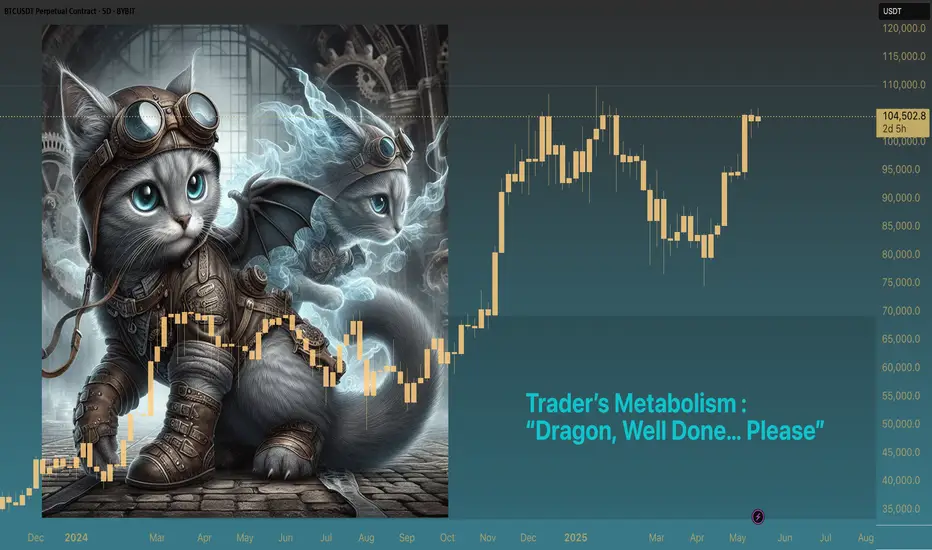
Trader’s Metabolism : “Dragon, Well Done… Please”Trading isn’t just skill.
It’s survival.
And survival isn’t a phase—it’s a permanent residency. It’s 90% of the job. The other 10%?
We’ll get to that when you’ve stopped bleeding.
Because when the market burns you down, it doesn’t just torch your wallet.
It leaves a mark. Personal. Intimate.
Like an ex who knew your passwords and your childhood traumas.
You don’t just lose money—parts of you are marked with an invisible highlighter and then used against you. That is the feeling. No specific term for it—it’s different for everyone, but it’s there.
A delayed punch. The shock hits first, then the sting.
You thought you were unfazed? Cute. It always hits.
Every loss leaves a signature.
You’re basically a walking hall of fame. Who’s fame though?
The market makers, the "manipulators" as some may say?
Of course there are traders who rise. It’s not because they cracked the code.
It’s because they paid the maintenance fee.
Not in dollars—but in discipline.
And the only way to pay that? You keep your trading metabolism in check—at all costs.
That spark of momentum?
Momentum doesn’t arrive in grand gestures.
It sneaks in through the absurd:
• Scrubbing your stove like it insulted your ancestors.
• Folding socks with military precision.
• Blending kale and chia like it’s alchemical fuel that could summon capital gains.
It’s ridiculous.
But it’s survival.
These micro-wins? They’re dopamine.
Pure. Primal.
When the market denies you progress, you hunt that feeling down elsewhere. Anywhere.
Invisible anchors.
Here’s the con:
You set a goal—“By this day, I’ll hit X and I’ll buy Y.”
Sounds motivational. Feels empowering.
It’s not. It’s a booby-trap with your name on it.
You just promised your nervous system salvation through consumerism. And when the market delays the payout?
That thing you prescribed? It becomes poisonous.
You’re not chasing gains—you’re fleeing your own unmet expectations. It drags. It suffocates. It taunts.
Euphoria’s Dark Side:
Dopamine doesn’t care if you’re building an empire or torching it.
You set a magic number. You dream about the condo. You think shiny gear will fix your edge.
Sure. Until it doesn’t. Then what?
You start resenting dreams you haven’t bought. Blaming the strategy that wasn’t the problem. Watching motivation rot into mockery.
Your trading plan looked good—right up until your emotions co-signed the exit.
That trade wasn’t bad.
You were.
And that’s the part we don’t backtest.
The Metabolic Reset:
How do you fight back?
You stop begging the market for meaning.
You stop trading for things.
You start building systems for hardcore exposure and unkind weather.
Discipline becomes your operating system—one that doesn’t crash, only upgrades.
We tend to address and slay the exterior dragons first:
Habits.
Routines.
Appearance.
Our environment.
Don’t get me wrong, they are an absolute must.
The acrobatic part is to turn inward—face the lurking dragons hidden beneath layered gates of facade in your psyche:
It’s typically titled, “This is how I am”.
The market doesn’t see you, let alone your dreams.
However it will mirror your chaos back to you, with laser precision. Like a funhouse reflection—only it costs real money and sanity.
This 2D screen you look at was built on leveraging you against yourself. Whoever made it is a sick genius who carved a niche in demand. Props to them. Diabolical. Elegant.
Honestly, deserves a Netflix origin story.
Maybe call it:
"The Algorithm: A Love Letter to Human Delusion. Starring you… as every character.”
The Fuel. This is your metabolism.
Messy. Brutal. Relentless.
But it’s also the separator. Between those who stay the same—and those who evolve.
So kill the fantasy.
Drop the anchors.
Burn the wishlist.
And if you ever do buy that yacht? Do Keep the AC running. Because the second you slack on overhead maintenance cost—you’re not sailing, you’re renovating… again.
So when you rebuild yourself for the ninth, twentieth, seventy-fifth time…thinking, “Surely this is it. I’m done now.”
You’re not.
It’s infinite.
Like they say, “More money, more problems…”
Well, more experience? More sophisticated problems.
The only thing left to do…is see yourself clearly enough that the market can’t use you against you anymore.
Keep slaying.
The tides do turn.
Just don’t forget: dragons respawn.
Craft
Working in the Dark : Frequency of Energy Amplifying ResistanceSilence.
Sometimes, the best option is to turn it all the way up.
Not to satisfy your ego’s need for control of your helm, but to glimpse a beacon cutting through the heavy fog.
Not to get philosophical or poetic—but what I’m describing is that moment when you learn to master containment of the chaos within whilst having a zero longing to tell a single soul about it.
It’s a deeply personal moment with your own spine.
Exposed. Unshaken.
Sincerely keeping in stillness, eyes locked on that one elusive beacon—the exit point of your turbulent existence.
“THAT” trade, the one that triggers rooted fear.
It’s an umbrella term that covers numerous facets, at which state they do not matter.
In this stillness, you board a ship on a voyage through the fog and that is where fear thrives.
How do you rid yourself of its lingering remnants as it keeps purging its residue while looking for a shore?…
Fear is the propeller of your ship, synced in unison, the driving force that keeps you moving forward where separation seems impossible, united as one.
Now, let’s revisit your ego.
It operates in the realms of past and future.
It uses logic as a lock and key to interpret everything that’s gone wrong in the past and project that failure into the future.
That’s how the propeller keeps turning at high RPM.
Many preach, “Be in the here and now.”
But that’s a difficult state to reach when your anxiety is at its peak.
Sleep may offer brief respite, but the weight upon the waking hour is dreadful.
The heaviness arrives and greets you like a loyal mistress who you betrayed.
So, logically, you might think: “Shut off the propeller, use the sail…”
But here's the catch—reality is far from perfect, and sometimes there’s no wind.
Just layers of fog.
The sail won’t help; it may only complicate things, especially as you don’t have the faintest clue if or when the wind will pick up.
Here’s the turning point.
You learn to embrace the drift.
The term for this is surrender.
Let me say this clearly. Surrender is not weakness.
Some might call it “taking action by not taking action.”
Underlying interpretation is subjective.
The Method of Deduction.
Cliche phrase…
“Reduce the noise to gain clarity”, well because fear is a ‘Frequency of Energy Amplifying Resistance’.
There is no shame in it as no trader is immune.
We all have been dealt a card of the Universal Geo Position, where “Bearlington” and “Bullington” turned into a potential end game, later to surface as a wrenching regretful memory depending on how you processed it.
One must comprehend in the stillness, that fear is an energy that blocks us, amplifying resistance to PROGRESS or proper ACTION and ignites a REACTION naturally - the deadliest one being frozen in panic.
Now, the action.
You surrender to the fog.
You shut down the propellers and let your ship glide.
There’s always a timer—your liquidation point, a whole host of other factors—and swallowing that pill is never easy.
How do you hold this mindset while time relentlessly ticks away?
Grant yourself a few minutes of stillness…
No inner dialogue, just silence. No inner talk because that leads you straight into a rabbit hole.
This is the balancing act between creativity and surrender—how to dodge the bullet while borrowing calmness.
Amidst this uncomfortable point, you’ll RE-LEARN to hear your breath, the beat of your heart. It’s the world around you that you’ve forgotten to notice. Perhaps the sound of birds chirping at 4 a.m. As time stretches, you may notice the kind of tree that’s outside your window, which has existed before you were long conceived and will stand beyond your expiration date.
Everything begins to scale.
The situation, which felt insurmountable, becomes proportionate to everything else.
You still possess strength.
You still have sight.
You still hear.
You are alive, and that’s a reminder of how far you’ve come.
This is the moment you step outside of your situation. And this, right here, is where the magic happens.
I personally don’t believe in magic. To me, it’s just harmonious mathematics.
But that “AHA!” moment is undeniable.
Your plan starts to take form as a distant mirage through the fog.
Trust when I say, the fog doesn’t settle, your senses obtain a rain-shield and a foglight.
Hello, clarity.
Maybe the charts align this time.
Maybe the structure is moving the way you anticipated. And just like that, you’ve gained a sliver of clarity.
The trick is to keep moving forward, maintaining perspective.
The fog doesn’t magically vanish, but you learn to navigate it.
You engage your surroundings, adjust, and save some fuel in the process.
What you’ve done is re-channel your energy—cut off the fuel-line to the propeller.
Fear loses its grip.
I repeat, that fear—it’s an umbrella term now. The details don’t even matter.
You needed silence.
Shutting off the noise was the first step.
Those propellers were making too much racket.
Now, you just watch.
You float.
You’re no longer entangled in the situation.
I say "situation" instead of "problem" because you don’t have a problem.
Never see things as a problem.
Duality fuels extremes and skyrockets emotional pendulum swings.
There’s no good.
No evil.
There is only what is.
At some point, you realize…
Nothing lasts forever.
There are cycles and phases and that in itself is THE CONSTANT.
And when the fog does clear, you look around—no island, no shore, no beacon.
You’re still floating.
The clock is still ticking.
But here’s the reality check.
Do you realize how many things you could have done in that fear-induced panic mode?
You created a type of momentary anchor.
Take a moment.
Think about it.
The what if’s…if there was an iceberg you couldn’t see?
You could’ve crashed, completely and literally underwater.
It’s not an easy practice and it is a solo journey.
Speaking to others can validate your victimhood, which only drags you down further. Especially when you talk to other traders.
It’s on an extreme rare occasion you’ll ever find your perfect answer.
Most of the time, those voices will sound like an all knowing three-headed dragon mixed with a panicking crew.
Adapt to growing your own spine my love.
The key to regaining focus—designing your decision into action and resolving the situation in your favor with minimal damage—will be an ongoing process.
You’ll learn to surrender, drift, and accept that fear can be a constant companion—but it doesn’t have to control you.
And sometimes, that mistress?
She’s a Trojan horse—deceptively alluring, but full of consequences. Different face, different name, same impact on your lifeboat, if you let her in.
Once again, train to re-frame fear.
It’s ONLY a frequency.
Your next candle is not hope.
It’s the cold proof you made it through the blackout…
…for now
There are no promises, just currents.
Hear the reality.
You kill a trader from the inside by letting them abduct themselves. They go from being the sharpest, most focused individual to a detective in their own head—chasing down ghosts that may not even exist. They either wake up and build the bridge to their own throne, or they keep smashing the keyboard like it’s their only lifeline—until the money dries up and they're left with nothing but a pile of regret.
It’s a war between their ears.
The rest of it? Just noise.
And remember this, the charts aren’t gonna save you, the system isn’t gonna save you...
Only you can own the mind that sits behind that screen.
So yeah, there are no promises, just currents.
As always…over and out,
Craft

Why Traders Chase — and Always LoseHard truth:
You don’t miss opportunities. You chase noise.
Let’s break down the real reason you keep “missing moves”:
1. FOMO is not urgency — it’s confusion.
When you enter because “everyone’s talking about it,” you’re not trading a setup. You’re reacting to social proof.
2. Volatility ≠ opportunity.
Big moves look attractive, but if they’re not in your plan — they’re distractions, not trades.
3. The market rewards patience, not activity.
Every click, every chart, every refresh feeds your dopamine — not your edge.
🚫 Solution?
Stop scanning. Start filtering.
Use tools that prioritize structure over noise. That’s why we built TrendGo — to give clarity in chaos and help you avoid traps masked as opportunity.
📌 Don’t chase. Build your edge.

How to Set Custom Alerts for Futures Trading in TradingViewThis tutorial video demonstrates how to access and add custom alerts for futures and other types of trading as well as manage those alerts.
Learn more about trading futures with Optimus Futures using the TradingView platform here: optimusfutures.com
Disclaimer:
There is a substantial risk of loss in futures trading. Past performance is not indicative of future results. Please trade only with risk capital. We are not responsible for any third-party links, comments, or content shared on TradingView. Any opinions, links, or messages posted by users on TradingView do not represent our views or recommendations. Please exercise your own judgment and due diligence when engaging with any external content or user commentary.

Understanding How Cryptocurrency Prices Are FormedHello, Traders! 👋🏻
The estimated value of cryptocurrencies is a multifaceted process influenced by various dynamic factors. Unlike traditional assets, crypto prices are determined through a combination of market mechanisms, technological attributes, and investor behaviors.
This article delves into the core elements that shape cryptocurrency prices, offering a detailed perspective on their formation.
1. Supply and Demand Dynamics
At the heart of any market lies the principle of supply and demand, and the cryptocurrency market is no exception. The price of a crypto asset is significantly influenced by the balance between its availability and investors' desire to acquire it.
Limited Supply: Many cryptocurrencies like Bitcoin (BTC) have a capped supply. Bitcoin, for instance, has a maximum supply of 21 million coins. This scarcity can lead to increased demand, especially during periods of heightened investor interest, thereby driving up the price.
Demand Fluctuations: Demand for a cryptocurrency can be influenced by various factors, including technological developments, media coverage, and macroeconomic trends. An increase in demand, with a constant or limited supply, typically results in higher crypto prices.
2. Market Sentiment and Speculation
Investor sentiment plays a central role in the cryptocurrency market. The collective mood of investors, often swayed by news events, social media trends, and broader economic indicators, can lead to significant price fluctuations.
Positive Sentiment: Announcements of technological advancements, regulatory approvals, or endorsements by influential figures can boost investor confidence, leading to increased buying activity and higher cryptocurrency prices.
Negative Sentiment: Conversely, news of security breaches, regulatory crackdowns, or macroeconomic uncertainties can result in fear and panic selling, causing prices to decline.
Speculative trading, driven by the anticipation of future price movements rather than intrinsic value, further amplifies these effects, contributing to the volatility observed in crypto prices.
3. Liquidity and Trading Volume
Liquidity refers to the ease with which an asset can be bought or sold in the market without affecting its price. High liquidity indicates a robust market with ample trading activity, while low liquidity can lead to significant price swings.
High Liquidity: Cryptocurrencies with high trading volumes and widespread adoption tend to have more stable prices, as large transactions can be executed without drastically impacting the market.
Low Liquidity: Lesser-known or newly launched cryptocurrencies may experience sharp price movements due to limited trading activity, making them more susceptible to manipulation and volatility.
4. Technological Developments and Network Utility
The underlying technology and utility of a cryptocurrency significantly influence its value. Factors such as network scalability, transaction speed, and real-world applications can influence investor perception and demand.
Network Upgrade: For example, the implementation of the Pectra Upgrade (ETH) (May 2025) is the most significant overhaul since the Merge (March 2024). It encompasses 11 Ethereum Improvement Proposals (EIPs) focused on improving transaction speed, reducing costs, and enhancing wallet usability. These continuous technological advancements improve Ethereum's functionality and play a crucial role in shaping investor perception and demand, thereby influencing crypto coin prices.
Use Cases: Cryptocurrencies that offer practical applications, such as smart contracts, decentralized finance (DeFi), or non-fungible tokens (NFTs), may attract more users and investors, positively impacting their prices.
Ethereum (ETH), for instance, has established itself as a foundational platform for smart contracts, enabling a wide array of decentralized applications (dApps) across various sectors. The recent Dencun and Pectra upgrades have further enhanced this utility, improving scalability and user experience. In decentralized finance (DeFi), platforms like Uniswap (UNI) and Aave (AAVE), built on Ethereum, facilitate peer-to-peer trading and lending, offering users alternatives to traditional financial systems. These practical applications demonstrate the versatility of cryptocurrencies and play a crucial role in shaping investor perception and, consequently, market prices.
5. Regulatory Environment
Regulatory developments across different jurisdictions can profoundly affect cryptocurrency markets. Policies that promote innovation and provide clear guidelines can foster growth, while restrictive regulations may hinder market expansion.
Favorable Regulations: Clear and supportive regulatory frameworks can attract institutional investors and enhance market credibility, contributing to increased demand and higher cryptocurrency prices.
Restrictive Measures: Conversely, bans on cryptocurrency trading or stringent compliance requirements can deter participation, reducing liquidity and declining prices.
In 2025, regulatory landscapes for cryptocurrencies are undergoing major transformations globally. In the United States, the Securities and Exchange Commission (SEC) is working to establish clear guidelines for crypto tokens, aiming to provide a rational framework that promotes lawful issuance, custody, and trading of crypto assets while deterring misconduct.
Concurrently, President Trump's administration has taken a proactive stance by signing Executive Order 14178, which prohibits the establishment of a Central Bank Digital Currency and establishes a group tasked with proposing a federal regulatory framework for digital assets within 180 days.
Across the Atlantic, the European Union's Markets in Crypto-Assets (MiCA) regulation came into full effect on December 30,2024. It aims to harmonize crypto regulations across member states and enhance investor protection.
6. Macroeconomic Factors
Global economic conditions can indirectly impact cryptocurrency markets, including inflation rates, interest rates, and geopolitical events.
Inflation Hedge: In times of rising inflation, investors may turn to cryptocurrencies like Bitcoin as a store of value, driving up demand and prices.
Economic Uncertainty: During economic instability or currency devaluation periods, cryptocurrencies may be perceived as alternative assets, influencing their adoption and valuation.
7. Market Infrastructure and Accessibility
The infrastructure supporting cryptocurrency trading, including exchanges, wallets, and payment processors, plays a crucial role in market development.
Exchange Listings: Listing on major cryptocurrency exchanges increases a coin's visibility and accessibility, potentially leading to higher trading volumes and prices.
User-Friendly Platforms: The availability of intuitive trading platforms and secure wallets can attract a broader user base, enhancing market participation and liquidity.
8. Media Influence and Public Perception
Media coverage and public discourse can significantly sway investor behavior and market trends.
Positive Coverage: Favorable news stories, endorsements by public figures, or viral social media content can generate hype and increase demand, leading to price surges.
Negative Publicity: Reports of scams, regulatory issues, or technological flaws can erode trust and prompt sell-offs, resulting in price declines.
However, it's crucial to approach media narratives critically. Not all promotions are organic, and some are strategically crafted to manipulate market sentiment.
9. Competition and Market Saturation
The cryptocurrency market is highly competitive, with thousands of coins vying for investor attention. The emergence of new projects and technologies can influence the market share and valuation of existing cryptocurrencies.
Innovative Competitors: New entrants offering superior technology or unique features may attract investment away from established coins, affecting their prices.
Market Saturation: An oversupply of similar projects can dilute investor interest and capital, potentially leading to stagnation or decline in cryptocurrency prices.
So, what really drives crypto prices? Well… everything and nothing — all at once. From market sentiment and smart contract upgrades to surprise tweets and regulatory drama, the crypto world doesn’t exactly run on logic alone.
What we’ve covered here is just the surface — a polite handshake with a market that often prefers chaotic dance battles. If you were hoping for a simple answer like “just follow the charts,” we’ve got news: even the charts are sometimes confused.
That said, understanding the basic mechanics — supply, demand, tech upgrades, and public perception — at least gives you a fighting chance in this wonderfully unpredictable space.
And hey, if we missed something (and we probably did), drop it in the comments.

The Secret Behind Bitcoin’s Sudden Nighttime PumpsHow does Bitcoin suddenly make wild jumps at night?
Whales are playing behind the scenes while amateur traders keep falling into traps!
In this analysis, you’ll learn how to spot these mysterious pumps and actually profit from them.
Hello✌
Spend 3 minutes ⏰ reading this educational material. The main points are summarized in 3 clear lines at the end
🎯 Analytical Insight on BNB: A Personal Perspective:
BNB has broken out of its multi-day descending channel to the upside 📈, yet the move lacks strong momentum and decisive follow-through. Historically, Binance Coin tends to trend with measured, deliberate price action rather than sharp rallies. A potential retest of the channel breakout zone remains possible, with a medium-term target set at $710 — representing a projected 9% move, assuming price holds above key support 🛡️.
Now , let's dive into the educational section ,
1. Nighttime Pumps: Whale Games or Just Luck? 🐋🎲
Sudden Bitcoin pumps during low-volume hours, especially at night, usually come from big whale moves or a cluster of smaller whales acting together. When market volume is low, even a small order can move the price drastically.
These engineered moves often aim to trick retail traders and create fake hype.
2. What Do On-Chain Data Say? 📊🔍
By checking on-chain data like transaction volumes, active addresses, and coin movements in big wallets, we can tell if a pump is real and sustainable or just a temporary shock.
For example, a rise in exchange inflows alongside a pump could signal a potential mass sell-off after a rapid price jump.
3. Market Psychology at Night 🧠🌙
Night hours usually see reduced trading volume, which increases volatility and risk. Less experienced traders often get emotional and jump in quickly due to FOMO (Fear Of Missing Out).
Learn how to control your emotions and wait patiently for confirmed signals like a pro.
4. Key Indicators & Advanced TradingView Tools to Spot Night Pumps 📈🛠️
To catch Bitcoin’s sudden night pumps, rely on key indicators like RSI, MACD, volume, and Bollinger Bands. For instance, a sudden volume spike with RSI in the overbought zone can warn you a pump is ending.
Additionally, TradingView’s innovative tools like Volume Profile and Order Flow let you see whale buying/selling pressure and identify critical support/resistance levels.
These tools reveal the real market structure during volatile night moves, helping you make sharper, lower-risk decisions.
Don’t forget multi-timeframe analysis to avoid false signals and understand pumps within bigger trends.
5. Strategies for Trading Night Pumps ⚔️⏳
One of the best ways is setting tight stop-loss orders and scalping during these moves.
Using price action analysis and following whale behavior from analyst insights can guide you to smarter entries and exits.
6. Risks and Important Tips ⚠️💡
Always remember, sudden pumps carry high risk and can lead to liquidation.
Trading during low-volume hours isn’t recommended for beginners. Stay aware of market volatility and emotional impulses.
7. Summary 📝✅
Nighttime Bitcoin pumps can be great profit opportunities but only if you enter with knowledge and a plan.
By understanding on-chain data, market psychology, and key indicators, you’ll make smarter decisions and benefit from these mysterious moves.
However , this analysis should be seen as a personal viewpoint, not as financial advice ⚠️. The crypto market carries high risks 📉, so always conduct your own research before making investment decisions. That being said, please take note of the disclaimer section at the bottom of each post for further details 📜✅.
Give me some energy !!
✨We invest countless hours researching opportunities and crafting valuable ideas. Your support means the world to us! If you have any questions, feel free to drop them in the comment box.
Cheers, Mad Whale. 🐋

AMP Futures - How to use the data windowIn this idea we will show you how to access pin point data information for specific areas on your chart using Tradingview.

How to Use Drawing Tools on TradingViewThis tutorial video discusses why and how traders use different types of trading tools, how to access the trading tools in Tradingview, and a few examples of how and why you might apply them.
Learn more about using Tradingview to trade futures with Optimus Futures:
optimusfutures.com
Disclaimer: There is a substantial risk of loss in futures trading. Past performance is not indicative of future results. Please trade only with risk capital. We are not responsible for any third-party links, comments, or content shared on TradingView. Any opinions, links, or messages posted by users on TradingView do not represent our views or recommendations. Please exercise your own judgment and due diligence when engaging with any external content or user commentary.

3 Consistent Winner Beliefs. Do you check off all 3?> Every trader comes to the charts with a story.
Mine is one of obsession, resilience, and belief.
This is what I tell myself every single day before I take a trade — my inner code.
1. Money can be made in markets
I’ve seen the charts. I’ve seen the proof.
Every day, money moves — and the ones with eyes to see take their slice.
Markets aren’t random. They aren’t chaos.
They’re an ocean of opportunity.
The consistent winners?
They’re locked in the present and spot opportunity moment by moment —
then strike when it’s worthwhile.
2. I can make money in markets
Not someone else. Me.
I study. I adapt. I execute.
I’m not here to gamble or guess.
I’m here to observe human behavior and act with precision.
I’ve trained my mind to see what others miss.
And that edge? It’s mine.
> “It’s so incredible how rich one can become without being perfect.”
3. I deserve to make money in markets
This one’s the hardest — and the most powerful.
Because without it, we self-sabotage.
I’ve put in the work.
I’ve sacrificed.
I’ve endured losses, frustration, and silence.
But I never stopped.
So when profit comes, it’s not luck — it’s alignment with who I’ve become.
> I post this not just as motivation — but as a mirror for others walking the same path.
If you’re obsessed with mastering yourself through the charts, then we’re already on the same team.
A belief is any thought you get attached to.
The more you attach, the more you become it.

the markets are a very emotional cry babyIf you've ever asked, “Why is the market going up on bad news?” or “Why did it dump after great earnings?”, you're not alone.
Markets may seem logical—economic data in, price action out—but in reality, they’re driven by human emotion, crowd psychology, and reflexive feedback loops. The charts don’t lie, but the reasons behind the moves? Often irrational.
Let’s break down why markets are emotional—and how traders can use that to their advantage.
🧠 1. Markets Are Made of People (and People Aren’t Rational)
Even in the age of algorithms, human behaviour sets the tone. Fear, greed, FOMO, panic—all of it shows up on charts.
Fear leads to irrational selling
Greed fuels bubbles and euphoria
Uncertainty causes volatility spikes—even with no new information
📉 Example: The 2020 COVID crash saw massive capitulation. Then came one of the fastest bull markets ever—driven by stimulus and FOMO.
another example
📊 S&P 500 in 2020 with VIX, the S&P 500 crashed and the VIX went up, When the VIX (CBOE Volatility Index) goes up, it means that traders/investors expect a greater likelihood of price fluctuations in the S&P 500 over the next 30 days. This generally indicates increased fear as shown on the chart below
📈 2. Price Doesn’t Reflect Facts—It Reflects Belief
The market is not a thermometer. It’s a barometer of expectations.
When traders believe something will happen—whether true or not—price adjusts. If the Fed is expected to cut rates, assets may rally before it actually happens.
💡 Nerd Tip: Reality matters less than consensus expectations.
Chart Idea to visit:
💬 USD Index vs. Fed rate expectations (2Y yield or futures pricing)
🪞 3. Reflexivity: Belief Becomes Reality
Coined by George Soros, reflexivity explains how beliefs can influence the system itself.
Traders bid up assets, creating bullish momentum
That momentum attracts more buyers, reinforcing the trend
Eventually, fundamentals “catch up” (or the bubble bursts)
📌 Insight: The market creates its own logic—until it doesn’t.
😬 4. Emotional Extremes Create Opportunity
When markets overreact, they offer setups for rational traders.
Capitulation = Bottom Fishing
Euphoria = Caution
Disbelief = Strongest rallies
🧠 Pro Tip: Watch sentiment indicators, not just price. Fear & Greed Index, put/call ratios, or COT data reveal what the crowd is feeling.
Chart Example:
📊 Bitcoin 2022 bottom vs. Fear & Greed Index.. on the chart above the index score close to zero (RED) indicating extreme fear this was because in november 2022 crypto cybercrimes grew new level and investors lost confidence, these cyber crimes included the bankruptcy of FTX as the owners were allegedly misusing customer funds.
💡 5. How to Trade Rationally in an Irrational Market
a. Have a plan. Pre-define entries, exits, and invalidation levels.
b. Expect overreaction. Markets often go further than they “should.”
c. Use sentiment tools. Divergences between price and emotion are gold.
d. Don’t fight the crowd—until it peaks. Fade extremes, not momentum.
e. Zoom out. 5-minute panic means nothing on a weekly trendline.
🎯Nerd Takeaway:
Markets aren’t efficient—they’re emotional.
But that emotion creates mispricing, and mispricing = opportunity.
You don’t need to predict emotion—you just need to recognize it, and trade on the reversion to reason.
💬 Have you ever traded against the crowd and nailed it? Or got caught up in the hype? Drop your chart and your story—let’s learn from each other.
put together by : @currencynerd as Pako Phutietsile

Liquidation Begins With a Thought, Not a CandleHave you ever found yourself opening a trade you knew you shouldn’t?
That whisper in your head saying, “This setup looks different…” only for you to get stopped out or liquidated hours later?
It probably wasn’t your strategy that failed — it was your brain.
Hello✌
Spend 3 minutes ⏰ reading this educational material. The main points are summarized in 5 clear lines at the end
🎯 Analytical Insight on XRP: A Personal Perspective:
XRP is approaching a key daily resistance confluence with a descending trendline, after breaking out of its recent bearish channel and reclaiming prior structure levels 📈. I anticipate a gradual upside continuation with a minimum projected move of +14%, targeting the $2.85 zone. Two major daily supports — aligned with Fibonacci retracements — have also been identified as key demand zones for potential retests 🔍.
🧠 How Your Brain Leads You to Liquidation
A Psychological Trap Every Trader Must Know
Let’s explore how your mind tricks you into losses and which TradingView tools can help you stay focused and objective in the heat of the market.
🛠️ How to Protect Yourself (And Your Capital)
✅ Use multi-timeframe analysis:
Sometimes a bullish move on the 15-min chart is just a retest on the 4H. TradingView makes it easy to monitor several timeframes side-by-side.
✅ Set alerts instead of staring at charts:
Let TradingView notify you when your trade setup actually appears. Reduce emotional overtrading.
✅ Trust neutral tools like EMA, VWAP, or Volume Profile:
They offer structure and objectivity — less prone to emotional interpretation.
✅ Keep a trading journal:
Use the idea publishing feature or private notes to reflect on why you entered a trade. Most mistakes repeat when they’re not reviewed.
🔍 Cognitive Biases in Action
Your brain is wired for survival, not profits. It reacts emotionally — especially under pressure.
One of the most common psychological traps in trading is confirmation bias:
You form an opinion first, then only look for information that supports it.
It’s like spotting a resistance level on BTC but ignoring bearish signals because you want the price to break out.
You're not analyzing anymore — you're convincing yourself.
😨 FOMO: The Invisible Hand That Pushes Bad Trades
Bitcoin rallied from $93.4K to $102K in early January 2025.
The crowd on social media went wild: “ATH is coming!” was everywhere.
But on the chart? RSI was overbought, MACD flashed a bearish divergence.
Still, traders entered blindly — emotionally. Days later, BTC encounter with more loss.
This wasn’t technical failure. It was pure psychological FOMO.
🧘♂️ Train Your Mind Before You Train the Market
The charts don’t lie — but your interpretation of them might.
That’s why the best traders don’t just study the market, they study themselves.
Master your mindset, and the market won’t master you.
However , this analysis should be seen as a personal viewpoint, not as financial advice ⚠️. The crypto market carries high risks 📉, so always conduct your own research before making investment decisions. That being said, please take note of the disclaimer section at the bottom of each post for further details 📜✅.
🧨 Our team's main opinion is: 🧨
XRP has broken out of its downward channel and is now approaching key resistance; I’m eyeing a steady move toward the $2.85 target with at least +14% potential upside 📊.
Trading mistakes often come from our own minds, not the market. Emotional biases like confirmation bias and FOMO can trick you into bad trades—just like BTC’s in early January 2025 jump that fooled many 📉. To protect your capital, use TradingView’s multi-timeframe analysis, alerts, and objective tools like EMA or VWAP. Remember, mastering your mindset is as crucial as reading the charts.
Give me some energy !!
✨We invest countless hours researching opportunities and crafting valuable ideas. Your support means the world to us! If you have any questions, feel free to drop them in the comment box.
Cheers, Mad Whale. 🐋

What Makes a Chart Tradable – Part TwoIn the previous post , we explored the foundations of technical trading. We examined how market behavior can appear structured even when it results from randomness, how bias affects interpretation and how volatility persistence helps explain why certain moves tend to cluster rather than appear in isolation. This post builds on that foundation by focusing on how to recognize meaningful movement and determine whether a chart structure is tradable.
Technical charts often present a wide range of setups, patterns, and interpretations. But a core distinction must be made between coincidental formations and actual price behavior driven by imbalance. Not all movements are equal, and recognizing the difference between random fluctuation and purposeful structure is essential.
A common assumption in technical analysis is that certain patterns or shapes inherently provide a specific outcome. This assumption is problematic without a defined context. The ability to recognize a flag or wedge does not imply statistical validity. For a price movement to be tradable, there should be characteristics that suggest underlying buying or selling pressure.
Unusual Movement
To determine whether a price move is meaningful, it must be assessed in relation to what is typical for that market. All assets have their own average range, pace and rhythm. When price breaks from that baseline through unusually strong or sustained movement, it can signal momentum or imbalance.
What makes these moves relevant is not their size alone, but the fact that they differ from normal behavior. This kind of shift may reflect changes in supply and demand or a reaction to new information. Such movements could mark a change in behavior and can serve as reference points. Their value lies in being statistically uncommon, which may suggest that market conditions have changed.
Pullbacks as Rebalance
Following strong directional movement, price tends to enter a state of reversion or pause. This is known as a pullback, a controlled retracement .It is not merely a pause. It reflects a psychological reset and the temporary rebalancing of order flow in response to imbalance.
Not all pullbacks are viable. For a setup to be considered tradable, the retracement must occur in the context of a meaningful prior move. When the underlying trend is intact and the pullback is controlled, the structure can offer a more reliable opportunity.
The Role of Standardization
Trading should be based on discretion. It involves interpretation, context and deliberate decision-making. But without structure, it risks becoming inconsistent and reactive.
Therefore movement and momentum should be measurable. What appears meaningful must be evaluated relative to the asset’s own historical behavior, not assumed based on surface-level appearance. Without a reference, the evaluation may lack foundation.
Measurement supports model building. Standardization supports disciplined execution. A trader might believe a move is strong based on visual cues or pattern familiarity, but if it lacks historical context or fails to meet defined criteria, that evaluation could be flawed.
Framework and Models
There are categories of tools that can be incorporated to support standardization. The choice is not fixed and should be based on personal preference, methods and research. Example:
Volatility Measure: Could be used to confirm when price moves outside a volatility-based envelope, indicating movement beyond the average range.
Momentum Measure: Could be used to confirm whether current price action is faster or stronger compared to recent historical behavior.
Such models are used to define context, not to predict outcomes. They help standardize analysis and filter out questionable movements and patterns.
Conclusion
The textbook patterns often referenced on their own do not create edge. Tradable charts are those where meaningful movement, defined by momentum, imbalance and structure, can be observed and evaluated using standardized methods. The purpose is not precision but repeatability. Discretionary trading is built on contextual evaluation supported by consistency and objective tools.

AMP Futures - How to set a date range for charts.In this idea we will demonstrate how to set a date range for your Tradingview Charts.

Ethereum and the Pectra Upgrade: ETH Growth PotentialEthereum is approaching a significant upgrade called Pectra, which, according to analysts at Trenovia Group, could become a major catalyst for ETH’s price appreciation—especially if network activity continues to rise.
What Does Pectra Bring?
Pectra continues Ethereum’s path toward greater technological maturity. The upgrade introduces enhancements to the Ethereum Virtual Machine (EVM), optimizes validator coordination, and strengthens smart contract security. As Trenovia Group highlights, such developments are essential to the platform's long-term competitiveness and stability.
Potential Impact on ETH Price
Based on Trenovia Group’s internal analysis, ETH could strengthen after the Pectra upgrade, assuming a rise in network engagement. Past events, such as The Merge, have historically driven price momentum. However, sustained growth depends on actual increases in user activity, transaction volumes, and new project deployments.
Network Activity as a Growth Indicator
Network usage is one of the most critical metrics tracked by Trenovia Group. A surge in active wallets, decentralized applications (dApps), and DeFi platforms often translates to higher demand for ETH. These indicators are at the core of our investment strategies and client advisory services.
Trenovia Group’s Position
As a company focused on digital asset analytics and blockchain innovation, Trenovia Group views Pectra as a strategically important upgrade. It further solidifies Ethereum’s role in decentralized finance and Web3. We will continue to deliver in-depth market insights and recommendations as the network evolves.
Conclusion
Ethereum is entering a new phase of development. Should the Pectra upgrade lead to a measurable increase in network activity, Trenovia Group anticipates a favorable environment for ETH growth, reaffirming its position as a leader in the crypto market.

The Yen’s Comeback Starts Here—and it Seems the COT Knew First1. Introduction: A Market Everyone Gave Up On
For a while, the Japanese Yen looked like a lost cause. After topping out in early 2021, Yen futures (6J1!) began an unrelenting slide, shedding value week after week like an old coat in spring. Traders stopped asking, “Where’s support?” and started asking, “How low can it go?”
The macro backdrop didn’t help. The Bank of Japan clung to ultra-loose monetary policy, even as the Fed hiked aggressively. Speculators piled on shorts. The Yen was a one-way ticket down, and no one seemed interested in punching the brakes.
But beneath that apathy, a quieter shift was underway. While price kept bleeding, trader positioning began to hint at something different—something the chart didn’t show yet. And if you were watching the Commitments of Traders (COT) report closely enough, you might’ve seen it.
2. The COT Trend That No One Was Watching
The COT report isn’t glamorous. It’s slow, lagging by a few days, and rarely makes headlines. But for those who track what the big players are doing—those large enough to be required to report their positions—it’s a treasure trove of subtle clues.
One of those clues is Total Reportable Positions. This metric tells us how active large market participants really are—regardless of whether they’re long or short. When that number is dropping, it suggests the “big dogs” are losing interest. When it starts climbing again? Someone’s gearing up to play.
From 2021 through most of 2024, Total Reportable Positions in 6J were in a steady decline—mirroring the slow death of the Yen's bullish case. But in late 2024, something changed. Using a simple linear regression channel on this COT data, a clear breakout emerged. Positioning was picking up again—for the first time in nearly three years.
And it wasn’t just a bounce. It was a structural shift.
3. Did Price Listen?
Yes—and no. Price didn't immediately explode higher. But the structure began to change. The market stopped making new lows. Weekly closes began to cluster above support. And importantly, a Zig Zag analysis started marking a pattern of higher lows—the first signs of accumulation.
Here’s where the chart really gets interesting: the timing of the COT breakout coincided almost perfectly with a key UFO support at 0.0065425—a price level that also marked the bottom in COT Traders Total Reportable Longs. This adds a powerful layer of confirmation: institutional orders weren’t just showing up in the data—they were leaving footprints on the chart.
And above? There’s a UFO resistance level at 0.0075395. If the Yen continues to climb, that could be a significant price level where early longs may choose to lighten up.
4. The Contract Behind the Story
Before we go deeper, let’s talk about what you’re actually trading when you pull the trigger on Yen Futures.
The CME Japanese Yen futures (6J) contract represents 12.5 million Japanese Yen, and each tick move—just 0.0000005 per JPY—is worth $6.25. It’s precise, it’s liquid, and for traders who like to build macro positions or take advantage of carry flows, it’s a staple.
As of May 2025, margin requirements hover around ~$3,800 (Always double-check with your broker or clearing firm—these numbers shift from time to time.)
But maybe you’re not managing seven-figure accounts. Maybe you just want to test this setup with more flexibility. That’s where the Micro JPY/USD Futures (MJY) come in.
Contract size: 1/10th the size of 6J
Tick move: 0.000001 per JPY increment = $1.25
Same market structure, tighter margin requirement around ~$380 per contract
Important note: The COT report aggregates positioning across the whole futures market—it doesn’t separate out micro traders from full-size. So yes, the data still applies. And yes, it still matters.
5. Lessons from the Shift
This isn’t about hindsight bias. The value in this setup isn’t that the Yen happened to bounce—it’s how Total Reportable Positions broke trend before price did.
Here are the real takeaways:
COT data may or may not be predictive—but it is insightful. When positioning starts expanding after a long contraction, it often signals renewed interest or risk-taking. That’s tradable information.
Technical support and resistance as well as highs and lows give context. Without them, COT breakouts can feel theoretical. With them, you have real, observable UFO levels where institutions may act—and where you can plan.
6. Watchlist Insights: Where This Might Work Again
You don’t have to wait for another yen setup to apply this framework. The same structure can help you scout for early positioning shifts across the CME product universe.
Here’s a simple filter to start building your own COT watchlist:
✅ Look for markets where:
Price has been in a long, clean downtrend (or uptrend)
Total Reportable Positions are falling—but starting to reverse
A breakout occurs in positioning trend (draw a regression channel and watch for a clean violation)
A key support or resistance lines up with recent extremes in COT positioning
Whether it's crude oil, corn, or euro FX, this template gives you a framework for exploration.
🎯 Want to See More Setups Like This?
We’re just getting started. If this breakdown opened your eyes to new ways of using COT reports, UFO levels, and multi-dimensional trade setups, keep watching this space.
When charting futures, the data provided could be delayed. Traders working with the ticker symbols discussed in this idea may prefer to use CME Group real-time data plan on TradingView: www.tradingview.com - This consideration is particularly important for shorter-term traders, whereas it may be less critical for those focused on longer-term trading strategies.
General Disclaimer:
The trade ideas presented herein are solely for illustrative purposes forming a part of a case study intended to demonstrate key principles in risk management within the context of the specific market scenarios discussed. These ideas are not to be interpreted as investment recommendations or financial advice. They do not endorse or promote any specific trading strategies, financial products, or services. The information provided is based on data believed to be reliable; however, its accuracy or completeness cannot be guaranteed. Trading in financial markets involves risks, including the potential loss of principal. Each individual should conduct their own research and consult with professional financial advisors before making any investment decisions. The author or publisher of this content bears no responsibility for any actions taken based on the information provided or for any resultant financial or other losses.

How to Set Up Multi-Timeframe Analysis (MTF) in TradingViewThis tutorial video explains what a time frame is, why traders use multiple time frames for their analysis, and how to set them up in TradingView for futures and other products.
Disclaimer:
There is a substantial risk of loss in futures trading. Past performance is not indicative of future results. Please trade only with risk capital. We are not responsible for any third-party links, comments, or content shared on TradingView. Any opinions, links, or messages posted by users on TradingView do not represent our views or recommendations. Please exercise your own judgment and due diligence when engaging with any external content or user commentary.

European Stocks Rise Amid Positive NewsEuropean stock markets are experiencing a steady rise, buoyed by a series of encouraging developments that have boosted investor confidence and driven share prices higher. This wave of optimism is being fueled by both internal economic signals and an improving global environment, including stabilized interest rates and signs of a business rebound.
What's Driving the Growth?
One of the primary catalysts behind the rally is recent economic data showing a slowdown in inflation across the eurozone, alongside a revival in consumer demand. These indicators have strengthened expectations that the European Central Bank may soon pivot from a tight monetary stance to a more accommodative approach. Investors have welcomed these signals as evidence that the regional economy is adjusting well to challenging conditions and avoiding a deeper downturn.
Additionally, stronger-than-expected quarterly earnings reports have played a key role in lifting stock prices, particularly in the banking, technology, and industrial sectors. Major players such as Siemens, BNP Paribas, and SAP have posted solid gains, reflecting broader confidence in corporate resilience.
Renewed Investor Interest in Europe
Improving macroeconomic indicators are drawing renewed attention to European assets. With risks appearing more contained and equity yields remaining attractive, many investors are beginning to view the region as a compelling opportunity. Stock exchanges in Germany, France, and the Netherlands have stood out, showing consistent growth and high trading volumes.
Geopolitical factors are also contributing to the market’s upbeat tone. Gradual normalization of trade relations with key partners and the strengthening of the euro on foreign exchange markets are adding to investor enthusiasm.
What’s Next?
Analysts suggest that if current trends continue, European indices could reach new yearly highs. Key factors to watch in the near term include upcoming central bank decisions and fresh data on GDP growth and employment. Nevertheless, the present sentiment points toward confidence in the ongoing recovery.
Conclusion
The European stock market is entering a phase of stable growth, driven by favorable economic indicators, manageable inflation, and an improving business climate. Positive news continues to give investors reasons for optimism, and if momentum holds, Europe could emerge as one of the top-performing investment regions in the coming months.

Impatience Tax in Trading: The Costs of Clicking Too SoonHave you ever thought that maybe some of your losses don’t come from bad trades? Rather, they come from good trades, timed badly?
You see the setup, the signal’s almost there, the MACD is leaning in, the candle is flirting with support — and boom, you click. Early. Too early.
Price dips a bit more and then shoots upward like a rocket. Your stop gets triggered — you just paid the impatience tax.
Welcome to the place where you get taxed for being impatient — a very real, very expensive fee traders pay when their fingers move faster than their reasoning.
🤫 The Impatience Tax — A Silent Killer Dressed as Urgency
The impatience tax doesn’t appear on your statement. You won’t see it listed in your commissions, or under slippage, or labeled in red ink like a realized loss. But rest assured, it’s there — nibbling away at your P&L every time you front-run your own strategy.
And the worst part? It feels productive. You’re taking initiative, showing conviction, being bold. Except what you're really doing is lighting good setups on fire because you couldn’t wait for one more candle to close.
🧬 The Anatomy of an Early Click
Here’s how it usually goes:
You spot a setup.
You get excited.
You skip the checklist.
You enter on the 3rd candle instead of the 5th.
The market fakes out.
You get stopped out.
The market then does exactly what you expected — without you.
Every trader has lived this story. And it hurts more than a loss from a bad trade. Because this wasn’t a bad idea. It was a good idea butchered by bad timing.
🤝 Impatience Loves Company (And Volatility)
Impatience tends to thrive in fast markets. When the price is moving, you feel like you need to act. You notice some breaking news that moves markets, charts start to jiggle and tickers flash — suddenly your FOMO glands kick in.
You’re not waiting for confirmation. You’re reacting — to price, to emotion, to fear of missing out.
It’s not just beginners either. Even seasoned traders occasionally get sucked in. Why? Because the brain is wired to avoid missing opportunities more than it’s wired to avoid losses. We want in. Now. Before it's “too late.”
But here’s a pro secret: the markets tend to always give second chances. You just have to be around to take them.
⏰ Why the Best Traders Wait
Let’s talk about patience. Not the zen-monk, meditate-in-a-cave-for-years kind. The market kind.
The kind that says: “Nope, not yet.”
The kind that closes the platform until the London session starts.
The kind that lets a trade go because it didn’t meet all the criteria — even if it was close.
Top traders aren’t paid for activity. They’re paid for precision. The entry is 90% of the battle. If you win there, the rest is just management.
🧐 How to Identify an Impatience Habit
Want to know if you’re paying the impatience tax regularly? Try this:
Look at your last 10 triggered stop loss orders: How many were within a few ticks of reversal?
Count your trades per day: Are you averaging more than your strategy demands?
Review your entry notes: Did you say things like “close enough” or “looks good”?
If the answer is yes, you’re a tax-paying member of the Impatience Society.
👷♂️ Build a Buffer: Taming the Trigger Finger
So how do you stop paying the Impatience Tax?
Start with structure:
Use time-based confirmations. Wait for the candle to close. A candle halfway formed is a lie detector test mid-question.
Have a rule-based checklist. If a trade doesn’t meet every item, you don’t take it. No exceptions.
Use alerts , not entries. Let the price come to you. Your job is to hunt, not chase.
Trade fewer setups, better. Less is more when each trade has meaning and clarity.
And when in doubt? Wait. The worst that happens is you miss one trade. The best that happens is you finally stop losing money edge by edge.
💵 Impatience Is Expensive. Patience Is Profitable.
The market is designed to reward discipline, not urgency. Speed might help you scalp news reactions, but even that requires planned execution. Unchecked impatience is just impulse with a brokerage account.
It's important to always remember that you’re not trying to win this trade. You’re trying to win this game for the long run.
And winning the game means surviving long enough to let your edge play out — with patience, not panic.
💎 Final Thoughts: Don’t Confuse Action with Progress
The financial markets are a cruel place for dopamine seekers. They offer constant motion, flashing lights, and infinite temptation to click before thinking.
But progress isn’t about how many trades you take — it’s about how many good ones you wait for.
So next time your mouse finger twitches, ask yourself: Is this the plan? Or is this impatience disguised as opportunity seeking instant gratification?
Because every early click is a donation to someone else’s P&L.
👉 Your turn : What’s your best (or worst) story of jumping the gun? How have you built patience into your process — or are you still wrestling with the trigger? Let us know in the comments!
