£x FUN FACT: If you execute 100 trades you will on average likely lose on 60 or 70 of those.
The key to trading is managing those losses. The other 30 winners will take care of themselves.
That's THE hardest thing for most people to accept - losing more then they win.
If you can win that mental battle, and trade mechanically without emotion, you will be in the top 10% of all traders.
Harmonic Patterns

HOW-TO: Wolfe Strategy [Trendoscope]Just made this short video to explain the concepts of Wolfe Strategy which I recently published.
Wolfe wave is popular concept among option traders. However, I have made some tweaks in this strategy to standard wolfe pattern trade rules.
Entry price based on breakout
No moving target - using flat target.
Entry is done based on risk reward
Not time bound
Intelligently decides whether to place stop order or limit order
Few possible future improvements
Make bidirectional trades possible
Better filters to chose long and short trades or when to trade
Lot can be improved on Wolfe scanner to identify more patterns
Exit strategy - can introduce optional trailing
Thanks for listening. Hope you enjoyed and learnt something from this :)

Trading with Candlesticks Harmony - Above 80% Win RateIn this video I discuss how to use simple wave-analysis and how to use candlesticks harmony in 5 or 15 minutes time-frames to trade with success. This sterategy even works on 1 minute time-frames for some forms of countable harmonies...
---
Gerald Mann was born Mr. Peiman Ghasemi on February 16, 1988. He got deported from Turkey to Iran where he is exit banned now. Alongside trading, he is also wishing to gain the freedom to leave the country. On the other side the silence of the related governmental departments of the U.S. is obvious. There is no answer.

Elena_95 Gold Outlook 2023: The global economy at a crossroadsGold Outlook 2023: The global economy at a crossroads
The global economy is at an inflection point after being hit by various shocks over the past year. The biggest was induced by central banks as they stepped up their aggressive fight against inflation.
Going forward, this interplay between inflation and central bank intervention will be key in determining the outlook for 2023 and gold’s performance.
Economic consensus calls for weaker global growth akin to a short, possibly localized recession; falling – yet elevated – inflation; and the end of rate hikes in most developed markets. In this environment which carries both headwinds and tailwinds for gold, our key takeaways are:
~Mild recession and weaker earnings have historically been gold-positive
~Further weakening of the dollar as inflation recedes could provide support for gold
~Geopolitical flare-ups should continue to make gold a valuable tail-risk hedge
~Chinese economic growth should improve next year, boosting consumer gold demand
~Long-term bond yields are likely to remain high but at levels that have not hampered gold historically
~Pressure on commodities due to a slowing economy is likely to provide headwinds to gold
On balance, this mixed set of influences implies a stable but positive performance for gold
That said, there is an unusually high level of uncertainty surrounding consensus expectations for 2023. For example, central banks tightening more than is necessary could result in a more severe and widespread downturn. Equally, central banks abruptly reversing course – halting or reversing hikes before inflation is controlled –could leave the global economy teetering close to stagflation. Gold has historically responded positively to these environments.
On the flip side, a less likely ‘soft landing’ that avoids recession could be detrimental to gold and benefit-risk assets.
Bumpy road ahead
Economic growth: short sharp pain
There are now many signs of weakening output due to the speed and aggressiveness of hiking moves by central banks. Global purchasing manager indices (PMI), now in contraction territory, indicate a deepening downturn across geographies, and economists are warning of a material recession risk
Consensus forecasts now expect global GDP to rise by just 2.1% next year. Excluding the global financial crisis and COVID, this would mark the slowest pace of global growth in four decades and meet the IMF’s previous definition of a global recession – i.e. growth below 2.5%.
Policy and inflation: higher for longer
It is almost inevitable that inflation will drop next year as further declines in commodity prices and base effects drag down energy and food inflation. Furthermore, leading indicators of inflation tell a consistent story of a moderation.
This brings us to the implications for monetary policy. The policy trade-off for nearly every central bank is now particularly challenging as the prospect of slower growth collides with elevated, albeit declining inflation.
No central bank will want to lose its grip on inflationary expectations resulting in a strong bias towards inflation fighting over growth preservation. As a result, we expect monetary policy to remain tight until at least mid-year.
In the US, markets expect the Fed to start cutting rates in the second half of 2023. Elsewhere, markets expect policy rates to come down more slowly than in the US, but by 2024 most major central banks are expected to be in easing mode.
Macroeconomic implications for gold
Gold is both a consumer good and an investible asset. As such, our analysis shows that its performance is driven by four key factors and their interactions:
1-Economic expansion – positive for consumption
2-Risk and uncertainty -- positive for investment
3-Opportunity cost – negative for investment
4-Momentum – contingent on price and positioning.
These factors, in turn, are influenced by key economic variables such as GDP, inflation, interest rates, the US dollar, and the behavior of competing financial assets.
Recession: portfolio ballast
A challenging combination of reduced but still elevated inflation and softening growth demands vigilance from investors. The likelihood of recession in major markets threatens to extend the poor performance of equities and corporate bonds seen in 2022.
US dollar: trending down
After strengthening for nearly two years straight, the US dollar index (DXY) has recently seen a steep drop, despite continued widening of – both actual and expected – rate differentials. It seems that reduced demand for dollar cash was the likely culprit.
Next year, we see a more complex dynamic driving the US dollar. First the shoring up of energy needs in Europe will, in the immediate future, continue to reduce pressure on the euro. Second, as central banks in Europe, the UK and Japan continue to take a more hands-on approach to their respective currency and bond markets some of the pressure on domestic exchange rates could ease. All things considered, the dollar is likely to be pressured particularly as falling inflation and slower growth take hold. And a dollar peak has historically been good for gold, yielding positive gold returns 80% of the time (+14% on average, +16% median) 12 months after the peak. Although currently very high in REER terms and likely one of the catalysts for the recent turn, the starting valuation for the DXY has been less important in determining the magnitude of gold returns.
Regards:
Elena_95
Merry Christmas

Illan mask Elon Musk: The Federal Reserve's recent rate hike may go down in history as the most destructive in history
News category: negative ⛔️
Summary :
▪️ Tesla CEO and Twitter boss Elon Musk says the Federal Reserve's recent rate hike "may go down as the most damaging date in history." The billionaire has called on the Federal Reserve to cut interest rates immediately, stressing that the US central bank is "drastically increasing the likelihood of a severe recession."
▪️ His warning was in response to a tweet by former investment manager Genevieve Roche-Dektor that "the Federal Reserve has never raised rates faster than this year." At the risk of being repetitive, this Fed rate hike may go down as the most damaging in history, Musk wrote. Roch Decker also included a chart with his tweet showing that the Fed has raised interest rates more and faster this year than at any other time in modern history.
Musk also blamed the Federal Reserve for the loss of Tesla's market value. Investment adviser Ross Gerber tweeted last week: “Elon has now wiped $600 billion off Tesla's fortune and has yet to wipe anything from Tesla's BOD . This is completely unacceptable." Musk replied: Tesla is performing better than ever. We do not control the Fed. Here is the real problem.
▪️ This billionaire has warned several times about the dangers of raising interest rates by the Federal Reserve. Earlier this month, he warned that the recession would worsen if the Fed raised interest rates again. Then the Central Bank increased the interest rate by 50 points after four consecutive increases of 75 points. Last month, Musk warned that "the trend is worrisome" and stressed that the Fed "must cut interest rates immediately." He added: "They are strongly strengthening the possibility of a severe recession." The billionaire also previously said that he believes the recession will continue until the spring of 2024.

BTC movement
Daily
Investigating kinetic and corrective movements in the chart
As you can see in the picture, after each sharp price drop, the price correction based on the drop movement was between 50-61.8%. And in terms of time, the side range has had similar movements. It is expected that we will have another downward lag at least up to the range of 15550-15800.

Market Structure part 1 Smart Money Concept Course Market Structure part 1 Smart Money Concept Course

Market Structure part two Smart Money ConceptMarket Structure part two Smart Money Concept guys this is actually my secound vid on my market structure

Harmonic Pattern with Multiple Confluence for Point X and DThis is an example of regression channel with harmonic pattern.
By using Simple OHLC Custom Range Interactive, we able make confluence point (blue) to get Point X of Bullish Butterfly.
There are many confluence points (orange flag and teal table), which shows Point D of Butterfly starting to complete.
For Point D, best to monitor price changes using RSI or other similar RSI (Cyclic RSI, etc).
Indicator used :
1. Regression Channel Alternative MTF
2. HH-LL ZZ
3. XABCD Harmonic Pattern Custom Range Interactive
4. Simple OHLC Custom Range Interactive
5. Cyclic RSI High Low With Noise Filter

Channel Up and M Pattern (Bullish Bat)This is an example of Channel Up and M Pattern (Bullish Bat).
Found that M Pattern (Bullish Bat) within Channel Up.
Pattern already touches PRZ (orange) and completed TP1 and TP2 (lime).
Indicator used :
1. Regression Channel Alternative MTF
2. HH-LL ZZ
3. XABCD Harmonic Pattern Custom Range Interactive

SMC TrapHello traders
- In this part, we will talk about the smart money trap.
- There are a lot of traps for traders left by big boys in the markets to take your money. That's why it's important to be careful, and don't swim with fish but swim with sharks if you don't want to be eaten.
- The move is designed to first take out early sellers, then take SMC traders.
-We'll explain this example in a few steps:
1) We see that the price is in a downtrend, reacting from OB, and supply has full control in this situation.
2) We can all assume that the price will continue to be bearish.
3) Now you can see that the price is coming aggressively to the last OB, and before that, we had WBOS, and there was a trap made for SMC traders.
4) This is inducement, and we talked about it in one of the previous posts, you can go back to it for a more detailed explanation.
5) This OB is not valid for us, because we have seen a lot of liquidity that the price needs to pick up and an aggressive retest.
6) We waited for the price to pick up all the SMC entries, and then the price came to our safe entry, which is marked on the chart as a valid OB.
If you liked this example, leave a like for more content like this.

History of the American Dollar. Ups and Downs
1825-1906: US begins market operations to maintain the gold standard.
1924-1931: US engages in number of market operations, including buying foreign currencies, to maintain the gold standard.
1934-1961: US Treasury creates the Exchange Stabilization Fund (ESF), conducts frequent operations directly in foreign exchange markets.
1971: Nixon Administration ends USD convertibility to gold, which had become unsustainable due to the large supply of dollars outstanding relative to gold reserves.
1973: US conducts intervention against German mark.
1974: US conducts intervention against Japanese yen.
1976: The USD officially becomes: fiat currency.
1977-1979: Very easy monetary policy weakens the USD. US intervenes often to support USD.
1979: Fed announces change in its open market procedures to combat inflation and, partly, to support a weakening USD.
1980-1981: US intervenes to tame strengthened dollar.
1985: Major economies agree in the Plaza Accord to devalue the USD relative to the JPY and DEM. In the following weeks, US intervenes often, selling dollars for other G5 currencies.
1987: Major economies sign Louvre Accord to halt USD depreciation. In coordinated interventions, US intervenes often to buy USD.
1988 - 1990: US intervenes repeatedly after G7 statement on importance of maintaing exchange rate stability.
1990: USD appreciates on a backdrop of solid economic growth and dormant inflation.
1991-1992: US and European central banks intervene often against the backdrop of a US recession and weakening USD.
1993: US intervenes to buy dollars and sell yen.
1994: Fed unexpectedly starts rate hiking cycle on an improving economy following the recession. US intervenes repeatedly to support the USD.
1998: US intervenes to purchase yen in a coordinated intervention to support Japan's economy following the Asian financial crisis.
2000: Dot-com bubble bursts. leading to recession.
2000: Coordinated G7 FX intervention to support the Euro, initiated by the ECB.
2001: 9/11 attacks increase overall uncertainty. Fed lowers rates to prop up the economy.
2002: Japan intervenes, selling yen for dollars, often supported by the Fed and ECB.
2004-2006: Fed tightens policy to curb inflation.
2008: Global Financial Crisis ushers in an era of exceptionally easy monetary policy in the US, much of the developed world, and some EMs. Flight to safety strengthens the USD.
2010: Euro sovereign debt crisis unfolds.
2011: US. UK and European central banks sell yen in a coordinated intervention following a sharp rise In FX volatility as a result of an earthquake in Japan.
2011: Standard & Poor's downgrades US sovereign debt; flight to safety nevertheless boosts USD in the months that follow.
2014: USD begins to rally on the back of stronger growth relative to other major economies and divergence in DM monetary policy.
2015: Fed begins raising rates.
2015: China surprises global financial markets by devaluing the renminbi for three consecutive days.
2017-2018: USD depreciates on the back of convergence in global growth, President Trump's sentiments for a weaker Dollar, and strength in other major currencies, particularly the euro.
2018-2019: USD rallies on tax reform and Fed's continuing tightening cycle.
2020: COVID-19 spreads globally; recession begins.
March 2022: Fed begins raising rates again.
July 2022: Dollar reaches parity with the euro for the first time since 2002.
Source: Federal Reserve Board, Congressional Research Service, Haver Analytics, various news sources, Goldman Sachs GIR.
Regards, R.Linda!

Paid in Cryptocurrency: The Salary Of The Future?With the introduction of cryptocurrencies into our lives, there have been changes in the economy and our habits. In this century everyone wants to access everything easily and quickly. Likewise, employees want to be paid in time without any effort. So, now we talk about the new idea of salary with cryptocurrencies. These days some brands have started to pay in cryptocurrencies. However, we should take a
look at positive and negative effects and also how and where we can find that kind of job.
First of all, I want to explain how and when cryptocurrencies started. At first it was a long time ago when they found the crypto.
Over years they developed the cryptocurrencies and in 2009 Bitcoin has joined our lives. After Bitcoin came out,
most people realized the importance of crypto.
Actually, it was a good idea to invest in Bitcoin because it was so expensive and you could double your money.
After Bitcoin, some altcoins have started. Ethereum, Dogecoin and many more altcoins are also quite famous.
In fact, a lot of people earn money thanks to cryptocurrencies. But you should be wise about it because it’s like gambling.
Therefore, you should be aware of the risks.
POSITIVE ASPECT OF BEING PAID IN CRYPTOCURRENCY
First and foremost, when receiving payment with cryptocurrency, it doesn’t include any tax. Also the transaction of crypto money is so easy. You can do it
from an application. Another positive aspect of being paid in cryptocurrency is that it can be converted into any currency internationally.
Moreover, for companies looking to hire more employees to work online, crypto can be a great way to pay staff evenly and then have them convert to their local currency.
NEGATIVE ASPECT OF BEING PAID IN CRYPTOCURRENCY
Like every good thing, crypto also has a lot of risks as I mentioned before. In particular, you can either earn good or lose for good, so it can be tricky in many cases. In fact, you can check data and do your research but in the end, you never
know for sure. There are lots of parameters that affect the market prices.
Sometimes that relies on other markets, or politics, or sectors, or even a person. By ‘a person’, you might have an idea of who we are talking about. Of course, it is no one other than, mighty Elon Musk.
In 2021, Elon Musk changed the whole market prices by just mentioning Bitcoin in one of his tweets. Something similar happened when he put the symbol of Bitcoin into the description part of his account. But of course, he is fully aware of his
actions. These actions may be a game to him but ethically, the situation he caused is not fair. In times like this, what is fair is not so important. This is because there is nothing to do to change what happened. Crypto-market can get affected by many different concepts. Because of all this, paying in crypto can be risky and should evaluate positive and negative aspects carefully.
HOW AND WHERE CAN YOU FIND A JOB PAYING IN CRYPTO?
If you want to find a job and receive payment with crypto money, there are a lot of websites and applications for that. For example, you can check out these; Bitcoiner Jobs, Proof of Talent, Crypto Jobs, AngelList. You need to apply them with your CV and you should explain why you are interested in this kind of job. Also you should highlight that you know all the risks. There are vacancies for social media managers, product managers, Graphics designer, Bitcoin Developer etc. So, if you are curious or just fond of trying something new, here is your chance!
I hope you found this post informative and beneficial. Feel free to leave a comment :)

Channel Down and W with Fail PatternThis is an example of Channel Down and W with Fail Pattern.
Found that W Pattern (Bearish Crab) within Channel down.
Fail pattern occurs after Point C, thus RSI need to be reviewed.
Indicator used :
1. Regression Channel Alternative MTF
2. HH-LL ZZ
3. XABCD Harmonic Pattern Custom Range Interactive

Strange similarity between BTCUSDT 4H and USDJPY 3M
I found some intriguing similarities between the BTCUSDT 4h-TF chart and the USDJPY 3M-TF chart.
Although one is a chart of a short to middle timeframe, and the other is of the very long term, the similarity tells something of how a price conversatio shapes under a significant, horizontal supply zone.
Regardless of whether they are the bottom formations or the variations of the bear flag, I read an Elliott-wise flat correction from both charts- what would you think?
For my detailed analysis of both currency pairs, please look at my previous ideas of the links below.

IBM - Harmonics (theory)The first thing to look for when identifying the Bat pattern is the impulsive leg or the XA leg. We’re looking for a strong move up or down depending if we either have a bullish or a bearish Bat structure.
The next thing that needs to be satisfied for a valid Bat pattern structure is a minimum 0.382 Fibonacci retracement of the XA leg and it can go as deep as 0.50 Fibonacci retracement of the XA leg, but it can’t break below the 0.618. This will create the B leg of our Bat pattern.
How to trade the bat pattern
The next thing we’re going to look for is a retracement of the AB leg up to at least 0.382 Fibonacci ratios, but it can’t go above 0.886, and this will create our third point C of the harmonic Bat pattern strategy.
The last thing we want to establish is the D point and in order to get to the D point, all we do is to find the 0.886 Fibonacci ratios of the impulsive XA leg, which will result in a deep CD leg and finally it will complete the whole Bat pattern structure.
In the current scenario, I presented also a surprising correlation between the time cycles, where the X and A leg time frame could indicate potential CD range. As described above - if this scenario turns true and price action will indeed form a bullish harmonic bat here, the initial retracement could potentially reach levels of the previous low of this cycle (X).
This is just a tutorial and an idea for a potential Long, at the bottom of the formation and end of the current time cycle - nevertheless, I mark this idea as Neutral and place IBM in my 'watched' list.

Harmonic Decomposition of Trend Exhaustion - - ALGOUSD (1h)L I N E - W O R K : The foregoing, and more, populate my Object Tree, which is summarized as a separate item, below. Any line or drawing tool that I use frequently is saved as a color-coded template for rapid repetition.
Fib Space - A concrete Leading Indicator comprising several overlapping Fibonacci Trend-Based Extensions and a Retracement or two. Rather than to find Support & Resistance, its purpose is to target Volatility as the areas between highlighted zones.
AVWAP Array - A fluid Leading Indicator comprising several overlapping Anchored VWAPs, as well as some some standard and nonstandard deviations and anchor-points. Although Price itself behaves violently when interacting either with VWAPs, experience shows that the crossing of key VWAPs is a Leading Indicator of high Volatility. Among the VWAps, three in particular deserve special attention, namely the 1.272 Std Deviation VWAP since the chart’s inception, below the current price, as well as those marked by this year’s dates of 2.24 (two-tone red) and 9.8 (two-tone green), above the price.
Further line-work includes a Schiff Pitchfork implied by the right wing of the pattern (points ABC), and a section of a larger bullish arrow consequent to a larger Bullish Harmonic Reversal Pattern that does not fit within the hourly chart.
Notice the use of S-Curves as projected future trend lines, following the conservative path of Maximum Market Pain. Price is like a pendulum. It does not move in straight lines; rather, it describes the struggle between buyers & sellers pulled into maximum commitment before shorter term swings.
See below for more on Harmonics.
. . . . . . . . . . . .
V O L U M E : The various horizontal histograms of volume simply indicate accumulation and distribution. Volume Profiles, however, serve two purposes. 1) As a Lagging Indicator, to discover ranges of Supply & Demand, and the all-important Mean, and 2) as a Leading Indicator to corroborate entries, profit targets and stop-losses, as well as any discretionary management of the latter, if needed. Notice that each day, beginning with the Tokyo Session at 12:00 UTC, has its own 24-hour Volume Profile (see the Object Tree, below).
None of these are as useful as the custom construction in my Object Tree under the name AWAP Array.
In this case, Volume has been healthy partially due to the ongoing FTX Crash (as of this writing), and ALGO tends to have high Volume in general, making it a good indicator of the health of the sector. A recent spike in selling has dropped price to point C which, for those less familiar with them, is NOT considered complete until confirmation at D.
. . . . . . . . . . . .
V O L A T I L I T Y : This is the least understood of the the three fundamental axes of trading, or at least of my style. In any timeframe, price rises more slowly than it falls, which is to say that Volatility is the opposite of price variation. To see Volatility with any hope of clarity, it is essential to remove innate directional bias. In general, it rises sharply and declines slowly. The Question, even more than HOW FAR?, is WHEN? The mystery of Volatility tests, and rewards, patience.
Generally and in this case, too, the greatest Volatility occurred at X, which coincides approximately the 9.8 VWAP and the midpoint between the price drop begun near the 2.24 VWAP and the bottom of that swing, at A. As expected, there is a rise leading into the midpoint of the pattern, B, which is also the second highest price (so far). Another peak in Volatility may be expected at D, if it is reached.
Again, see below for more on Harmonics.
. . . . . . . . . . . .
T R E N D - E X H A U S T I O N : In order to maximize the Risk:Reward ratio, one must act at the edges, or as close as possible. Therefore, one needs an improving sense of where the potential for reversal is highest BEFORE price reaches it. Like Volatility, and unlike Volume, it is impossible to measure directly, and yet with clean Line-Work and a sound market narrative, or trade thesis, various containment and decomposition techniques exist to estimate probable areas in a chart where price vectors will reverse.
In this case, a Schiff Pitchfork is implied by interwoven patterns, among other evidence. Although the Price Action in the near term may be described by it, a larger Bullish Reversal Pattern (to large for the hourly chart) appears to have completed as well, implying an even larger set of Pitchforks.
. . . . . . . . . . . .
H A R M O N I C S : Whether by definition or analogy, harmony implies cooperation between two or more agents. To draw X5 patterns without understanding which elements one seeks to reconcile is like a chimpanzee playing with an iPad. When I draw them, I visualize the interplay of 1) the Range between Supply & Demand, 2) the Volume Spread and 3) Probability over Time.
In this case, in addition to the much larger (green) Bullish pattern completing, a smaller such pattern can be seen in the (red) Bearish Reversal Pattern whose CD Leg comprises the vector of the trade. In effect, the trade can also be seen as the AD Retracement of the smaller Harmonic Bull, since it coincides with the ABC Fib-Based Trend Extension.
Upon the Red W-Pattern are superimposed two smaller bullish patterns, one completed and one potential. Of these, the second marks a point, or an area, of risk along CD Leg.
. . . . . . . . . . . .
F O R E C A S T : Trading the CD Leg of a Reversal Pattern is technically premature, and risky. In this case, not only the coincidence of the Fib ratios but several factors of the Big Picture, as well as the Indicators make this a decent t proposition. As always, there is a point between 1/2 and 2/3 up the vector when it will be tested (and where it tends to fail, if it does fail) therefore some profit may taken along the way. Considering the high R:R Ratio and the duration of the swing, it’s not a bad idea to de-risk.
On this timeframe as of this writing, price is testing the 1.0618 custom “Overthrow” line in the template marked as a “Moving Stop Loss”. Considering recent price drops, this retest near the prospective bottom suggests support rather than a further run to the downside. Also, being a holiday weekend with other markets closed, crypto may indeed have an upsurge due to bored and/or her-eager traders. Setting the left edge of the window to the peak above X, near the 8.9 VWAP, shows the Point of Control of the Visible Range Volume Profile to be above the current price, further suggesting a price reversal in this zone.
_____________________________________________________________________
O B J E C T - T R E E :
The most overlooked tool in Tradingview is the Object Tree. When cleverly rooted, it enables the chartist to arrange (i.e layer) the Drawings and Indicators (if any) and then selectively toggle them on and off.
I am sometimes asked about my suite of indicators, which I have listed below, per the order in which they are layered. (The settings I use are beyond the present scope.) A more relevant detail is that the major Volatility Indicators are placed in the upper windows while those which measure Volume appear in windows below the price action.
In the main window, the preference is inverted. Any original Line-Work that I might create is collected beneath all (12) Indicators.
Again, the purpose of this groundwork to deliberately overlap objects and to selectively turn them on or off like light bulbs in order to discover and/or important but not obvious facts about the potential action space.
. . . . . . . . . . . .
Tesla Coil
____________________________________
Average Volatility Movement
____________________________________
Buying & Selling Pressure
Average True Range (Line)
Average True Range (Histogram)
____________________________________
ALGOUSD, COINBASE, 1h
Indicators VSA v6
Volume Pressure Analysis
Time Segmented Volume Bands
Visible Range Volume Profile
Periodic Volume Profile
Daily High/Low/Mid/Open/Close+Weekly/Monthly Open
Volatility Stop MTF
Volatility Bands by DGT
Double SuperTrend ATR
Moving Average Shaded Fill Area Crossover EMA
Moving Average Ribbon
>📁”Object Group 1”
>📁”Object Group 2”
>📁”etc.”
____________________________________
Time Segmented Volume Bands
____________________________________
Heatmap Volume
Volume Analysis
Time Segmented Volume Bands
. . . . . . . . . . . .
R E M A R K S : I will attempt to post a larger, higher timeframe view of the position, showing the major Bullish Reversal possibly beginning, or at least the end of selling pressure.
🧸

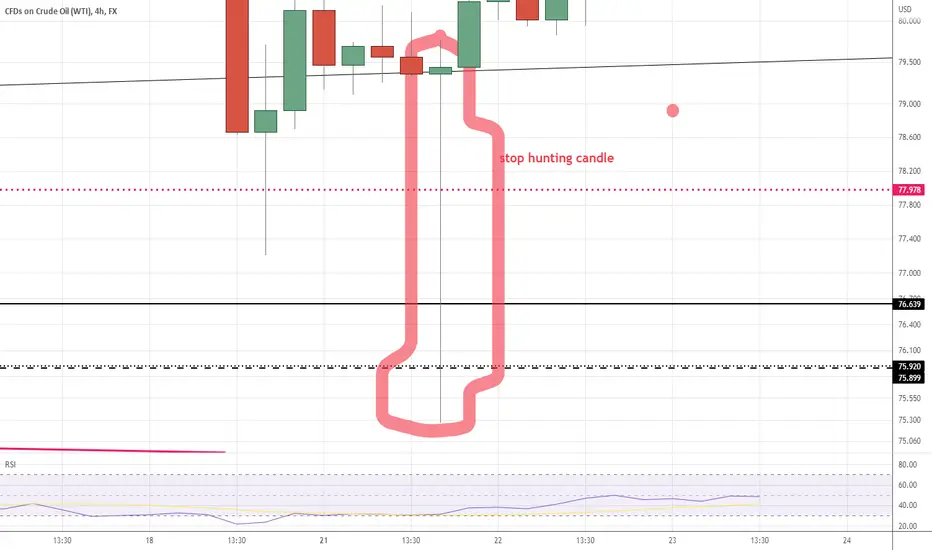
stop hunting by intermediary bank ,unauthorized brokerCurrently, there is a strategy that is followed by most investment banks around the world, and that is known as Stop Hunting. It attempts to force some market participants out of their positions by driving an asset’s price to a level where many retail traders set their stop-loss orders. The triggering of many stop losses at once generally leads to high volatility, and this can present opportunities to some smart traders who seek to trade in such an environment.
The fact that the price of a currency pair can experience sharp moves when many stop losses are triggered is exactly why many traders engage in stop hunting. Traders who are aware of this fact and have observed this phenomenon of the market try to make of this opportunity by being patient and conservative.
as some banks and brokers are aware of traders stop levels they push the asset toward those stops to collect them and the result is fake break out with which both sellers and buyers are losers .
Money Affects HappinessConventionally, we used to hear the saying, "Money can't buy happiness.". Is it really true? Let's look at some facts about happiness, money, and life.
Easy to talk about happiness and specific amounts of it, but how do we measure happiness in real life? It isn’t something we perceptibly see in a computer game. In fact, it is more like a feeling and believe it or not, there are ways to measure it.
How To Measure Happiness?
As we look at the behavioral aspect, when we feel happy our behaviors change. We smile more and feel much more energetic. Hence we might be much more patient and helpful to others. However, any external factors can affect our happiness, which simultaneously affects our behaviors such as sun, exercising, eating, etc. Other than our behaviors, there are some biological ways to assess and reveal people's happiness levels in laboratories, but these are way too scientific. Reports, on the other hand, are another helpful source of information. In Particular, we can consider self-reports of people about their emotions and the feedback from other people. For example, as a parent, brief information about their child's emotional state to another person is valuable feedback. Of course, this data is mostly based on a person's emotional well-being, but it is also helping researchers carry out certain types of studies.
Attitudes Towards Money
For most people, the relationship with money, happiness, and living standards compose complicated relationships. It isn't like something that turns off when they achieve a certain amount of wage per year. They want more. Therefore, they try to find ways to earn more, usually by advancing in their career, which results in economic growth on a societal basis. On the other hand, things may lead in a different direction. More income means more flexibility on living expenses. However, with the pandemic, things started to change dimensions. The pandemic was actually the emergence of some crises. Some people lost their jobs or gave up what they love for the sake of themselves and their loved ones. Thus, the pandemic started a new pursuit to make money in challenging times. So happiness had to be put away from people in order to survive. For some people, money might be the indicator of success. In that case, if you are not earning much from your current job, you might think, "Am I not successful enough?" That creates a twisted sense of success and affects the lives of many. For some other people, however, only the job they are performing gives their lives a purpose that brings happiness simultaneously. As you can see, "money" can be determined in many ways depending on the person.
Killingworth's Study
In this post, I will also talk about a study by Matthew Killingworth. This research was conducted to measure people's well-being by collecting data from them on a daily basis. Actually, it has an extremely interesting content-collecting process. At some point, he links people's happiness with their income, as I mentioned before.
According to a paper from 2010 by Daniel Kahneman and Angus Deaton, well-being stops increasing after achieving a $75,000 annual salary. In his study, Killingworth declares that the possibility of increasing well-being stops after some time. This is since money no longer means something. However, he suggests well-being continues to increase with income as it can also give some satisfaction even just to see the ability to make "more" money.
Following on the study, Killingworth highlights that people earning more are happier. This derives from their high income and the possibility of doing things without doubt and worry. Who wouldn't be pleased by not caring about money while doing things they want to do? On the other side of the story, working excessively to earn more brings problems such as depression. People who link their self-worth with their income most definitely suffer from stress and, even more, depression. So, the key is trying to keep everything at proper and healthy levels. For example, the passion of earning more or dreaming about an alternative life that comes with more money.

How to save money as a student Many students are trading crypto, forex or stocks so this time we have something for you! We hope that you will find this publication interesting and beneficial! Enjoy!
Although your time as a student is the best time of your life, it is way more expensive than it should be. You want to discover, learn, meet new people, try new food and go to new places. At the same time you aren’t earning your own money yet and your books are your best friends every evening . Therefore, even if you don’t have to pay thousands euros for your education every year, it might be difficult to manage and save some money during your student time.
Fortunately, there are some simple ways to save money while still having fun and enjoying being a student. But before sharing with you those tips, there is one thing that is even more important for you to remember: adopting a saving mentality. You need to realize that being economical is a mindset. So, if you are open to trying it, follow the advice we are going to give you. It doesn’t mean that you have to give up all the things you love doing because they cost you a lot of money. Instead, you need to find a balance between being economical and treating yourself from time to time.
⦁ Set a budget & follow the 50/30/20 budget rule.
Before anything, it is important to be aware of the money that you receive every month. The 50/30/20 rule is a perfect budgeting rule for beginners. It means that you split your money into 3 categories: needs, wants and savings. In general, it looks like this: 50% of your money goes toward your absolute necessities (rent, transportation etc.). Then, the 30% goes to things that you want but not necessarily need (eating out, going to a concert, buying a book). So, what’s left is the last 20% which goes towards your financial future: saving money aside to reach your goals and stay calm in an emergency situation.
⦁ Cook your own food & be smart at the supermarket
While eating out might be very tempting, it certainly won’t be beneficial to your wallet. Try to set out a rule of eating out for example once a week, or once every 2 weeks. Secondly, never do your grocery shopping when you are hungry as this is the easiest way to overspend your weekly budget. Last but not least, make sure to plan your meals in advance. It will help you estimate how much the ingredients will cost and also actually use the products that you will buy. And if you have a whole day of classes ahead of you, make sure to prepare enough food for the day.
⦁ Explore student discounts
Being a student has many perks, and one of them is student discounts. If you know where to look, you can easily save on movies, travel, food, retail, software and many more. In addition, when you are looking to buy something specific, try googling if there is a student discount on this product. For example, ‘Adobe Photoshop students’ sends you directly to a discount page for students and teachers. Or, if you are looking to buy a new laptop from Apple, definitely check the ‘back to school’ discount that the company offers every year.
⦁ Cut out unnecessary subscriptions
This one is especially important when you are planning out your monthly budget. By checking on all your subscriptions you can cut out regular payments you don’t use before the prices go up. Nevertheless, if for example paying 15 euro per month for Netflix keeps you from going to the cinema every week, you should definitely keep that subscription.
⦁ Find a side hustle
Although you don’t have time for a full time job during your studies, you can definitely afford to spend 10-20 hours a week by earning some money on the side. It can be a very simple job, such as working in a coffee shop or a restaurant but there are also plenty of online opportunities! You could become a virtual assistant, for instance. That means mainly helping your clients manage their day-to-day life by answering emails, booking flights and organizing their schedule. Or, if you are fluent in 2 languages or more, you could try freelancing as a translator on websites such as Fiverr or UpWork.
⦁ Share a flat with your friends
Another way of saving money while being a student is sharing a house or apartment with more people instead of living alone. By splitting the rent, but most importantly also all the utility bills you will save a significant amount each month.
⦁ Search for free entertainments & get creative
Social life is probably one of the most expensive things in your student life. Most of the activities cost money, but there are many less expensive ways to have fun with your friends. Why not have a picnic instead of eating out for the third day in a row? Or going hiking in the valley closeby instead of going to the overpriced party on Saturday night?
To conclude, even though you might not have enough money as a student, there are tons of ways to save what you have. In fact, you can even earn some money by doing a part-time job. Hence, following the tips mentioned above will help you create a healthy balance and good relationship with money for the future.

Macro Harmonics of Bitcoin: How & When the Bull will RIseHARMONIC: Whether by definition or analogy, harmony implies cooperation between two or more agents. To draw X5 patterns without understanding which elements one seeks to reconcile is like a chimpanzee operating a flight simulator on an iPad.
When I draw Harmonic Patterns, I visualize the interplay of:
1) the Range between Supply & Demand
2) the Volume Spread
3) Probability over Time.
I use this particular chart layout to forecast the Big Picture, and another for trading on the small time frames. The BTC/USD Index has the longest price history, and these data appear both in the Fib Space and in the AVWAP Array.
For live trading, different data are needed. I post this now as a reference for the future, and a point of comparison with other charts and ideas in other time frames that I hope to post in the coming days and weeks.
For what it's worth, my goal is to get enough followers to start streaming here. With that in mind, I welcome technical questions. Cheers.

double X vortexgreat balls of crossing vortexes .
MA cross isnt accurate by itself and tends to flip flop too much untill the asset makes a price break. The vo4tex just vap8day4s it that way not to buy too soon or sell too soon and go back the other way.
Tue two vortexes idea is so you can input two separate time variables. Which seems to makeit pretty dang accurate.Double vortexes along with the MA Cross seems to be about 95% accurate and the other 5% it adjists for it pretty quickly. The other 5% is only when trading pair volume is low or large gap between buy and sell trades.. i have tested it and used it and fine tuned it over the past 8 months for my manual trades. It also does well on any timeframe with my settings. I just need to now make it live and automated.
Its very simple to use and read(if your not color blind, that is)
Just pick and timeframe depending on how long you plan on sitting
there or how often you plan on checking it to make a trade every min, 5,15,30min,1hr,2,4,8hr,1day,or once a week.,.
Then just wait for the green lines to cross the red lines
Dont make a trade untill both charts
green lines cross up above red lines to buy.
Or
both green lines cross down below red lines to sell.
(advice: dont make trade when vortex lines at thier peak.unless you have some inside info or a good hunch to do otherwise.)
Good luck
if anyone out there like to use this, and can possibly help me.I would be extremely grateful.
I would like to figure out how to make visible cross when green line on one vortex crosses the red line of the other vortex.
After that i could use some help making that into an alert when both charrts green lines have crossed up and only after both have crossed the red lines down as the other alert.
Thank you for reading ,Enjoy ,;^j d°_•°b ¶<% ¶^& 8>D ({|})

How to trade Breakout/Breakdown from consolidation pattern?1) What is a consolidation?
Consolidation means when the price of a stock or security moves sideways within a range.
In this pattern the price makes the same highs and/or same lows. The highs form a resistance level, and lows form a support level. The longer the consolidation is, the stronger the breakout/breakdown will be.
When the price is moving within the range you can not really predict if it will go up or down, you always have to wait for the breakout/down to enter the trade. Once the channel is broken it usually leads to a stronger up/downtrend.
Breakout
We are talking about Breakout pattern when the price that has been moving within the range of the consolidation pattern breaks above the previous resistance line. At this momentum,
when we have a confirmation candle, there is a high probability that it can be a start of a new uptrend, and we can enter the trade.
Breakdown
In case of a Breakdown, the price is moving downwards, and not only hit but breaks out of the support level. We need a confirmation candle to ensure that there is a high probability that bearish momentum will trigger the start of a new downtrend and it is a good time to enter short.
2) What are the valid consolidation patterns?
Consolidation pattern does not mean in every case that the price must make the same highs and the same lows at the same time. For a Breakout pattern from the consolidation we want to see a strong, flat top resistance line that is tested three times or more. The price can either make the same lows or higher lows.
On the other hand, when we are talking about a Breakdown from the consolidation, we are always looking for a strong support line that is tested at least three times before. In this case,
the consolidation pattern can be either making same highs or lower highs.
3) How to identify a Breakout/Breakdown momentum and which indicators to use?
We only want to enter the trade on a breakout/breakdown with a high probability of succeeding and for that we always want to see a confirmation candle after the price breaks above or below the range to avoid false breakouts. For a Breakout, the candle must be bullish and open and close above the resistance level and it must be near the 20EMA.
In case of a Breakdown the bearish candle body must open and close below the support line and the breakout candle must be near or touching the 20EMA.
Indicators (examples)
Force Index (13) measures the strength of the volume. When the Force Index is above the zero line, that tells you that the market is bullish. If the price goes under the line, the price is bearish. So, when we want to go long, make sure that the Force Index is above the signal line and it’s rising. When we want to sell, then the Force Index should be under the signal line and falling.
or
MACD (12,26,9) When the MACD line is above the signal line, it means that the momentum is bullish (good if you want to go long) if it goes under the signal line, means the market is bearish (great time to enter short).
