Sarhan smart map 📌 ** SARHAN Smart Map – Advanced Smart Money Trading Suite**
SARHAN Smart Map is a comprehensive institutional-style toolkit built for traders who apply Smart Money Concepts (SMC), market structure analysis, and liquidity dynamics. The system integrates multiple visual tools into a unified, modular environment designed for real-time decision-making and educational purposes.
---
## 🔍 Component-by-Component Breakdown:
### 1. **Market Structure (Break of Structure & Change of Character)**
- **Logic:**
The indicator identifies major structural shifts using pivot high/low logic.
A **Break of Structure (BOS)** is triggered when price breaks the last swing high/low in the direction of the trend.
A **Change of Character (CHoCH)** occurs when price breaks structure *against* the current bias, signaling a potential reversal.
- **Usage:**
Use BOS to confirm continuation and CHoCH to anticipate possible trend changes. Traders can use structure as a foundation for bias.
---
### 2. **Order Blocks (OBs)**
- **Logic:**
Order Blocks are derived from the last up or down candle before a major BOS or CHoCH.
The system plots OB zones and marks whether they are active, mitigated, or invalidated.
- **Usage:**
Use OBs as potential reversal zones. Confluence increases when OBs align with FVGs or liquidity pools.
Ideal for anticipating institutional re-entries.
---
### 3. **Fair Value Gaps (FVGs)**
- **Logic:**
FVGs are identified when there is a gap between the high of one candle and the low of the next (or vice versa), indicating price imbalance.
These gaps are considered areas where price might return to "rebalance".
- **Usage:**
Entries can be refined when price returns to FVG zones, especially if they overlap with structure or OBs.
---
### 4. **Liquidity Grabs**
- **Logic:**
These are fakeouts or "stop hunts" that occur when price briefly breaks previous highs/lows before reversing.
The tool detects these and labels them accordingly.
- **Usage:**
Liquidity Grabs often occur before real moves. Use them as a signal of possible institutional interest or trap setups.
---
### 5. **Buy-Side & Sell-Side Liquidity Pools**
- **Logic:**
The system calculates clustered recent highs (buy-side) and lows (sell-side) to project potential liquidity areas.
These are visualized as zones above/below the current price.
- **Usage:**
Use these to predict where price may be "drawn" next. Confluence increases when price is near a structure shift + liquidity.
---
### 6. **Premium & Discount Zones**
- **Logic:**
Based on the current visible range or recent structural high/low, the script divides price into:
- **Premium** (expensive zone)
- **Discount** (cheap zone)
- **Usage:**
Traders can filter trades to only Buy in Discount and Sell in Premium.
Works great as a higher-timeframe bias filter.
---
### 7. **Trend Filter**
- **Logic:**
A moving average is applied and used to color candles or background based on directional slope.
Optional, customizable, and doesn't override structure bias.
- **Usage:**
Helpful to stay aligned with dominant momentum or to avoid counter-trend trades.
---
### 8. **Sessions Overlay**
- **Logic:**
Draws visual blocks for Asia, London, and New York sessions using time filters.
- **Usage:**
Useful to determine when certain setups happen (e.g., OB formed in London → mitigated in NY).
---
## 🧠 How to Use the System:
1. **Start with Market Structure:** BOS and CHoCH give you directional bias.
2. **Mark OBs & FVGs:** Look for confluence in Discount or Premium zones.
3. **Watch Liquidity Pools & Grabs:** Confirm entries with smart money traps or targeted zones.
4. **Use Session Filter (Optional):** Look for timing consistency.
5. **Adjust settings per asset and timeframe.** The system is modular – enable only what fits your plan.
---
## ⚠️ Notes on Reuse:
This script contains modified logic adapted from open-source TradingView indicators, including public implementations of:
- FVG detection
- BOS/CHoCH logic
- Liquidity pools visualization
All reused components have been rewritten, extended, and unified into a proprietary framework.
---
## 📎 Disclaimer:
This indicator is for educational and informational purposes only.
It does **not** provide financial advice or guaranteed results.
Trading involves risk – use with proper backtesting and money management.
---
🧩 Built by MAHMOUD SARHAN
Chart patterns

[Top] BoS Fibonacci Scalping BoS Fibonacci Retracement Scalping Tool
This indicator is an advanced market structure analysis and scalping toolkit that combines Break of Structure (BoS), Change of Character (ChoCh) detection, dynamic Fibonacci retracement levels, and a Zig Zag visualization to help traders identify actionable trading opportunities.
How It Works
1. Market Structure Detection (BoS & ChoCh)
Pivots and Order Blocks:
The script automatically detects major and minor swing highs and lows (pivot points) using configurable pivot periods.
Break of Structure (BoS):
When price crosses a key structural level in the prevailing trend direction, a BoS event is marked.
Change of Character (ChoCh):
When price crosses a key level in the opposite direction of the previous trend, a ChoCh event is flagged, signaling a possible trend reversal.
Each event draws labeled horizontal lines and optional labels on the chart.
2. Fibonacci Retracement Engine
After a BoS, the indicator waits for a retracement (configurable by number of bars or conditions).
It then plots Fibonacci retracement levels (0.0, 0.5, 0.618, 1.0) between the last significant swing and the breakout level.
A colored "Golden Zone" (50–61.8%) is highlighted to assist in identifying potential pullback entries.
3. Zig Zag Visual
An optional Zig Zag line shows the evolving swing structure and helps clarify major and minor highs and lows.
4. Potential BoS Levels
When no retracement is active, the indicator can display dotted "Potential BoS" lines above/below price to alert you to possible upcoming breakouts.
Inputs and Customization
You can configure:
Pivot Periods: Separate lengths for order block and Fibonacci detection.
Retracement Settings: Number of bars defining a retracement and how long to wait for it.
Drawing Extensions: How many bars to extend lines forward.
Labels and Colors: Toggle labels, adjust colors and line styles for each structural level.
Major and Minor BoS/ChoCh Levels: Show or hide specific types of structure lines (bullish/bearish, major/minor).
How to Use
Identify Trend & Structure:
Watch for BoS or ChoCh lines and labels to confirm trend continuation or reversal.
Plan Pullbacks:
After a BoS, wait for a retracement into the Fibonacci Golden Zone.
Use the zone and retracement lines as reference for entries and risk management.
Combine with Other Confirmation:
This script works best when combined with volume, momentum, or price action signals.
Scalping and Swing Use:
Short-term traders can use it on intraday timeframes, while swing traders can apply it to higher timeframes for structural analysis.
What Makes It Unique
Unlike simpler BoS indicators, this script:
Distinguishes between major and minor structural breaks.
Automatically manages retracement logic and invalidation.
Visualizes structure dynamically in real time.
Includes extensive customization of visual elements to suit different trading styles.

Min Forrige Daily CandleBruges til at se forrige daily candle. Daily high, low og close. Kan bruges til teknisk analyse.

Elliott Wave - Complex Correction Pattern DetectorThis indicator is for Elliott Wave corrective patterns. It’s highly lagging, so just like with the impulse and terminal indicators, it’s intended purely for study and practice. I’m about a third of the way through the book right now, and my brain feels like it’s about to explode—😱but I have to say, this theory is incredibly fascinating.
As with the impulse and terminal indicators, this one is also pivot-based, so there are some obvious limitations in the results. Still, I believe that comparing my own manual counts with the rules programmed into the macro will be even more helpful for learning.
I hope that by sharing this, it can help students or beginners who are currently studying Elliott Wave theory. 😁

ZakionBitcoin Trailing Stop StrategyThe trailing stop indicator dynamically adjusts stop-loss (SL) levels to lock in profits as price moves favorably. It uses pivot levels and ATR to set optimal SL points, balancing risk and reward.
Trade confirmation filters, a key feature, ensure entries align with market conditions, reducing false signals. In 2023 a study showed filtered entries improve win rates by 15% in forex. This enhances trade precision.
SL settings, ranging from very tight to very wide, adapt to volatility via ATR calculations. These settings anchor SL to previous pivot levels, ensuring alignment with market structure. This caters to diverse trading styles, from scalping to swing trading.
The indicator colors the profit zone between the entry point (EP) and SL, using light green for buy trades and light red for sell trades. This visual cue highlights profit potential. It’s ideal for traders seeking dynamic risk management.
A table displays real-time trade details, including EP, SL, and profit/loss (PNL). Backtests show trailing stops cut losses by 20% in trending markets. This transparency aids decision-making.

Mean Reversion Multi IFVG strategy - QuantShokThe Mean Reversion Multi IFVG strategy, gives you entries when liquidity has been swept and a IFVG has been formed and retested. Based off of ICT this indicates a strong reversal, which is what the strategy capitalizes on. The indicator will plot out CTF, 2m, 3m, and 5m IFVGs that have been tested as a support or resistance after a sweep. It is best too use a entry too target unmitigated PD arrays or untapped liquidity. This indicator is intended for the nasdaq but do with it as you wish, additionally it is very customizable the default setting are recommended.

MWA swing high & lowThis indicator identifies and connects significant swing highs and swing lows on the chart using customizable pivot-based logic. It creates a ZigZag-style structure that helps traders visually analyze price action, market structure, and trend direction.
🧠 Key Features:
Detects pivot highs and lows using left/right bar logic.
Plots a ZigZag line connecting swings for easy visual tracking.
Labels each swing as "Swing High" or "Swing Low".
Fully customizable settings: pivot sensitivity, label color/size, and line color.
📈 How to Use:
Use it to spot higher highs/lows or lower highs/lows in trending markets.
Identify structure shifts that may signal trend reversals.
Combine with support/resistance, Fibonacci, or other structure-based tools for confirmation.
Suitable for discretionary or rule-based strategies.
⚠️ Disclaimer:
This script is a visual analysis tool. It does not generate buy/sell signals and does not claim profitability. Past structure patterns do not guarantee future results.

Fair Value Gap [Custom]📌 FVG Indicator – Smart Money Concepts Tool
This script is based on Smart Money Concepts (SMC) and automatically detects and marks Fair Value Gaps (FVG) on the chart, helping traders identify unbalanced price areas left behind by institutional moves.
🧠 What is an FVG?
An FVG (Fair Value Gap) is the price gap formed when the market moves rapidly, leaving behind a candle range where no trading occurred — typically between Candle 1’s high and Candle 3’s low (in a three-candle pattern). These gaps often signal imbalance, created during structural breaks or liquidity grabs, and may act as retrace zones or entry points.
🛠 Features:
✅ Automatically detects and highlights FVG zones (high-low range)
✅ Differentiates between open (unfilled) and closed (filled) FVGs
✅ Adjustable timeframe settings (works best on 1H–4H charts)
✅ Option to toggle display of filled FVGs
✅ Great for identifying pullback entries, continuation zones, or reversal setups
💡 Recommended Use:
After BOS/CHoCH, watch for price to return to the FVG for entry
Combine with Order Blocks and liquidity zones for higher accuracy
Best used as part of an ICT or SMC-based trading system

Smart Directional Fib Zone (Selectable Session)🎯 Overview
This indicator plots a dynamic Fibonacci zone between the 0.5 and 0.618 levels , calculated from the previous day’s price action , and is designed specifically for intraday traders.
It visually highlights key retracement or reaction areas where the market often pauses or reverses.
🔍 How it works
At the start of each day, the script automatically captures:
the previous day’s open (pdo),
high (pdh),
low (pdl),
and close (pdc).
It then determines if the previous day was bullish (Close > Open) or bearish (Close < Open).
Based on that:
If the previous day was bullish, it projects the Fibonacci levels down from the high (typical for expecting retracements).
If bearish, it projects them up from the low.
The two key levels are:
0.5 (50%) retracement / projection
0.618 (61.8%) retracement / projection
A colored zone is plotted between these levels to act as a leading guide for intraday setups.
⏰ Time filtering & session customization
A unique feature is the dynamic session filtering:
By default, the zone is only plotted during active market hours, keeping your chart clean outside trading hours.
The script provides a dropdown selector so you can quickly switch between:
India session (9:15 to 15:30)
Europe session (9:00 to 17:30)
US session (9:30 to 16:00)
Or even define your own custom session times.
This makes it ideal for intraday traders in any region.
🎨 Visual features
The fill zone changes color based on the previous day’s sentiment:
Green zone if the previous day was bullish
Red zone if the previous day was bearish
🚨 Alerts
The script includes an alert condition, so you can easily set up TradingView alerts to notify you when:
Price enters the Fibonacci zone.
This is extremely helpful for catching retracements or reversals without staring at the screen all day.
⚙️ How to use
✅ Works on any intraday timeframe (1 min, 5 min, 15 min, etc.).
✅ Simply add it to your chart, pick your session in the dropdown, and watch the Fibonacci zone automatically adjust to your selected market hours.
Use it as a confluence tool alongside other indicators like VWAP, EMAs, Bollinger Bands, or price action patterns to time entries and exits.
💪 Why this is powerful
This is more than a simple Fib retracement tool:
It dynamically adapts to the previous day’s sentiment, helping you trade in alignment with recent market psychology.
The session filtering ensures your charts are focused only on the periods


Retracement Bar🔍 Retracement Bar – RB
The Retracement Bar (RB) indicator is designed to highlight potential reversal zones by identifying candles where price shows a clear rejection from the extremes. It helps traders spot moments where institutional inventory rebalancing may be occurring — often a precursor to a strong move in the opposite direction.
RB highlights bars that:
Have a relatively small real body compared to the total candle range.
Show a long wick (upper or lower) that exceeds a user-defined percentage of the candle range.
Suggest a potential rejection of price — upward or downward — based on candle structure.
When these conditions are met, a triangle symbol is plotted:
🔻 Red triangle above a candle suggests a possible short opportunity.
🔺 Green triangle below a candle suggests a possible long opportunity.
This indicator does not repaint and triggers only at candle close.
📈 Example – Long Entry
Signal: A green triangle appears below a candle (suggesting rejection of lower prices).
Steps:
Wait for the current RB candle to close.
On the next candle:
Enter long if price breaks above the high of the RB candle.
Alternatively, wait for a pullback and enter based on confirmation (e.g., bullish engulfing, hammer, trendline bounce).
Place a stop-loss just below the low of the RB candle.
Set a target:
Based on a 2:1 risk-reward ratio.
Or use the next resistance/Fibonacci level.
📉 Example – Short Entry
Signal: A red triangle appears above a candle (suggesting rejection of higher prices).
Steps:
Wait for the current RB candle to close.
On the next candle:
Enter short if price breaks below the low of the RB candle.
Or wait for confirmation (e.g., bearish engulfing, shooting star, breakdown from a level).
Place a stop-loss just above the high of the RB candle.
Set a target:
2:1 risk-reward ratio.
Or the next support/Fibonacci zone.
✅ Recommended Filters for Better Results:
Confluence with support/resistance zones.
Trend alignment or reversal context.
Additional confirmation from price action patterns or oscillators.
Volume analysis for entry strength.
🙏 Acknowledgment
Special thanks to Rob Hoffman for inspiring this concept through his original Inventory Retracement Bar (IRB) idea — this indicator is a reinterpretation meant to visually and practically support discretionary price action traders.

DAX Setup ScreenerPine Script – Setup Screener
This code detects:
Range trading zone
Breakout long & breakdown short signals
With visual overlay
Use it like this:
Adjust rangeHigh, rangeLow, and breakoutBuffer
Enabled: Draws signals on the live chart

Smart Money Concepts smart money concept with high and low.new concept that will tell you about support and resistance also discount and premium zone's.

BullTrading Easy Tops & Bottoms / Community Edition🚀 BullTrading Easy Tops & Bottoms – Community Edition
🎁 100% FREE – Yours Forever | From Trader to Trader
After 10 years of chart obsession, late-night testing, and real market grinding... I’m finally releasing my most reliable scalping tool – FREE for every trader who refuses to quit.
Introducing: BullTrading Easy Tops & Bottoms – Community Edition – a battle-tested, no-nonsense indicator designed to pinpoint high-probability reversal zones on the 5-minute chart.
No subscriptions. No premium upgrades. No BS. Just pure edge, given back to the community that helped me survive the chaos of trading.
🔥 What Makes It Different?
🟩 Green Zones = Strong BUY Signals at Local Bottoms
🟥 Red Zones = Strong SELL Signals at Local Tops
🔳 Visual Boxes show EXACT entry areas – easy to spot, easy to act
💯 No Repainting.
What you see is what you trade.
⚡ Tailored for Speed:
* Perfect for 5-minute scalping
* Built for Forex, Crypto, Stocks, Indices
* Works on any broker, no complex setup
* Instant zone detection – no guesswork
* Display exact proportions for Stop & Reverse Entries SSR!!
📊 Pro-Level Intelligence:
* Historical Zone Memory for backtesting & learning
* Automatic Zone Expiration when levels break
* Multi-session optimised (Asian, London, NY)
* Clean interface = Maximum focus
🎮 How to Use It:
1. Add it to your 5-minute chart
2. Wait for a zone to appear, then wait for the signal
3. Enter when price taps the zone boundary
4. Manage your trade based on your preferred R:R
✅ Done.
🧠 Why I’m Giving This Away for Free:
Because I know what it feels like to burn money on overpriced tools that overpromise and underdeliver.
Because I found something that works for me – and I want it to work for you too.
Because real success should be shared, not sold.
This is my way of giving back.
This is our Community Edition – powered by traders, for traders.
🔥 THE CHALLENGE:
If this tool helps you grow your account, land cleaner entries, or find more confidence in your strategy or fund yourself with a prop firm.…
I dare you to share it.
💬 Drop your wins, screenshots, and stories in the comments.
📢 Let’s build a feed full of real results from real traders.
That’s all I ask in return for a tool that could change your game.
⚙️ Quick Settings Overview:
* Show Signals: Enable/disable zones
* Signal Duration: Set how long zones stay active (default: 288 bars)
* Historical Days: Load past zones for testing (default: 7)
💬 Support & Community:
This is a community-powered release. That means no private support, but the comment section is your home base.
✅ Ask questions
✅ Share tips
✅ Show off your setups
We’re in this together.
🔁 Ongoing Updates:
I’ll keep improving this based on community feedback. So keep sharing, testing, and suggesting.
🌟 Final Thoughts:
This is not a “get rich quick” hack and still needs further refinement.
But it is a powerful tool built from real experience. It won’t trade for you – but it will help you see cleaner opportunities if you use it with discipline.
If you love it:
⭐ Add to your favourite Indicators
💬 Post your wins below
🔄 Share with a trader who needs a real edge
Let’s flip the odds in our favor.
Let’s dominate the charts.
Let’s do it together. 💪
#topsandbottoms #tradingcommunity #5minutetrader #scalpingedge #forex #crypto #stocks #traderlife #freeindicator #bulltrading
📜 Legal Disclaimer – BullTrading Easy Tops & Bottoms – Community Edition
The BullTrading Easy Tops & Bottoms – Community Edition indicator is provided for educational and informational purposes only. It is not intended as financial, investment, or trading advice, and does not constitute a recommendation to buy, sell, or hold any financial instrument.
Trading financial markets involves substantial risk. Past performance of any trading strategy or indicator is not indicative of future results. Users of this indicator assume full responsibility for their trading decisions. No guarantees are made regarding the accuracy, reliability, or profitability of the signals generated by this tool.
This indicator is offered 100% free and as-is, without any express or implied warranties. The creator, Akuma Epic Studios FZCO, and BullTrading Asset Management SAPI de CV shall not be held liable for any losses or damages, direct or indirect, arising from the use, misuse, or reliance on this tool.
All trading decisions should be made with consideration of your financial situation and risk tolerance. Consultation with a licensed financial advisor is strongly recommended before making any investment decisions.
By using this indicator, you acknowledge and agree to these terms. Your use constitutes acceptance of full responsibility and the understanding that trading is inherently risky and should be approached with caution and discipline.

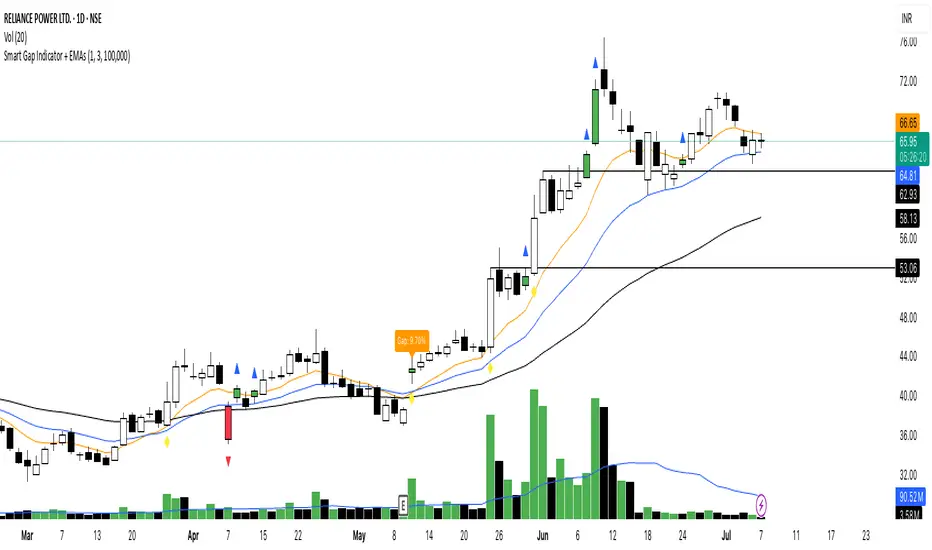
Smart Gap Indicator + EMAs📈 Smart Gap Indicator + EMAs
Spot high-impact gaps with precision and confidence.
🔍 What it does:
This tool identifies and highlights strategic price gaps that often precede strong directional moves. It filters out noise by combining advanced logic with volume activity and trend bias, helping you focus on the most relevant setups.
📊 Key Features:
Smart Gap Detection – Automatically detects meaningful gap up/down events based on dynamic thresholds.
EMA Trend Filter – Optional multi-EMA filter (10, 21, 50) to help align trades with the prevailing market trend.
Volume Spike Signal – Highlights volume surges that may indicate institutional involvement.
Clean Visuals – Configurable labels, shapes, and optional gap fill lines to aid quick interpretation.
Gap Performance Table – Summarizes recent gap activity to assess directional bias.
⚠️ Built-in Alerts:
Gap Up
Gap Down
Gap + Volume Spike
💡 Made by a trader, for traders.
Whether you're a swing trader, gap hunter, or momentum follower—this tool was crafted to give you an edge where it matters most: timing.
Moving Average Convergence Divergence//@version=5
indicator(title="Moving Average Convergence Divergence", shorttitle="MACD", timeframe="", timeframe_gaps=true)
// Getting inputs
fast_length = input(title = "Fast Length", defval = 12)
slow_length = input(title = "Slow Length", defval = 26)
src = input(title = "Source", defval = close)
signal_length = input.int(title = "Signal Smoothing", minval = 1, maxval = 50, defval = 9)
sma_source = input.string(title = "Oscillator MA Type", defval = "EMA", options = )
sma_signal = input.string(title = "Signal Line MA Type", defval = "EMA", options = )
// Calculating
fast_ma = sma_source == "SMA" ? ta.sma(src, fast_length) : ta.ema(src, fast_length)
slow_ma = sma_source == "SMA" ? ta.sma(src, slow_length) : ta.ema(src, slow_length)
macd = fast_ma - slow_ma
signal = sma_signal == "SMA" ? ta.sma(macd, signal_length) : ta.ema(macd, signal_length)
hist = macd - signal
alertcondition(hist >= 0 and hist < 0, title = 'Rising to falling', message = 'The MACD histogram switched from a rising to falling state')
alertcondition(hist <= 0 and hist > 0, title = 'Falling to rising', message = 'The MACD histogram switched from a falling to rising state')
hline(0, "Zero Line", color = color.new(#787B86, 50))
plot(hist, title = "Histogram", style = plot.style_columns, color = (hist >= 0 ? (hist < hist ? #26A69A : #B2DFDB) : (hist < hist ? #FFCDD2 : #FF5252)))
plot(macd, title = "MACD", color = #2962FF)
plot(signal, title = "Signal", color = #FF6D00)

多周期共振策略 PRO · Multi-Timeframe Resonance v1.6🇬🇧 English
🚀 Multi-Timeframe Resonance System – Spot Strong Rallies & Reversal Zones At a Glance!
✨ Licensed & Exclusive · Official Version Only · Long-Term Subscription / Licensed Distribution Supported
📌 Highlights
🔹 Multi-Timeframe Resonance Detection
Analyze multiple timeframes simultaneously. Auto-tag trend phases and consolidation zones—quickly identify entries and exits. Supports M‑Top / W‑Bottom / consolidation breakouts / trend reversals.
🔹 Clarity in Trend vs Ranging
Visually highlight trend expansion (green = bullish) and range zones (red = bearish), no need to switch timeframes manually.
🔹 Perfect for All Asset Classes
Stock / ETF, Futures / Commodities, FX / Gold, Crypto—just tweak parameters to match any market rhythm.
🧠 Ideal For
✅ Traders who need quick structural insights from complex charts
✅ Trend followers, swing traders, range breakout players
✅ Multi-timeframe aficionados and order-flow researchers
✅ Quant teams & strategy developers requiring reliable signals
🔒 How to Use
Licensed version only—contact me for trial or purchase. Once activated, your account is bound, settings are saved forever—no reconfiguring.
🛠️ Exclusive Support For Licensees
• Parameter optimization per asset class
• Strategy updates & alerts
• Access to VIP strategy research group
📩 Contact now to start your quantitative trading journey!
Send a DM or comment on TradingView for license details.
🇨🇳 中文
🚀 多周期共振识别系统 —— 强势震荡与拐点,一目了然!
✨ 授权专用 · 唯一正版 · 支持长期订阅 / 授权分发
📌 核心优势 Highlights
🔹 多周期共振识别
同时分析多个周期,智能标注趋势方向与震荡区间,帮你迅速判断进退时机,支持识别 M 顶 / W 底 / 震荡拐点 / 多空趋势切换。
🔹 震荡 / 趋势 一目了然
自动高亮“趋势推进期”与“震荡盘整区”,绿色代表底部,多头关注;红色代表顶部,空头防守。
🔹 适用于所有金融产品
股票 / ETF、期货 / 商品、外汇 / 黄金、加密货币(Crypto),微调参数即可适配各市场“节奏感”。
🧠 适用人群
✅ 需要速辨图表结构的交易者
✅ 擅长趋势跟随、波段捕捉、震荡套利的投资者
✅ 多周期分析爱好者、主力行为研究者
✅ 需要稳定策略输出的量化团队 / 策略研发者
🔒 使用方式
本指标为受控授权版本,先联系作者获取试用 / 购买权限。绑定账号后,无需重复设置,永久保存参数。
🛠️ 授权用户专享支持
• 参数优化建议(针对不同市场)
• 策略更新同步推送
• VIP 策略研究交流群
📩 立即联系作者,开启量化交易新维度!
在 TradingView 上私信或留言,获取授权与使用说明。
🇯🇵 日本語
🚀 マルチタイムフレーム共振システム ― トレンド&レンジを一目で把握!
✨ ライセンス制・公式正規版・長期購読/ライセンス配布対応
📌 特徴
🔹 マルチタイムフレーム共振検出
複数の時間軸を同時分析し、トレンドとレンジゾーンを自動マーキング。Mトップ/Wボトム/レンジブレイク/トレンド転換を即判断。
🔹 トレンドとレンジの視認性向上
トレンド加速期は緑、レンジは赤で強調表示。タイムフレームの切り替え不要。
🔹 すべての金融商品に対応
株/ETF、先物/商品、FX/ゴールド、暗号資産(Crypto)に対応し、市場ごとの「リズム」に合わせた微調整のみで利用可能。
🧠 こんな方におすすめ
✅ 複雑なチャートから構造を素早く把握したいトレーダー
✅ トレンドフォロー、スイング、レンジブレイク手法採用者
✅ マルチタイムフレーム分析やオーダーフローに関心のある方
✅ 安定信号を求めるクオンツチーム/戦略開発者
🔒 利用方法
ライセンス制のみ:試用/購入は作者に直接お問い合わせください。認証アカウントには永続的にパラメータが保存されます。
🛠️ ライセンス者限定サポート
• 資産別パラメーター最適化アドバイス
• 継続的な戦略アップデート配信
• VIP研究グループ参加権
📩 今すぐ連絡して、量的トレードの新次元へ!
TradingViewでDMまたはコメントを送信して下さい。
🇫🇷 Français

[sunkasco] 뚬치딱치In true TradingView spirit, the author has published this Pine code as an open-source library so that other Pine programmers from our community can reuse it. Cheers to the author! You may use this library privately or in other open-source publications, but reuse of this code in publications is governed by House Rules.

SignalScope PROOverview: (Nothing mentioned here is financial advice)
What is the difference between the free Signal Scope and the Pro Version? Answer- Signal Scope Pro includes live divergences that have been rigorously backtested with exceptional results.
Signal Scope Pro includes Divergences based off a proprietary oscillator. They are not based upon SMT or any other existing oscillator.
The Algorithm features candles we refer to as "Bullish" & "Bearish" imbalance candles.
Bullish Imbalance candle= Fully colored Blue and Green Candles
Bearish Imbalance candle= Fully colored Red and Purple Candles
Stats On Bullish Imbalance candles:
Daily Chart- Since 2021 there have been 9 bullish imbalance candles. 8/9 on the daily time frame for continued upside after a Bullish Imbalance Candle populates. This gives us a 88.8% chance of near term upside in the following days after these candles show on the chart.
Since January 1st 2025, there have been 27, 30 minute bullish imbalance candles. 21 have resulted in Short Term Upside, 6 failed and went to the downside. This gives us a 77.78% odds that a bullish imbalance candle will result in short term upside with a look-back period over the last 5 months.
Since January 1st 2025, there have been 95, 15 minute bullish imbalance candles. 69 have resulted in Short Term Upside, 26 failed and went to the downside. This gives us a 72.63% odds that a bullish imbalance candle will result in short term upside with a look-back period over the last 5 months.
Since January 1st 2025, there have been 193 5 minute bullish imbalance candles. 135 have resulted in Short Term Upside, 58 failed and went to the downside. This gives us a 69.95% odds that a bullish imbalance candle will result in short term upside with a look-back period over the last 5 months.
What can we take from the data above? The higher the time frame, the more favorable the results become.
BUY/ SELL SIGNALS (green triangles=buy, red triangles=sell)
The highlight of the algo is the bull/ bear imbalance candles along with the live divergences.

DIP BUYING by HAZEREAL BUY THE DIP - Educational Price Movement Indicator
This technical indicator is designed for educational purposes to help traders identify potential price reversal opportunities in equity markets, particularly focusing on NASDAQ-100 index tracking instruments and technology sector ETFs.
Key Features:
Monitors price movements relative to recent highs over customizable lookback periods
Identifies two distinct price decline thresholds: standard (5%+) and extreme (12.3%+)
Visual signals with triangular markers and background color zones
Real-time data table showing current metrics and status
Customizable alert system with webhook-ready JSON formatting
Clean overlay design that doesn't obstruct price action
How It Works:
The indicator tracks the highest price within a specified lookback period and calculates the percentage decline from that high. When price drops below the minimum threshold, it generates visual buy signals. The extreme threshold triggers enhanced alerts for more significant market movements.
Best Use Cases:
Educational analysis of market volatility patterns
Identifying potential support levels during market corrections
Studying historical price behavior around significant declines
Risk management and position sizing education
Important Note: This is a technical analysis tool for educational purposes only. All trading decisions should be based on comprehensive analysis and appropriate risk management. Past performance does not guarantee future results.

Micro Trend Start Signal (Up & Down)To compliment fast trends in the market, this strategy should be tried and tested on the 1 minute strategy. The 2nd alerts work also very well.

Candlesticks MTF + Prev Daily RangeCandlesticks MTF + Previous Daily Range
This TradingView script displays higher timeframe candlesticks on a lower timeframe chart and optionally projects the previous day's high, low, and close levels. The user can define the timeframe from which the candles are taken, typically a higher timeframe like daily. A specified number of historical candles are drawn on the chart using boxes for candle bodies and lines for wicks. The color of each candle indicates its direction: bullish candles use a "long" color (default teal), and bearish candles use a "short" color (default red).
An optional feature allows the projection of the previous daily range. When enabled, the script draws horizontal lines extending across the chart to mark the high, low, and close of the second most recent higher timeframe candle. These lines are color-coded for easy visual identification and can help identify potential support and resistance zones.
All visual elements, including the number of candles, their width, and the colors of candles and projection lines, can be customized through the settings. The script dynamically updates in real time, clearing outdated boxes and lines to avoid visual clutter. This makes it a useful tool for traders who want to incorporate multi-timeframe analysis and key price levels directly into their intraday charting.

