LEGIntroduction
The LEG indicator is an advanced technical analysis tool designed for traders to identify key levels and trading opportunities in the market. By combining Fair Value Gap (FVG) and Swing Point (SP) analysis, the indicator draws important "leg" lines that represent critical areas of market structure change. The LEG indicator helps traders identify potential support and resistance levels, enabling them to make more informed entry and exit decisions.
Use Cases
Trend Identification: Determine market trend direction through multiple unmitigated LEG lines in the same direction
Support/Resistance Areas: LEG lines often become temporary support or resistance levels
Pullback Trading: Look for entry opportunities when price pulls back to unmitigated LEG lines
Stop Loss Placement: Use LEG lines as reference points for stop loss placement
Market Structure Analysis: Understand market structure changes through the creation and mitigation of LEG lines
Configuration Options
Enable LEG Drawing: Turn the LEG indicator on or off
Bullish/Bearish LEG Color: Customize colors for different direction LEG lines
LEG Line Width: Adjust the width of LEG lines (1-5)
LEG Line Style: Choose between solid, dashed, or dotted lines
LEG Line Length: Adjust the horizontal extension length of LEG lines (10-500)
Maximum LEG Display Count: Control the maximum number of LEG lines shown on the chart (1-100)
LEG Offset: Horizontally adjust the position of LEG lines, can offset left or right
Hide Mitigated LEGs: Choose whether to hide LEG lines after price crosses them
使用场景
趋势识别: 通过多个未缓解的同向LEG线判断市场趋势方向
支撑/阻力区域: LEG线通常成为市场的临时支撑或阻力位
回撤交易: 当价格回撤到未缓解的LEG线附近时寻找入场机会
止损设置: 使用LEG线作为止损位的参考点
市场结构分析: 通过LEG线的生成和缓解理解市场结构变化
Chart patterns
US Market ORB with Volume SpikeHow to Use:
Apply to US stocks/ETFs (works best on 1-5 minute charts)
Default settings work for NYSE/NASDAQ market hours
Blue background shows ORB formation period
Orange highlights indicate volume spikes
Buy/Sell signals appear at breakouts with volume confirmation

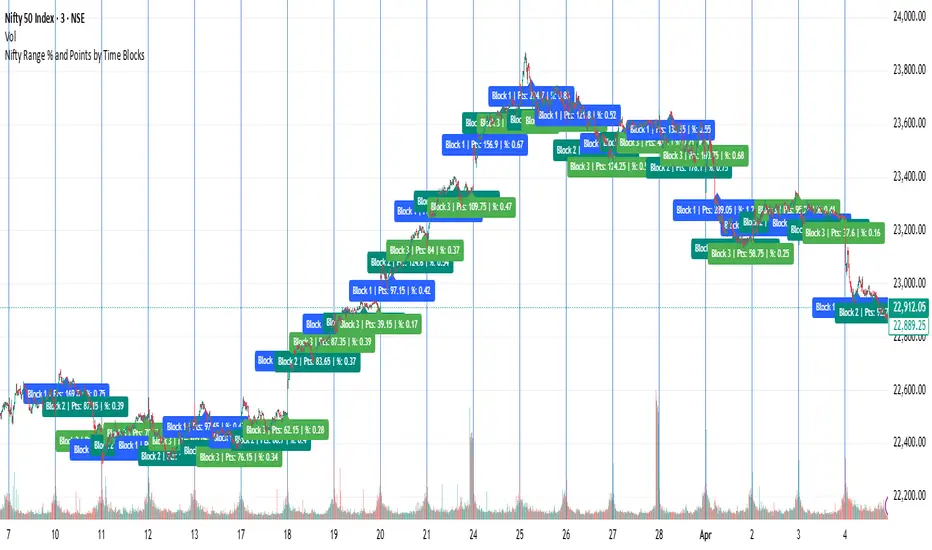
Nifty Range % and Points by Time BlocksPine Script that gives you day-wise intraday range percentage for these 3 time blocks (9:16–10:45, 10:45–1:15, 1:15–3:15), we can:
Detect time blocks during the day
Track High/Low for each block
Calculate range % for each block:
\text{Range %} = \frac{(High - Low)}{\text{Previous Day Close}} \times 100
Plot / Label it on the chart at the end of each block
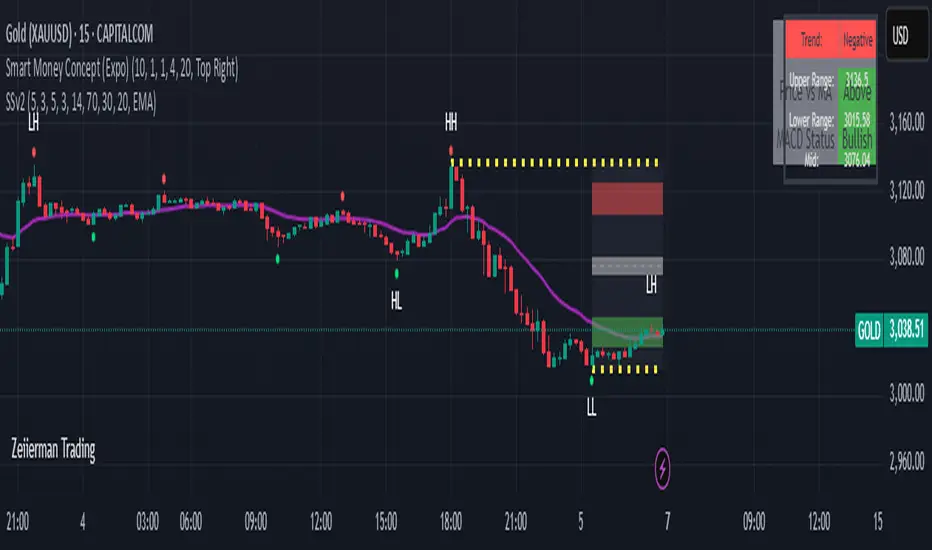
Sahid Strategy v2This script identifies potential buy/sell signals using:
Pivot Points - Detects swing highs/lows (price reversals)
Confirmation Filters - Reduces false signals using:
RSI (momentum)
Moving Average (trend direction)
Optional MACD (trend confirmation)
Key Features
Signal Type Trigger Conditions
BUY - Price makes a swing low (pivot)
Copy
- RSI ≤ 30 (oversold)
- Price above trend MA
- MACD bullish (optional) |
| SELL | - Price makes a swing high (pivot)
- RSI ≥ 70 (overbought)
- Price below trend MA
- MACD bearish (optional) |
Visual Signals
Green "BUY" labels below price bars
Red "SELL" labels above price bars
Purple trend line (20-period EMA/SMA)
Orange/blue circles showing raw pivot points
Optional Tools
Debug Table (top-right): Shows real-time:
RSI value
Price vs MA position
MACD status
Alerts - Triggers audible/visual notifications
Customization
Adjust in settings:
Pivot sensitivity (left/right bars)
RSI levels (30/70 by default)
MA type/length (20-period EMA/SMA)
Toggle MACD filter on/off
Best For: Swing trading in trending markets (1H-4H timeframes). Signals appear faster than classic pivot strategies but still require confirmation from other analysis tools.
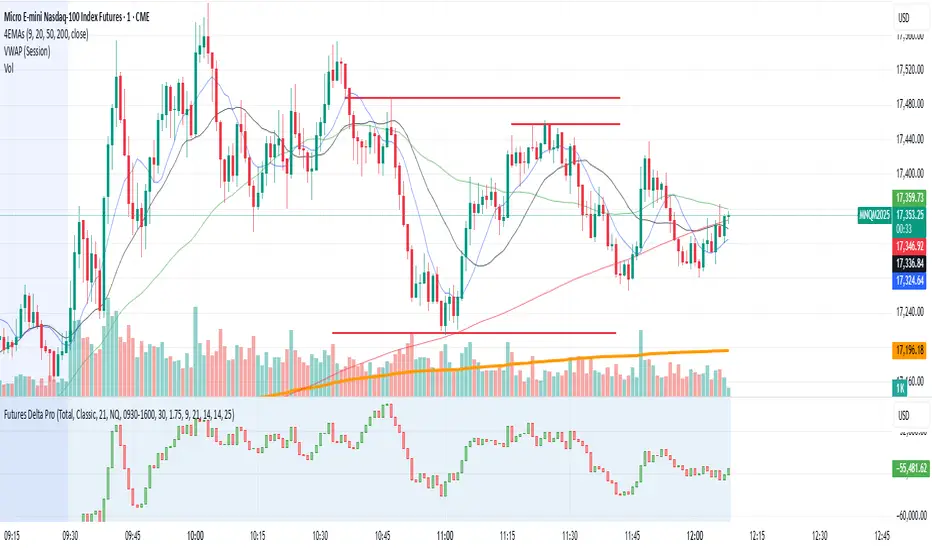
NQ/MNQ Futures Delta+ with Price Action EntriesNQ/MNQ Futures Delta+ with Price Action Entries
Description: This TradingView indicator combines Futures Delta analysis with advanced price action techniques to provide an enhanced trading strategy for the NQ/MNQ futures market. The script analyzes the market using a variety of methods including Delta, volume analysis, and candlestick patterns, while also incorporating price action factors like support/resistance levels and breakouts to offer more refined buy and sell signals.
Key Features:
Delta Analysis:
The Delta calculation tracks the difference between buying and selling pressure within each market bar. The indicator calculates delta based on different modes (Classic, Volume Based, Tick Based), and then applies cumulative delta for trend analysis.
The Cumulative Delta is calculated using one of the three available modes:
Total: Tracks the cumulative delta over time.
Periodic: Measures delta over a defined period (user-configurable).
EMA: Applies an Exponential Moving Average to smooth the delta values.
Volume Confirmation:
The script includes volume analysis to confirm price movements. A volume spike is used to validate buy/sell signals, ensuring that price movements are supported by significant trading volume.
Price Action-Based Entries:
Support and Resistance: Dynamic support and resistance levels are calculated based on the lowest low and highest high of the last 20 bars. These levels are used to identify breakout points, providing context for potential buy/sell entries.
Candlestick Patterns: The script recognizes Bullish Engulfing and Bearish Engulfing candlestick patterns. These patterns signal potential reversals in price direction and are used to confirm trade entries.
Breakout Logic: Buy signals are triggered when the price breaks above resistance, and sell signals are triggered when the price breaks below support, providing high-probability entry points during trend reversals or continuations.
Moving Average Trend Confirmation:
The script uses two moving averages:
9-period Exponential Moving Average (EMA): Short-term trend indicator.
21-period Exponential Moving Average (EMA): Longer-term trend indicator.
Trades are only considered in the direction of the prevailing trend:
A bullish signal is confirmed if the price is above both EMAs.
A bearish signal is confirmed if the price is below both EMAs.
Buy/Sell Signal Triggers:
Buy Signal: A buy signal is triggered when:
A bullish divergence is confirmed with volume support.
A bullish engulfing candlestick pattern forms.
The price breaks above resistance.
The price is above both the 9 EMA and 21 EMA, indicating an uptrend.
Sell Signal: A sell signal is triggered when:
A bearish divergence is confirmed with volume support.
A bearish engulfing candlestick pattern forms.
The price breaks below support.
The price is below both the 9 EMA and 21 EMA, indicating a downtrend.
Visualization:
Delta Candles: The cumulative delta is plotted as a candlestick on the chart, with green and red coloring to show buying or selling dominance.
Support and Resistance Levels: Support and resistance zones are plotted to show key levels where price action may react.
Moving Averages: The 9 EMA and 21 EMA are plotted to show short-term and long-term trend direction.
Signal Markers: Buy and sell signals are marked on the chart with green triangles (buy) and red triangles (sell) for easy visualization of trade opportunities.
Alerts:
Alerts can be set up for buy and sell signals, enabling you to be notified when the script identifies potential trade opportunities based on Delta analysis, volume confirmation, and price action.
How to Use This Script:
Market: This script is optimized for NQ and MNQ futures contracts but can be adapted for other markets as well.
Signal Interpretation: Use the buy and sell signals for trend-following or counter-trend trades. These signals are particularly useful for 1-minute or 5-minute charts but can be adjusted to fit other timeframes.
Support/Resistance: Pay close attention to the dynamic support and resistance levels, as these are key price action points where significant price movements can occur.
Trend Confirmation: Ensure that trades are aligned with the overall trend confirmed by the 9 EMA and 21 EMA. The script prioritizes signals that align with the broader market trend.
Breakouts: Use the breakout logic to catch price moves when the market breaks key support or resistance levels. These can often lead to strong moves in the direction of the breakout.
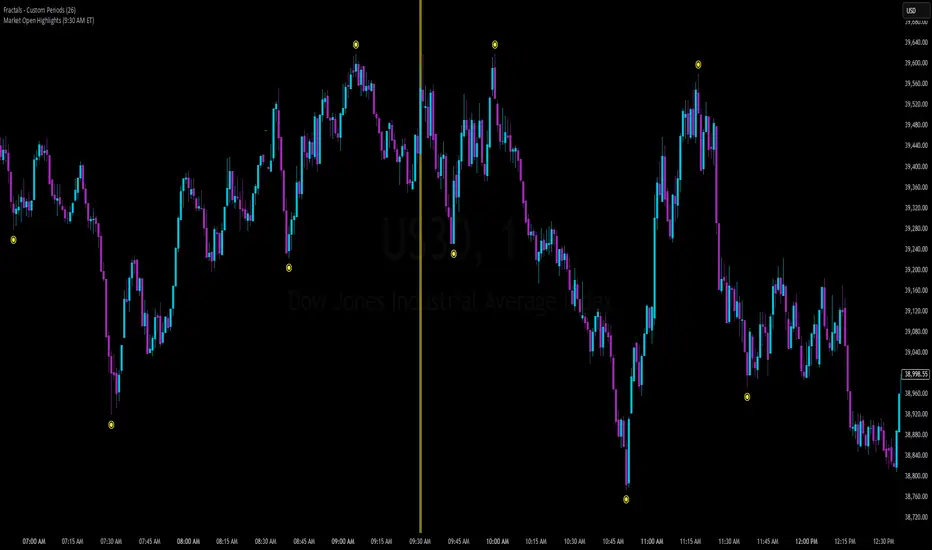
Market Open Highlights (9:30 AM ET)This indicator zeroes in on the 9:30 AM Eastern Time market opens for NAS100 and US30, highlighting all market opens with a bold yet subtle yellow background. Tailored for precision backtesting, it uses TradingView’s timezone capabilities to pinpoint the exact 9:30 AM candle, skipping weekends to focus solely on U.S. equity market opens.
What It Does:
The script tracks the bar indices of all market opens at 9:30 AM ET, applying a semi-transparent yellow highlight to those candles. It’s a clean, efficient way to mark key session starts for analyzing price action or testing strategies.
How to Use It:
1. Apply the script to a chart of NAS100 (e.g., FX:NAS100) or US30 (e.g., FX:US30) in TradingView on any timeframe.
2. Set your chart timezone to "America/New_York" (Settings > Timezone/Sessions).
3. Scroll back through trading days to see the yellow highlights on the 9:30 AM candles.
4. While it functions across all timeframes, it’s optimized for 5-minute and 1-minute charts, where the 9:30 AM candle aligns precisely with the U.S. market open for detailed analysis.
5. Use it to study price behavior or refine strategies around this critical daily event.
Open Range Candle [TradeWithRon]This Open Range Break indicator is a tool designed to help traders identify and visualize key price levels using the Opening Range Breakout (ORB) strategy. This indicator dynamically plots critical levels such as the high, low, and middle of a predefined range, along with Fibonacci retracement levels for further analysis. It also features several customization options to fit various trading styles.
Key Features:
Session Setup: Allows the user to set the time offset in GMT - or + to adjust the ORB session to their local time zone.
The default ORB session is set at 9:45 AM but can be adjusted based on user preferences.
Warning: Only supports 5-minute and 15-minute timeframes.
Visual Customization:
Line Styles: Users can choose from Solid, Dotted, or Dashed lines to represent key price levels.
Color Adjustments: Customizable colors for the high, middle, and low levels of the range, as well as Fibonacci levels and vertical lines.
Labeling Options: The labels can be customized in terms of size and color, helping to keep the chart clean and clear.
Fibonacci Retracement Levels: Fibonacci retracement levels are automatically drawn between the high and low of the range. Users can toggle these on or off and customize the offset to suit different trading instruments.
Time-Based Visuals: A vertical line is drawn at the start of the ORB session, providing a clear visual marker of where the breakout starts. This is useful for pinpointing key trade setups.
The indicator supports both 5-minute and 15-minute timeframes.
EMA Integration: The user can enable an Exponential Moving Average (EMA) on any chosen timeframe with adjustable parameters such as the length and color, providing additional trend context.
Dynamic Labeling: The indicator labels the high, middle, and low points of the ORB with custom text. These labels are updated in real-time as new data becomes available.
Limit on Lines and Labels: The indicator allows for a limit on the number of lines and labels drawn to maintain a clean chart, preventing unnecessary clutter as more ORB levels are plotted.
Daily Bias Information: The indicator assesses the daily trend bias (bullish or bearish) based on the relationship between the open and close prices for the last three daily candles, providing context for the current trading session.
Countdown Timer: The remaining time until the end of the current session is displayed in a countdown format, which helps traders to time their entries and exits more precisely.
How To Use:,
- Set the Timeframe to 15 minutes.
- Adjust the Time Zone Offset if needed, based on your local time zone.
- Enable the Show ORB feature for the first 15-minute candle to be drawn as the opening range. - The indicator will automatically mark the high, middle, and low points of the range.
Identify Breakout Points:
Bullish Breakout: If the price breaks above the high of the 15-minute opening range, this indicates a potential bullish breakout. The indicator will plot a vertical line marking the breakout point for further confirmation.
Bearish Breakout: If the price breaks below the low of the 15-minute opening range, this signals a potential bearish breakout. Again, the indicator will plot the breakout point with a vertical line for easy identification.
🔶 Disclaimer
Use with Caution: This indicator is provided for educational and informational purposes only and should not be considered as financial advice. Users should exercise caution and perform their own analysis before making trading decisions based on the indicator's signals.
Not Financial Advice: The information provided by this indicator does not constitute financial advice, and the creator (Tradewithron) shall not be held responsible for any trading losses incurred as a result of using this indicator.
Backtesting Recommended: Traders are encouraged to backtest the indicator thoroughly on historical data before using it in live trading to assess its performance and suitability for their trading strategies.
Risk Management: Trading involves inherent risks, and users should implement proper risk management strategies, including but not limited to stop-loss orders and position sizing, to mitigate potential losses.
No Guarantees: The accuracy and reliability of the indicator's signals cannot be guaranteed, as they are based on historical price data and past performance may not be indicative of future

Closing Range BreakoutIndicator Description:
This tool tracks the closing price range of a trading session (like New York or London market hours) and highlights potential breakout opportunities. It shows:
Extended Range Lines: Drawn after the session closes, marking the high/low of the session's final hour.
Breakout Arrows: Appear when prices close above/below the range for a user-defined number of consecutive bars.
Session Background: Gray highlight during the selected market's closing hour.
It helps traders spot momentum shifts by focusing on price behavior relative to the closing range, with customizable alerts for confirmed breakouts.
How to Use:
Select Session: Choose your market's closing hour (e.g., New York/London).
Set Confirmation: Adjust how many closes are needed to confirm a breakout.
Watch Visuals:
Gray background = Active closing session
Blue range = Extended high/low from last session
Arrows = First breakout signal
Trade Signals: Price closing outside the range triggers alerts (labels update automatically).
Focus on breakouts with momentum, using the range as support/resistance.

London Breakout Tracker - Box Style📊 London Breakout Tracker (Pine Script v6)
This script is designed to track the Asian session range and identify breakout opportunities when the London session begins. It highlights high-probability trade setups and helps avoid fakeouts or overly wide ranges.
🧱 1. Session Time Definitions (Adjusted for Kenyan Time)
The Asian session is defined as:
3:00 AM to 11:00 AM (Kenyan Time)
🔐 2. Asian Session High & Low
During the Asian session:
The script tracks the highest high and lowest low to define the range.
These are stored in variables: asianHigh and asianLow.
🧊 3. Box Drawing for the Asian Range
Once the Asian session ends:
A visual box is drawn around the session using box.new().
This box spans from the session start to end bars and from the high to low.
It helps visually see the range price must break out from.
🚨 4. Breakout Signals
After the Asian session:
A Long Breakout signal is generated if:
The candle closes above the Asian High.
A Short Breakout signal is generated if:
The candle closes below the Asian Low.
This corresponds to 00:00 to 08:00 UTC
These are shown with:
✅ Green up label for long breakouts
❌ Red down label for short breakouts
🧯 5. Fakeout Detection
If price breaks out but closes back inside the Asian range, it’s marked as a Fakeout:
Long Fakeout: Price breaks above high, then closes back below.
Short Fakeout: Price breaks below low, then closes back above.
These are marked with orange X-crosses above or below candles.
⚠️ 6. Wide Range Filter
If the Asian session range is too wide (e.g. > 40 pips), a gray background is drawn.
This warns you not to trade that day since breakouts from wide ranges are unreliable.
📣 7. Alert Conditions
The script can trigger alerts in TradingView when:
🔔 A Long or Short Breakout occurs
⚠️ A Fakeout is detected
You can set these up via the TradingView alert system.
🎯 Overall Purpose:
The script helps you:
Clearly see the Asian session range
Identify breakout opportunities at the London open
Avoid trading during fakeouts or wide-range sessions
Get alerted when breakout/fakeout conditions occur

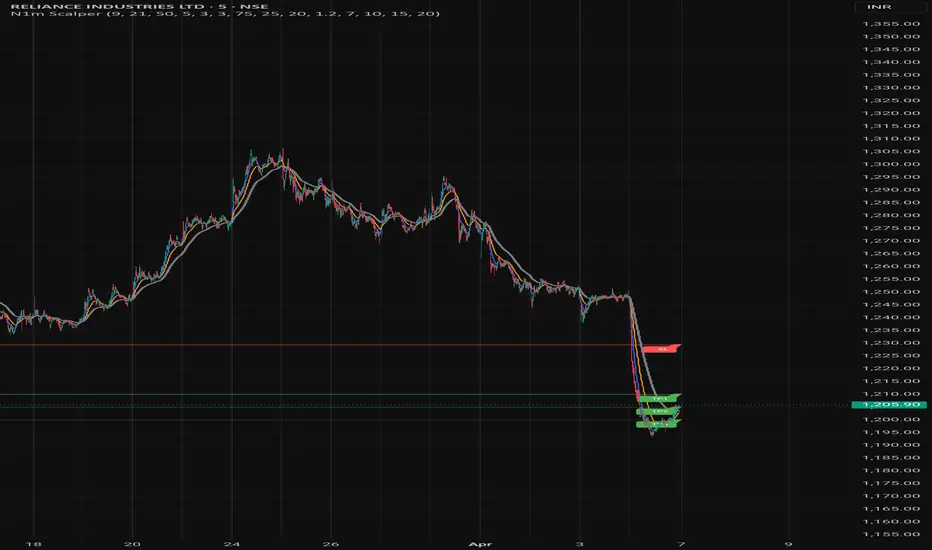
Nifty 1m EMA Pullback Scalper Signals
### **Master the Market with the Sniper Scalping Strategy for Nifty (1-Minute Timeframe)**
Unlock the power of precision trading with this expertly crafted **Sniper Scalping Strategy**, designed specifically for the Nifty index on a lightning-fast 1-minute timeframe. Perfect for traders who thrive on quick decisions and small, consistent profits, this strategy combines multiple indicators to deliver razor-sharp entries and exits—ideal for India’s dynamic market.
#### **Why This Strategy Stands Out**
- **Pinpoint Accuracy**: Harness the synergy of the **5 EMA and 10 EMA crossover** to lock onto the short-term trend, while the **Stochastic Oscillator (14,3,3)** times your entries and exits with surgical precision.
- **Fast and Effective**: Tailored for the 1-minute chart, this strategy capitalizes on Nifty’s volatility, targeting **10-point profits** with a tight **5-point stop-loss**—keeping your risk low and rewards high.
- **Trend + Momentum**: Blend trend-following (EMAs) with momentum signals (Stochastic) for a robust, multi-dimensional approach that cuts through market noise.
#### **How It Works**
- **Buy Signal**: Enter long when the 5 EMA crosses above the 10 EMA and the Stochastic rises above 20—catching the uptrend at its sweet spot.
- **Sell Signal**: Go short when the 5 EMA dips below the 10 EMA and the Stochastic falls below 80—riding the downtrend with confidence.
- **Exit Like a Pro**: Take profits at 10 points or when the Stochastic hits overbought/oversold extremes, ensuring you’re in and out before the market shifts.
#### **Perfect for Nifty Scalpers**
Built for the fast-paced world of Nifty trading, this strategy shines during high-volatility sessions like the market open or global overlaps. Whether you’re a beginner honing your skills or a seasoned trader seeking consistency, the Sniper Scalping Strategy offers a clear, actionable framework to scalp profits with discipline and precision.
#### **Get Started**
Test it in a demo account, refine it to your style, and watch your scalping game soar. Trade smart, stay focused, and let the Sniper Scalping Strategy turn Nifty’s 1-minute moves into your edge!
Normalized MACD with RSI & Stoch RSI + SignalsNormalized MACD with RSI & Stoch RSI Indicator
Overview:
This indicator combines three popular momentum indicators (MACD, RSI, and Stochastic RSI) into a single cohesive, normalized view, making it easier for traders to interpret market momentum and potential buy/sell signals. It specifically addresses an important issue—the different scale ranges of indicators—by normalizing MACD values to match the 0–100 scale of RSI and Stochastic RSI.
Here’s a clear and concise description of your updated Pine Script indicator:
⸻
Normalized MACD with RSI & Stoch RSI Indicator
Overview:
This indicator combines three popular momentum indicators (MACD, RSI, and Stochastic RSI) into a single cohesive, normalized view, making it easier for traders to interpret market momentum and potential buy/sell signals. It specifically addresses an important issue—the different scale ranges of indicators—by normalizing MACD values to match the 0–100 scale of RSI and Stochastic RSI.
⸻
Key Components:
① MACD (Normalized):
• The Moving Average Convergence Divergence (MACD) originally has an unlimited numerical range.
• Normalization Method:
• Uses a custom tanh(x) function implemented directly in Pine Script:
\tanh(x) = \frac{e^{x}-e^{-x}}{e^{x}+e^{-x}}
• MACD values are scaled using this method to a range of 0–100, with the neutral line at exactly 50.
• Interpretation:
• Values above 50 indicate bullish momentum.
• Values below 50 indicate bearish momentum.
② RSI (Relative Strength Index):
• Measures market momentum on a 0–100 scale.
• Traditional RSI interpretation:
• Overbought conditions: RSI > 70–80.
• Oversold conditions: RSI < 30–20.
③ Stochastic RSI:
• Combines RSI and Stochastic Oscillator to give short-term, highly sensitive signals.
• Helps identify immediate market extremes:
• Above 80 → Short-term overbought.
• Below 20 → Short-term oversold.
⸻
How the Indicator Works:
• Visualization:
• All three indicators (Normalized MACD, RSI, Stochastic RSI) share the same 0–100 scale.
• Clear visual lines and reference levels:
• Midline at 50 indicates neutral momentum.
• Dashed lines at 20 and 80 clearly mark oversold/overbought zones.
• Trading Signals (Recommended approach):
• Bullish Signal (Potential Buy):
• Normalized MACD crosses above 50.
• RSI below or approaching oversold zone (below 30–20).
• Stochastic RSI below 20, indicating short-term oversold conditions.
• Bearish Signal (Potential Sell):
• Normalized MACD crosses below 50.
• RSI above or approaching overbought zone (above 70–80).
• Stochastic RSI above 80, indicating short-term overbought conditions.
⸻
Why Use This Indicator?
• Harmonized Signals:
Normalization of MACD significantly improves clarity and comparability with RSI and Stochastic RSI, providing a unified momentum picture.
• Intuitive Analysis:
Traders can rapidly and intuitively identify momentum shifts without needing multiple indicator windows.
• Improved Decision-Making:
Clear visual references and signals help reduce subjective interpretation, potentially improving trading outcomes.
⸻
Suggested Usage:
• Combine with traditional support

BTC Trading RobotOverview
This Pine Script strategy is designed for trading Bitcoin (BTC) by placing pending orders (BuyStop and SellStop) based on local price extremes. The script also implements a trailing stop mechanism to protect profits once a position becomes sufficiently profitable.
________________________________________
Inputs and Parameter Setup
1. Trading Profile:
o The strategy is set up specifically for BTC trading.
o The systemType input is set to 1, which means the strategy will calculate trade parameters using the BTC-specific inputs.
2. Common Trading Inputs:
o Risk Parameters: Although RiskPercent is defined, its actual use (e.g., for position sizing) isn’t implemented in this version.
o Trading Hours Filter:
SHInput and EHInput let you restrict trading to a specific hour range. If these are set (non-zero), orders will only be placed during the allowed hours.
3. BTC-Specific Inputs:
o Take Profit (TP) and Stop Loss (SL) Percentages:
TPasPctBTC and SLasPctBTC are used to determine the TP and SL levels as a percentage of the current price.
o Trailing Stop Parameters:
TSLasPctofTPBTC and TSLTgrasPctofTPBTC determine when and by how much a trailing stop is applied, again as percentages of the TP.
4. Other Parameters:
o BarsN is used to define the window (number of bars) over which the local high and low are calculated.
o OrderDistPoints acts as a buffer to prevent the entry orders from being triggered too early.
________________________________________
Trade Parameter Calculation
• Price Reference:
o The strategy uses the current closing price as the reference for calculations.
• Calculation of TP and SL Levels:
o If the systemType is set to BTC (value 1), then:
Take Profit Points (Tppoints) are calculated by multiplying the current price by TPasPctBTC.
Stop Loss Points (Slpoints) are calculated similarly using SLasPctBTC.
A buffer (OrderDistPoints) is set to half of the take profit points.
Trailing Stop Levels:
TslPoints is calculated as a fraction of the TP (using TSLTgrasPctofTPBTC).
TslTriggerPoints is similarly determined, which sets the profit level at which the trailing stop will start to activate.
________________________________________
Time Filtering
• Session Control:
o The current hour is compared against SHInput (start hour) and EHInput (end hour).
o If the current time falls outside the allowed window, the script will not place any new orders.
________________________________________
Entry Orders
• Local Price Extremes:
o The strategy calculates a local high and local low using a window of BarsN * 2 + 1 bars.
• Placing Stop Orders:
o BuyStop Order:
A long entry is triggered if the current price is less than the local high minus the order distance buffer.
The BuyStop order is set to trigger at the level of the local high.
o SellStop Order:
A short entry is triggered if the current price is greater than the local low plus the order distance buffer.
The SellStop order is set to trigger at the level of the local low.
Note: Orders are only placed if there is no current open position and if the session conditions are met.
________________________________________
Trailing Stop Logic
Once a position is open, the strategy monitors profit levels to protect gains:
• For Long Positions:
o The script calculates the profit as the difference between the current price and the average entry price.
o If this profit exceeds the TslTriggerPoints threshold, a trailing stop is applied by placing an exit order.
o The stop price is set at a distance below the current price, while a limit (profit target) is also defined.
• For Short Positions:
o The profit is calculated as the difference between the average entry price and the current price.
o A similar trailing stop exit is applied if the profit exceeds the trigger threshold.
________________________________________
Summary
In essence, this strategy works by:
• Defining entry levels based on recent local highs and lows.
• Placing pending stop orders to enter the market when those levels are breached.
• Filtering orders by time, ensuring trades are only taken during specified hours.
• Implementing a trailing stop mechanism to secure profits once the trade moves favorably.
This approach is designed to automate BTC trading based on price action and dynamic risk management, although further enhancements (like dynamic position sizing based on RiskPercent) could be added for a more complete risk management system.

Adaptive Fibonacci Pullback System -FibonacciFluxAdaptive Fibonacci Pullback System (AFPS) - FibonacciFlux
This work is licensed under a Attribution-NonCommercial-ShareAlike 4.0 International (CC BY-NC-SA 4.0). Original concepts by FibonacciFlux.
Abstract
The Adaptive Fibonacci Pullback System (AFPS) presents a sophisticated, institutional-grade algorithmic strategy engineered for high-probability trend pullback entries. Developed by FibonacciFlux, AFPS uniquely integrates a proprietary Multi-Fibonacci Supertrend engine (0.618, 1.618, 2.618 ratios) for harmonic volatility assessment, an Adaptive Moving Average (AMA) Channel providing dynamic market context, and a synergistic Multi-Timeframe (MTF) filter suite (RSI, MACD, Volume). This strategy transcends simple indicator combinations through its strict, multi-stage confluence validation logic. Historical simulations suggest that specific MTF filter configurations can yield exceptional performance metrics, potentially achieving Profit Factors exceeding 2.6 , indicative of institutional-level potential, while maintaining controlled risk under realistic trading parameters (managed equity risk, commission, slippage).
4 hourly MTF filtering
1. Introduction: Elevating Pullback Trading with Adaptive Confluence
Traditional pullback strategies often struggle with noise, false signals, and adapting to changing market dynamics. AFPS addresses these challenges by introducing a novel framework grounded in Fibonacci principles and adaptive logic. Instead of relying on static levels or single confirmations, AFPS seeks high-probability pullback entries within established trends by validating signals through a rigorous confluence of:
Harmonic Volatility Context: Understanding the trend's stability and potential turning points using the unique Multi-Fibonacci Supertrend.
Adaptive Market Structure: Assessing the prevailing trend regime via the AMA Channel.
Multi-Dimensional Confirmation: Filtering signals with lower-timeframe Momentum (RSI), Trend Alignment (MACD), and Market Conviction (Volume) using the MTF suite.
The objective is to achieve superior signal quality and adaptability, moving beyond conventional pullback methodologies.
2. Core Methodology: Synergistic Integration
AFPS's effectiveness stems from the engineered synergy between its core components:
2.1. Multi-Fibonacci Supertrend Engine: Utilizes specific Fibonacci ratios (0.618, 1.618, 2.618) applied to ATR, creating a multi-layered volatility envelope potentially resonant with market harmonics. The averaged and EMA-smoothed result (`smoothed_supertrend`) provides a robust, dynamic trend baseline and context filter.
// Key Components: Multi-Fibonacci Supertrend & Smoothing
average_supertrend = (supertrend1 + supertrend2 + supertrend3) / 3
smoothed_supertrend = ta.ema(average_supertrend, st_smooth_length)
2.2. Adaptive Moving Average (AMA) Channel: Provides dynamic market context. The `ama_midline` serves as a key filter in the entry logic, confirming the broader trend bias relative to adaptive price action. Extended Fibonacci levels derived from the channel width offer potential dynamic S/R zones.
// Key Component: AMA Midline
ama_midline = (ama_high_band + ama_low_band) / 2
2.3. Multi-Timeframe (MTF) Filter Suite: An optional but powerful validation layer (RSI, MACD, Volume) assessed on a lower timeframe. Acts as a **validation cascade** – signals must pass all enabled filters simultaneously.
2.4. High-Confluence Entry Logic: The core innovation. A pullback entry requires a specific sequence and validation:
Price interaction with `average_supertrend` and recovery above/below `smoothed_supertrend`.
Price confirmation relative to the `ama_midline`.
Simultaneous validation by all enabled MTF filters.
// Simplified Long Entry Logic Example (incorporates key elements)
long_entry_condition = enable_long_positions and
(low < average_supertrend and close > smoothed_supertrend) and // Pullback & Recovery
(close > ama_midline and close > ama_midline) and // AMA Confirmation
(rsi_filter_long_ok and macd_filter_long_ok and volume_filter_ok) // MTF Validation
This strict, multi-stage confluence significantly elevates signal quality compared to simpler pullback approaches.
1hourly filtering
3. Realistic Implementation and Performance Potential
AFPS is designed for practical application, incorporating realistic defaults and highlighting performance potential with crucial context:
3.1. Realistic Default Strategy Settings:
The script includes responsible default parameters:
strategy('Adaptive Fibonacci Pullback System - FibonacciFlux', shorttitle = "AFPS", ...,
initial_capital = 10000, // Accessible capital
default_qty_type = strategy.percent_of_equity, // Equity-based risk
default_qty_value = 4, // Default 4% equity risk per initial trade
commission_type = strategy.commission.percent,
commission_value = 0.03, // Realistic commission
slippage = 2, // Realistic slippage
pyramiding = 2 // Limited pyramiding allowed
)
Note: The default 4% risk (`default_qty_value = 4`) requires careful user assessment and adjustment based on individual risk tolerance.
3.2. Historical Performance Insights & Institutional Potential:
Backtesting provides insights into historical behavior under specific conditions (always specify Asset/Timeframe/Dates when sharing results):
Default Performance Example: With defaults, historical tests might show characteristics like Overall PF ~1.38, Max DD ~1.16%, with potential Long/Short performance variance (e.g., Long PF 1.6+, Short PF < 1).
Optimized MTF Filter Performance: Crucially, historical simulations demonstrate that meticulous configuration of the MTF filters (particularly RSI and potentially others depending on market) can significantly enhance performance. Under specific, optimized MTF filter settings combined with appropriate risk management (e.g., 7.5% risk), historical tests have indicated the potential to achieve **Profit Factors exceeding 2.6**, alongside controlled drawdowns (e.g., ~1.32%). This level of performance, if consistently achievable (which requires ongoing adaptation), aligns with metrics often sought in institutional trading environments.
Disclaimer Reminder: These results are strictly historical simulations. Past performance does not guarantee future results. Achieving high performance requires careful parameter tuning, adaptation to changing markets, and robust risk management.
3.3. Emphasizing Risk Management:
Effective use of AFPS mandates active risk management. Utilize the built-in Stop Loss, Take Profit, and Trailing Stop features. The `pyramiding = 2` setting requires particularly diligent oversight. Do not rely solely on default settings.
4. Conclusion: Advancing Trend Pullback Strategies
The Adaptive Fibonacci Pullback System (AFPS) offers a sophisticated, theoretically grounded, and highly adaptable framework for identifying and executing high-probability trend pullback trades. Its unique blend of Fibonacci resonance, adaptive context, and multi-dimensional MTF filtering represents a significant advancement over conventional methods. While requiring thoughtful implementation and risk management, AFPS provides discerning traders with a powerful tool potentially capable of achieving institutional-level performance characteristics under optimized conditions.
Acknowledgments
Developed by FibonacciFlux. Inspired by principles of Fibonacci analysis, adaptive averaging, and multi-timeframe confirmation techniques explored within the trading community.
Disclaimer
Trading involves substantial risk. AFPS is an analytical tool, not a guarantee of profit. Past performance is not indicative of future results. Market conditions change. Users are solely responsible for their decisions and risk management. Thorough testing is essential. Deploy at your own considered risk.

2013-2025 EclipsesIndicator Description: 2013-2025 Eclipses
This Pine Script (version 5) indicator overlays solar and lunar eclipse events on a TradingView chart, covering the period from 2013 to 2025. It is designed for traders and astrology enthusiasts who wish to visualize these significant astronomical events alongside price action, potentially identifying correlations with market movements or key turning points.
Features:
Eclipses:
Visualization: Displayed as a semi-transparent aqua background highlight across the chart.
Data: Includes 48 specific eclipse dates (both solar and lunar) from April 25, 2013, to September 21, 2025.
Purpose: Highlights dates of eclipses, which are often considered powerful astrological events associated with sudden changes, revelations, or significant shifts in energy and market sentiment.
Technical Details:
Overlay: The indicator is set to overlay=true, ensuring it displays directly on the price chart rather than in a separate pane.
Date Matching: Utilizes a helper function is_date(y, m, d) to determine if the current chart date matches any of the predefined eclipse dates, using TradingView's year, month, and dayofmonth variables.
Visualization Method:
bgcolor: Applies a light aqua background (using color.new(color.aqua, 85)) on the specific dates of eclipses. The transparency level of 85 allows price action to remain visible through the highlight.
Time Range: Spans from April 2013 to September 2025, covering a 12+ year period of eclipse events.
Usage:
Add the script to your TradingView chart to see eclipse dates highlighted with an aqua background on your chosen symbol and timeframe.
The background highlight appears only on the exact dates of eclipses, making it easy to spot these events amidst price data.
Ideal for those incorporating astrological analysis into trading or studying the potential impact of eclipses on financial markets.
Notes:
The script uses a single-line definition for eclipse_dates to ensure compatibility with Pine Script v5 syntax and avoid line continuation errors.
The aqua color matches the original circle-based visualization, with transparency adjustable via the color.new(color.aqua, 85) parameter (0 = fully opaque, 100 = fully transparent).
Works best on daily or higher timeframes for clear visibility of individual eclipse dates, though it functions on any TradingView-supported timeframe.
Eclipse dates should be cross-checked with astronomical sources for critical applications, as the script relies on the provided data accuracy.
Purpose:
This indicator provides a straightforward way to track eclipses over a 12-year period, offering a visual representation of these potent celestial events. By using a background highlight instead of markers, it maintains chart clarity while emphasizing the specific days when eclipses occur, potentially aiding in the analysis of their influence on market behavior or personal trading strategies.
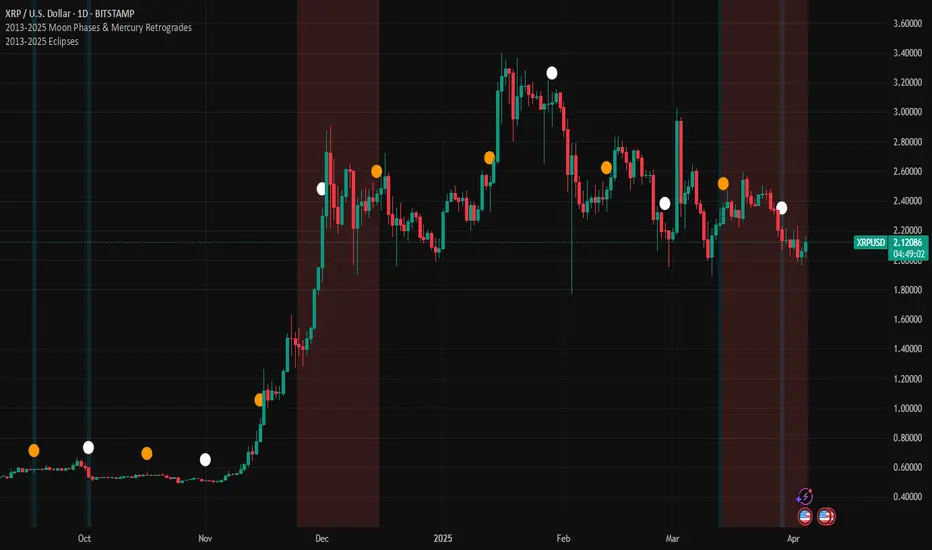
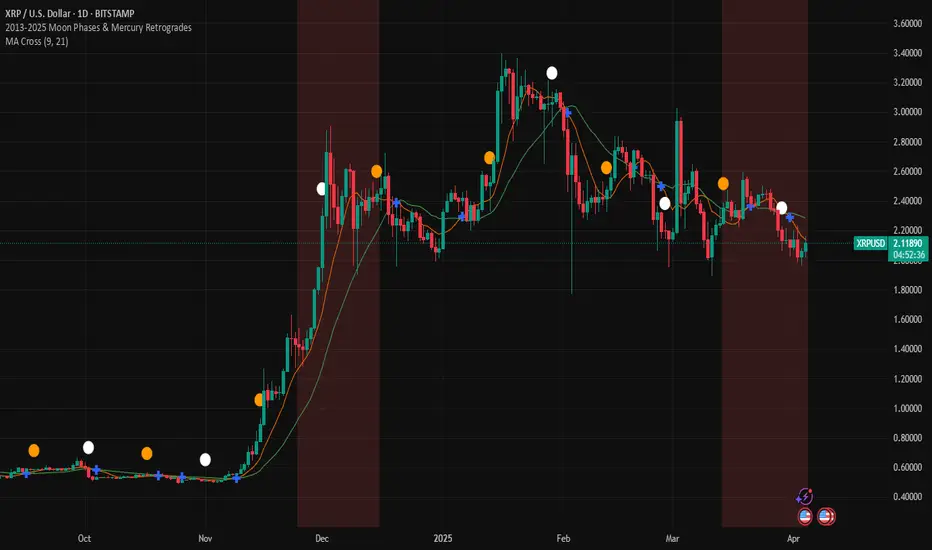
2013-2025 Moon Phases & Mercury RetrogradesIndicator Description: 2013-2025 Moon Phases & Mercury Retrogrades
This Pine Script (version 5) indicator overlays key astrological events on a TradingView chart, specifically tracking full moons, new moons, and Mercury retrograde periods from 2013 to 2025. It is designed to help traders and astrology enthusiasts visualize these celestial events alongside price action, potentially identifying correlations or patterns.
Features:
New Moons:
Visualization: Plotted as small white circles above the price bars.
Data: Includes 156 specific new moon dates from January 11, 2013, to December 20, 2025.
Purpose: Marks the start of the lunar cycle, often associated with new beginnings or shifts in energy.
Full Moons:
Visualization: Plotted as small orange circles above the price bars.
Data: Includes 157 specific full moon dates from January 27, 2013, to December 15, 2025.
Purpose: Highlights the peak of the lunar cycle, often linked to heightened emotions or market volatility in astrological analysis.
Mercury Retrogrades:
Visualization: Displayed as a light red background highlight across the chart.
Data: Covers 39 Mercury retrograde periods, with precise start and end timestamps from February 23, 2013, to November 29, 2025.
Purpose: Indicates periods traditionally associated with communication issues, delays, or reversals, which some traders monitor for potential market impacts.
Technical Details:
Overlay: The indicator is set to overlay=true, meaning it displays directly on the price chart rather than in a separate pane.
Date Matching: Uses a helper function is_date(y, m, d) to check if the current chart date matches any of the predefined event dates, leveraging TradingView's year, month, and dayofmonth variables.
Visualization Methods:
plotshape: Used for new moons (white circles) and full moons (orange circles), positioned above bars for clear visibility.
bgcolor: Used for Mercury retrograde periods, applying a semi-transparent red highlight (transparency level 85) to the background during active retrograde periods.
Time Range: Spans from January 2013 to December 2025, providing a comprehensive 13-year view of these astrological events.
Usage:
Add the script to your TradingView chart to see new moons, full moons, and Mercury retrograde periods overlaid on your chosen symbol and timeframe.
The white and orange circles appear on specific dates, while the red background highlights extend across the duration of each Mercury retrograde period.
Useful for traders incorporating astrology into their analysis or anyone interested in tracking these celestial events alongside financial data.
Notes:
The script assumes accurate date data as provided; users should verify dates against astronomical sources if precision is critical.
The transparency of the Mercury retrograde background can be adjusted by modifying the value in color.new(color.red, 85) (0 = fully opaque, 100 = fully transparent).
Best viewed on daily or higher timeframes for clarity, though it works on any timeframe supported by TradingView.
This indicator provides a visual tool to explore the potential influence of lunar phases and Mercury retrograde periods on market behavior, blending astrology with technical analysis in a clear, customizable format.
Multi-Timeframe S/R & Breakout Projection1) What This Script Does
Collects S/R levels from the 15-minute and 1-hour timeframes, using each timeframe’s pivot detection.
Sorts those pivot-based levels by their distance from the current price, so you see the nearest levels first.
Draws up to a user-defined number of those levels as horizontal rays on the current chart.
Checks breakouts at the nearest S/R line (the one with the smallest distance from price):
Real Breakout: price breaks above a level and sustains above it for the specified number of bars.
False Breakout: price breaks above but quickly closes back below within the specified lookback.
On confirmation of a real or false breakout, that S/R line changes color to green if price is going higher, or red if price is going lower.
Displays a small table in the corner with:
Daily Trend: bullish or bearish, using an SMA on a 30-minute timeframe.
Sentiment: bullish or bearish, using RSI on the same 30-minute timeframe.
2) How It Works
Multi-Timeframe Pivot Detection
The script uses request.security() to fetch pivot highs/lows from two higher timeframes (15m and 60m).
It collects up to a user-specified number of these pivots (numRecent) from each TF.
Sorting & Plotting S/R Lines
Once pivot values are gathered, the script calculates their “distance” from current price.
It sorts them so that the S/R lines drawn on your chart are the nearest ones first.
Each line is drawn with a color and style you can customize:
srRayColor sets the overall color (e.g. yellow).
srRayStyleOptions can be Solid, Dashed, or Dotted.
Breakout Determination
After drawing the lines, the script looks at the nearest line and applies two specialized checks (f_isFalseBreakout & f_isRealBreakout):
A real breakout occurs if price closes above (or below) and remains on that side for breakLook bars.
A false breakout occurs if price closes above (or below) but quickly returns.
When a breakout is confirmed, that nearest line changes color to:
Green if price is ultimately going up,
Red if price is going down.
Daily Trend & Sentiment Table
A small table in the bottom-right corner shows:
Daily Trend: uses a 30-minute SMA to see if your price is above/below on that timeframe.
Sentiment: uses the RSI (also on 30m). A value over 50 suggests bullish sentiment; under 50 suggests bearish.
3) How to Use It
Timeframes & Pivots
Choose how many pivots (numRecent) from each TF to fetch (up to 10 total). A higher number means you’ll see more historical S/R lines.
Customize pivotLeft & pivotRight for how “wide” the pivot detection is.
Line Customization
In the script’s Inputs tab, you’ll find:
S/R Rays Color – sets the hue of the lines.
S/R Line Style – pick from Solid, Dashed, or Dotted.
Liquidity Lines Color – color for the smaller pivot lines from your chart timeframe’s pivot detection.
Breakout Lookback
breakLook determines how many bars must confirm or refute the breakout. Adjust it based on how conservative or aggressive you want the breakout detection.
Check the Table
In the bottom-right, watch the script’s “Daily Trend” & “Sentiment”. This can be a quick filter for trades:
“Bullish” daily trend with a bullish sentiment is often more favorable for long trades.
Conversely, “Bearish” daily trend & sentiment can confirm short ideas.
Scenarios
If you see a “Real Breakout” label near the line, the script recolors that line green or red, indicating a possible continuous move.
A “False Breakout” label suggests the price has quickly retraced.
4) Originality & Concepts
Multi-Timeframe Approach: Many S/R indicators fetch only local pivot lines; here, we explicitly gather pivot points from two separate TFs (15m & 60m) and project them onto your lower timeframe chart.
Distance-Based Sorting ensures you only see the nearest lines on the chart, preventing clutter from excessive lines.
Breakout Logic used is straightforward but effective: it checks if price truly holds beyond a level (real breakout) or fails to hold (false breakout).
Line Recoloring provides immediate visual feedback on the success or failure of the breakout.
5) Chart Usage
Plot this script on a relatively low timeframe chart (like the 1m, 5m, or 15m) to see the higher timeframe S/R lines.
Select how many S/R lines you want to show, choose the line style, set your pivot detection parameters, then watch for breakouts.
Tips:
Start with fewer lines (maxLevels=3 or 5) so the chart remains clear.
You can experiment with a small breakLook if you want more immediate breakout signals, or a higher breakLook if you need stronger confirmation.
Enjoy using the “Multi-Timeframe S/R & Breakout Projection” script! It simplifies the manual process of spotting higher timeframe pivot lines and helps you quickly assess potential breakouts or fakes on your intraday charts, all while giving you a snapshot of the higher timeframe’s trend and sentiment.

D3m4h GIFVGDescription
D3m4h GIFVG is an indicator designed to automatically detect market imbalances—often referred to as FVGs (Fair Value Gaps)—and potential pivot-based shifts in market structure. It offers a dynamic approach to visualizing supply/demand inefficiencies and pivot-based trend changes. Key features include:
1. Pivot-Based Bullish/Bearish Detection
The indicator identifies higher-high/lower-low pivot logic as well as “outside bar” pivots.
It tracks when the market transitions from bullish to bearish ranges, or vice versa, by using multiple checks:
Pivot low/high detection
Break-of-structure (when price crosses the last pivot)
Opposing FVG detection to confirm an intraday pivot shift
2. FVG (Fair Value Gap) Detection
The script automatically scans for bullish or bearish FVG conditions:
Bullish FVG: Candle at position (bar_index - 2) has a high below the current candle’s low.
Bearish FVG: Candle at position (bar_index - 2) has a low above the current candle’s high.
When it detects an FVG, it draws a box on the chart to highlight the price gap (yellow boxes by default).
3. Pivot Range FVG
If an FVG forms while the market is in a bullish pivot range, the script can paint a special “blue” FVG to underscore its significance. The same logic applies if a newly formed FVG appears in a bearish pivot range.
4. Filled Gap Cleanup
You can optionally hide standard FVG boxes once they’re filled. For example, if the candle’s body (or candle range) covers that gap, the box is removed to keep your chart clean.
5. Pivot-Range FVG “Raided” Cleanup
If the pivot-based FVG is later filled from the opposing direction, it turns green and can optionally remove itself after a set number of bars.
6. Informative Table
A small table on the chart optionally displays whether or not the pivot-based FVG has been “raided”. You can toggle this table on/off in the settings.
How It Works
1. Pivot Shifts
The script tracks the last pivot high/low using a combination of candle-based pivot detection and break-of-structure checks (when price crosses the last pivot in the opposite direction).
When a shift is detected, the pivot range ID increments—this helps the script know when to remove old pivot-based FVGs or draw new ones.
2. FVG Formation
Each new bar checks if a bullish or bearish FVG formed (comparing the high of bar two bars ago to the current low, or the low of bar two bars ago to the current high).
If one is found, a box is drawn to highlight the imbalance. Its color and extension depend on script settings.
3. Imbalance or Pivot FVG
Standard imbalance boxes appear in yellow.
If the new imbalance coincides with a bullish or bearish pivot range, a special “pivot imbalance” box in blue is drawn.
3. Hide Filled
If a newly formed candle’s body fully covers the FVG, the box is considered filled. If Hide Filled Gaps is enabled, the box is deleted once it’s covered.
4. Raid Status
For the pivot-based (blue) FVG, once price invalidates it from the opposite side, it changes color to green and gets removed after a user-defined number of bars.
How to Use
1. Look for FVGs
Observe yellow boxes to identify potential intraday imbalances. Watch for price returning to fill these zones.
If you see a “blue” box, it signifies a pivot-based FVG in line with a recognized shift in structure—arguably a higher-probability zone.
2. “Hide Filled Gaps”
Turn this on if you only want to see currently active or partially filled imbalances. The script cleans up old, fully covered boxes to keep your chart neat.
3. Pivot Shifts
Note the script’s internal pivot logic. Each new pivot re-defines bullish or bearish states. Use these states to gauge the short-term trend shifts.
4. Toggle the Table
You can show or hide the chart table by enabling/disabling “Show Table” from the inputs. This table indicates if the pivot-based “GIFVG” has been “raided” or not.
5. Extend Count
Adjust the extendCount in the code if you want FVG boxes to extend further or shorter in time.
Underlying Concepts
Fair Value Gaps
Market inefficiencies that occur when price jumps, leaving a “gap” from the candle 2 bars ago to the current candle. They can act like mini supply/demand zones where price may revisit for balance.
Pivot Ranges
The script tries to maintain an internal sense of whether the market is in a bullish or bearish pivot range. When it sees a contrary FVG or break-of-structure, it flips the pivot state.
Outside Bars
A candle that has both a higher high and a lower low than the previous bar. The script uses these to mark significant pivot shifts.
By combining pivot-based logic with FVG detection, the D3m4h GIFVG indicator helps highlight potential areas of liquidity or unfilled value. Traders can use these zones to plan entries/exits or to confirm short-term trend shifts.

GALFER {GALFER} SMCGentryIntroducing Our TradingView Indicator
This leading indicator is designed to automatically mark major swing points in any market of your choice—forex, crypto, indices, or commodities.
✅ It adapts to your strategy and is ideal for:
Day Trading
Swing Trading
Scalping (even on second-based timeframes)
📌 Important Note:
The true value of this tool depends on your understanding of forex basics and price action. With the right knowledge, you'll be ready to trade with precision and confidence.
🎯 Whether you're a beginner or an experienced trader, this indicator is your edge in identifying key market turning points—before they happen.
GoldenPocket & CRT IndicatorWith this script, you will be able to see Golden Pocket Fibonacci Levels and Candle Range Theory Highs, Lows and EQs.
You can set lookback bar numbers to define Fibonacci highs and lows.
You can set CRT High Time-frame.
Simple and effective script. Please let me know if you have any comments and support me if you like it.

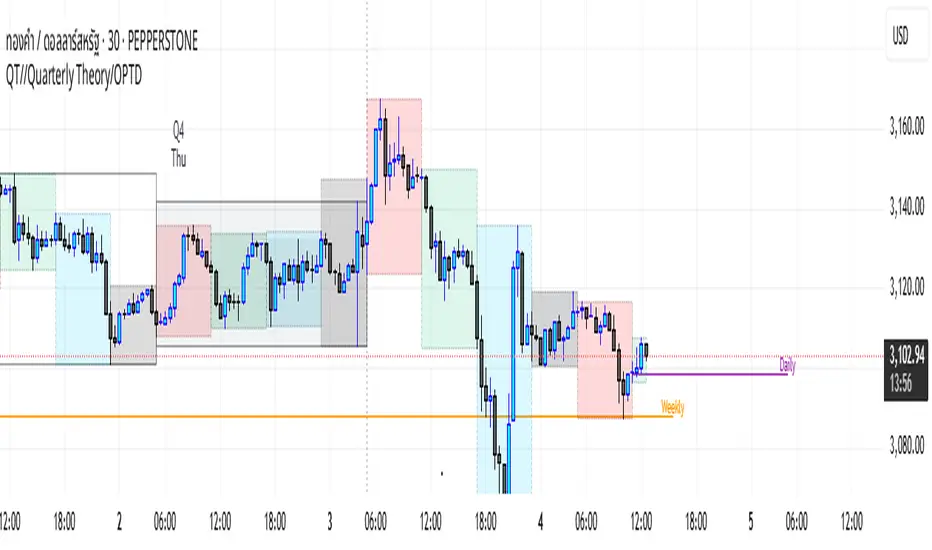
QT/TD.Den Quarterly Theory QT//Quarterly Theory/OPTD
These Quarters represent:
A - Accumulation (required for a cycle to occur)
M - Manipulation
D - Distribution
X - Reversal/Continuation
The latter are going to always be in this specific sequence; however the cycle can be transposed to have its beginning in X, trivially followed by A, M, and finally D.
This feature is not automatic and at the subjective discretion of the Analyst.
Note: this theory has been developed on Futures, hence its validity and reliability may change depending on the market Time.
This tool does provide a dynamic and auto-adapting aspect to different market types and Times, however they must be seen as experimental.
> Quarterly Cycles
The Quarterly Cycles currently supported are: Yearly, Monthly, Weekly, Daily, 90 Minute, Micro Sessions.
– Yearly Cycle:
Analogously to financial quarters, the year is divided in four sections of three months each
Q1 - January, February, March
Q2 - April, May, June (True Open, April Open)
Q3 - July, August, September
Q4 - October, November, December
JW Momentum IndicatorJW Momentum Indicator
This indicator provides clear and actionable buy/sell signals based on a combination of volume-enhanced momentum, divergence detection, and volatility adjustment. It's designed to identify potential trend reversals and momentum shifts with a focus on high-probability setups.
Key Features:
Volume-Enhanced Momentum: The indicator calculates a custom oscillator that combines momentum with volume, giving more weight to momentum when volume is significant. This helps to identify strong momentum moves.
Divergence Detection: It detects bullish and bearish divergences using pivot highs and lows, highlighting potential trend reversals.
Volatility-Adjusted Signals: The indicator adjusts signal sensitivity based on the Average True Range (ATR), making it more reliable in varying market conditions.
Clear Visuals: Buy and sell signals are clearly indicated with up and down triangles, while divergences are highlighted with distinct labels.
How to Use:
Buy Signals: Look for green up triangles or bullish divergence labels.
Sell Signals: Look for red down triangles or bearish divergence labels.
Oscillator and Thresholds: Use the plotted oscillator and thresholds to confirm signal strength.
Parameters:
Momentum Period: Adjusts the length of the momentum calculation.
Volume Average Period: Adjusts the length of the volume average calculation.
Volatility Period: Adjusts the length of the ATR calculation.
Volatility Multiplier: Adjusts the sensitivity of the volatility-adjusted signals.
Disclaimer:
This indicator is for informational purposes only and should not be considered financial advice. Always conduct 1 thorough research and use appropriate risk management techniques when trading.

LUX CLARA - EMA + VWAP (No ATR Filter) - v6EMA STRAT SHOUT OUTOUTLIERSSSSS
Overview:
an intraday strategy built around two core principles:
Trend Confirmation using the 50 EMA (Exponential Moving Average) in relation to the VWAP (Volume-Weighted Average Price).
Entry Signals triggered by the 8 EMA crossing the 50 EMA in the direction of that confirmed trend.
Key Logic:
Bullish Trend if the 50 EMA is above VWAP. Only long entries are allowed when the 8 EMA crosses above the 50 EMA during that bullish phase.
Bearish Trend if the 50 EMA is below VWAP. Only short entries are allowed when the 8 EMA crosses below the 50 EMA during that bearish phase.
Intraday Focus: Trades are restricted to a user-defined session window (default 7:30 AM–11:30 AM), aligning entries/exits with peak intraday liquidity.
Exit Rule: Positions close automatically when the 8 EMA crosses back in the opposite direction of the entry.
Why It Works:
EMA + VWAP helps detect both immediate momentum (EMAs) and overall institutional bias (VWAP).
By confining trades to a set intraday window, the strategy aims to capture morning volatility while avoiding choppy afternoon or overnight sessions.
Customization:
Users can adjust EMA lengths, session times, or incorporate stops/targets for additional risk management.
It can be tested on various symbols and intraday timeframes to gauge performance and robustness.

Smart Money Breakout & Order Block StrategySmart Money Breakout & Order Block Strategy
Created by Shubham
This strategy was developed by Shubham, designed to provide traders with a structured approach to smart money trading by combining breakout entries and order block reversals. It focuses on liquidity zones, volatility filters, and ATR-based stop management to adapt to different market conditions.
🔹 Strategy Overview
The Smart Money Breakout & Order Block Strategy is built for traders who want to identify institutional moves while avoiding false breakouts. This non-repainting strategy helps traders detect:
✅ Momentum Breakouts – Price breaking key support & resistance levels.
✅ Order Block Reversals – Institutional buying & selling zones.
✅ Dynamic Stop Management – No fixed SL/TP; uses ATR-based trailing stops.
✅ Volatility Filtering – Avoids choppy market conditions.
🔹 Trading Logic
1️⃣ Breakout Trading (Momentum Entries)
Long Entry: When price breaks above resistance with high volatility.
Short Entry: When price breaks below support with high volatility.
2️⃣ Order Block Reversals (Liquidity Entries)
Bullish Order Block: A strong price rejection after consecutive bearish candles signals smart money accumulation, triggering a long trade.
Bearish Order Block: A strong price rejection after consecutive bullish candles signals smart money distribution, triggering a short trade.
3️⃣ Volatility Filter (False Signal Prevention)
Uses normalized volatility to ensure breakouts are backed by strong momentum.
Helps filter out low-volume, choppy market conditions.
4️⃣ ATR-Based Position Management (Dynamic Stops & Trailing Stop)
No fixed SL/TP → Uses ATR-based stop-loss to adapt to market volatility.
Implements a trailing stop for maximizing potential profits in trending markets.
🔹 Key Features
✔️ Developed by Shubham – Designed for precision trading with institutional techniques.
✔️ Smart Money Concept – Identifies liquidity zones, breakouts, and order blocks.
✔️ Volatility Filter – Prevents false breakouts by analyzing market momentum.
✔️ ATR-Based Dynamic Stops – No fixed SL/TP, making it more adaptive.
✔️ Trailing Stop Functionality – Allows profits to run while reducing risk.
✔️ Fully Automated Execution – Uses TradingView’s strategy functions for automatic trade placement and exits.
✔️ Commission-Adjusted Backtesting – Includes realistic commission settings to ensure accurate results.
📊 Backtesting & Realistic Expectations
✅ Best for Higher Timeframes (1H, 4H, Daily) – Avoids market noise.
✅ Most Effective in Trending & Volatile Markets – Crypto, forex, indices, and commodities.
✅ Performance Varies with Market Conditions – Works best in strong trends.
✅ No Unrealistic Promises – Strategy performance is dependent on market behavior and risk management.
📌 IMPORTANT DISCLAIMER:
This strategy is provided for educational purposes only and should not be considered financial advice. Past performance in backtesting does not guarantee future results. Users should conduct their own research before applying this strategy in live markets.
🚀 Developed by Shubham – Test it yourself and see how it performs! 🚀
