OHLC 0.5 @SplintsThis indicator provides a dynamic visualization of OHLC levels, allowing traders to analyze price action across multiple candles with enhanced clarity. It features customizable options for timeframe selection, candle count, and mid-level calculations (High/Low 50% and Open/Close 50%). The script utilizes gradient-based coloring for a clear distinction between levels and supports dynamic extension for better visibility.
Key Features:
Displays Open, High, Low, and Close levels with adjustable extension lengths
Supports mid-level calculations for enhanced trade decision-making
Gradient coloring for improved visual clarity across multiple candles
Configurable labels for quick reference to key price points
Efficient object management using arrays for optimized performance
Perfect for traders seeking structured insights into candle dynamics and session-based analysis.
Chart patterns
Swing Highs and Lows Detector🔍 Swing Highs and Lows Detector
The Swing Highs and Lows Detector is a powerful tool for traders looking to identify meaningful structural shifts in price action, based on swing point logic and internal trend shifts.
📈 What It Does
This indicator automatically identifies and labels:
HH (Higher High) – Price broke above the previous swing high
LH (Lower High) – Price failed to break the previous high, signaling potential weakness
LL (Lower Low) – Price broke below the previous swing low
HL (Higher Low) – Price maintained a higher support level, indicating strength
The script distinguishes between bullish and bearish internal shifts and tracks the highest/lowest points between those shifts to determine the swing structure.
⚙️ How It Works
You can choose between two shift detection modes:
"Open": Compares closing price to the first open of the opposite streak
"High/Low": Uses the high of bearish or low of bullish candles
Once a shift is confirmed, the indicator scans the bars between shifts to find the most significant swing high or low
When a valid swing is detected, it’s labeled directly on the chart with color-coded markers
🛎️ Built-in Alerts
Set alerts for:
Higher High
Lower High
Lower Low
Higher Low
These alerts help you catch key structural shifts in real time — great for breakout traders, structure-based analysts, and smart money concepts (SMC) strategies.
✅ How to Use
Confirm Trend Strength or Reversals – Use HH/HL to confirm an uptrend, LL/LH to confirm a downtrend
Combine with Liquidity Sweeps or Zones – Ideal for SMC or Wyckoff-style setups
Entry/Exit Triggers – Use swing breaks to time entries or exits near key structural points

Failed 2s - The StratDescription:
This indicator detects and highlights "Failed 2" candlestick patterns from The Strat methodology — key price action setups signaling potential reversals or continuation points. It automatically identifies Failed 2 Down (Failed 2D) and Failed 2 Up (Failed 2U) signals by analyzing two consecutive bars, with special attention to price interaction at the 50% midpoint of the previous candle.
Visuals:
- Green upward triangles mark Failed 2 Down signals (bullish setups).
- Red downward triangles mark Failed 2 Up signals (bearish setups).
- Special signals that touch the 50% midpoint of the previous candle are emphasized but use the same shapes.
Alerts:
Built-in alert conditions let you receive notifications when these patterns occur, so you never miss a trade opportunity.
How to Use ALERTS in TradingView
- Paste this code into Pine Editor on TradingView.
- Click Add to Chart.
Set alerts:
- Click "Alerts" → "Condition" = your indicator name
- Choose the alert type (e.g. "Failed 2D Bar Alert")
- Set "Once per bar close"
- Customize the notification method (pop-up, app, email, etc.)
ATS LOGIC CHART EXPERT V5.0### **ATS Logic Chart Expert V5.0**
#### **Wyckoff-Inspired Automated Trend & Structure Analysis Tool**
---
### **🔹 Overview**
**ATS Logic Chart Expert V5.0** is an advanced Wyckoff-based charting indicator designed for automated trend analysis, support/resistance mapping, and breakout signal generation. It intelligently plots key price structure lines and identifies high-probability reversal signals using the Wyckoff accumulation/distribution model (LPS/LPSY), making it ideal for both swing traders and trend followers.
---
### **🔹 Key Features**
#### **1️⃣ Automated Price Structure Lines**
- **Smart detection of swing highs/lows** with auto-plotting of critical support/resistance
- **White Dashed Line (Resistance)** – Formed by prior downtrends, marks potential breakout zones
- **Red Dashed Line (Support)** – Derived from uptrends, signals breakdown risks
- **Up/Down Triangle Markers** – Highlight key pivot points for manual S/R refinement
#### **2️⃣ Wyckoff LPS/LPSY Signal Engine**
| **Signal** | **Trigger Condition** | **Market Implication** |
|------------|----------------------|-----------------------|
| **LPS (Last Point of Support)** | Break above white resistance (confirms accumulation) | Bullish trend initiation |
| **CVG LPS (Covered LPS)** | Retest & second breakout | Stronger bullish confirmation |
| **LPSY (Last Point of Supply)** | Breakdown below red support (confirms distribution) | Bearish trend initiation |
| **CVG LPSY (Covered LPSY)** | Pullback & second breakdown | Stronger bearish confirmation |
#### **3️⃣ Breakout Signals (BK1/SK1)**
- **BK1 (Breakout 1)** – First close above white resistance, early long opportunity
- **SK1 (Short Kill 1)** – First close below red support, early short opportunity
- **Optimized for momentum traders** to capture initial trend acceleration
---
### **🔹 Signal Logic Deep Dive**
#### **📈 Bullish Scenario (LPS / BK1)**
1. **Accumulation Phase**: Price consolidates near lows, forming a base
2. **Breakout**: Price breaches white resistance → triggers **LPS** or **BK1**
3. **Retest Reinforcement**: Successful retest & rebound → confirms **CVG LPS**
#### **📉 Bearish Scenario (LPSY / SK1)**
1. **Distribution Phase**: Price churns near highs, creating topping patterns
2. **Breakdown**: Price cracks red support → triggers **LPSY** or **SK1**
3. **Pullback Reinforcement**: Failed rebound → confirms **CVG LPSY**
---
### **🔹 Practical Applications**
✅ **Trend Trading**: Ride LPS/LPSY-confirmed trends
✅ **Reversal Trading**: Fade extremes with BK1/SK1 early alerts
✅ **S/R Trading**: Use auto-plotted lines for limit orders
---
### **🔹 Customization Tips**
- **Adjust sensitivity**: Modify swing point detection periods per asset volatility
- **Signal filters**: Combine with moving averages/volume for fewer false breaks
---
### **🔹 Conclusion**
**ATS Logic Chart Expert V5.0** delivers:
- **Hands-free structure mapping** (no manual drawing)
- **Institutional-grade reversal signals** (Wyckoff LPS/LPSY)
- **First-mover advantage** (BK1/SK1 early entries)
> ⚠️ **Risk Note**: Always use stop-losses. Backtest for optimal settings in ranging markets.
---
**Ideal For**:
• Wyckoff method practitioners
• Price action traders
• Breakout strategy enthusiasts

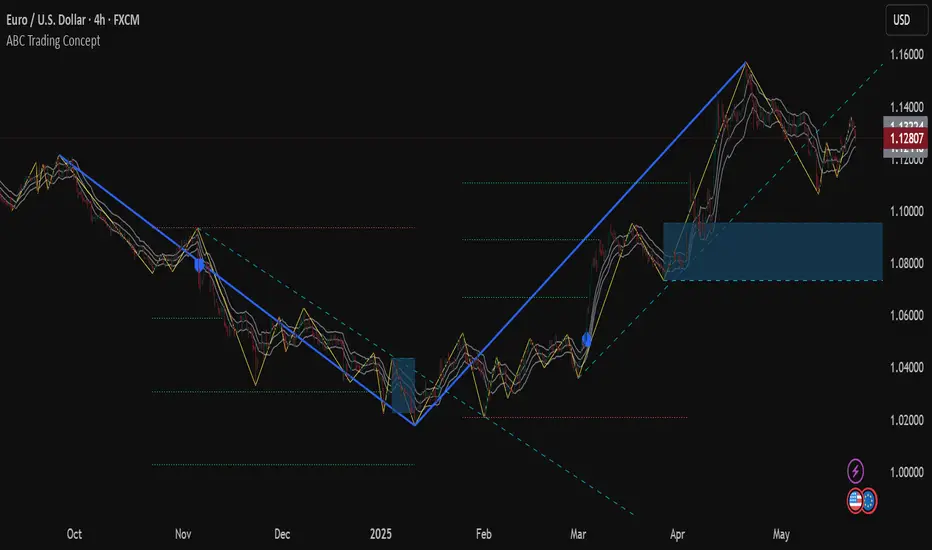
ABC Trading ConceptOverview
ABC Trading Concept is a wave- and trend-based market structure indicator that identifies shifts in price behavior by analyzing impulse and correction patterns. It introduces a unique calculation method—Price-MAD-ATR Bands—to detect wave formation, trend reversals, and potential trade zones with dynamic adaptability to volatility and trend strength.
🔧 Core Logic and Calculations
1. Price-MAD-ATR Bands
At the heart of the script is a proprietary channel system based on:
MAD (MA Difference): Difference between fast and slow moving averages.
ATR (Average True Range): Measures current market volatility.
The bands are plotted as:
Upper Band = Price + MAD × ATR
Lower Band = Price − MAD × ATR
A breakout beyond these bands signals the formation of a new wave (up or down).
2. Wave Formation (A and B Waves)
Standard Method: A new wave forms when price breaks through a Price-MAD-ATR Band.
Extreme Method: A wave also forms when price breaks the passive extremum of an existing wave.
Wave A may be generated by a correction breaking the Reversal Point.
Wave B can be configured to form in three modes, including breakouts of internal or boosted counter-corrections.
3. Trend Structure
A trend is built from waves and includes:
Direction, active/passive extremums
Impulses and Corrections (each tracked independently)
Reversal Point: Defined by a boosted correction breakout
G-Point: Set at the active extremum of Wave A
Vic Line: A trendline derived from previous correction extremums (optional)
When price breaks above the G-point, a new trend may be initiated.
4. Correction Boost Logic
A correction becomes boosted when price exceeds a configurable multiple of the correction’s range. Boosted corrections define key zones and enable the creation of Reversal Points and Wave A setups.
5. Vic Sperandeo Line
Optionally used to enhance trend structure confirmation. Drawn between extremums of previous corrections and may act as a secondary condition for forming Wave A.
6. SL/TP Level Calculation
At the start of a new trend, SL and TP levels are automatically plotted based on:
The extremums of Wave A or Wave B (selectable)
Configurable ratios (e.g., 1.382, 2.0, 2.618 for TP levels)
📊 Visual Elements on the Chart
Bands: Price-MAD-ATR Bands as adaptive upper/lower thresholds
Waves: Yellow zigzag lines
Trends: Blue (or purple for hard-type) trendlines with directional arrow
Reversal Point: Dashed horizontal line (starts from key correction breakout)
Correction Zone: Shaded rectangle from boosted correction range
Vic Line: Dashed support/resistance trendline
TP/SL Levels: Dotted horizontal levels, plotted at trend origin
⚙️ Inputs and Customization
You can adjust:
ATR and MA parameters
Band width multiplier
Boost strength threshold for corrections
SL/TP levels and logic (by Wave A or B)
Vic Line usage and visual styles for each element
Over 40 configurable settings are available to adapt the indicator to your strategy.
🧠 How to Use
Look for a new trend start when G-point is broken.
Use Wave A/B structure and Reversal Point for setup planning.
Correction Zones help identify re-entry areas or stop placement.
Follow TP/SL levels to manage exits with structural targets.
The Vic Line can act as dynamic support/resistance in context.
The indicator provides analytical insights—it does not generate automatic signals.
💡 What Makes It Unique
Unlike typical wave or Zigzag indicators, ABC Trading Concept introduces a volatility-adjusted wave logic using Price-MAD-ATR Bands. This method combines trend momentum (MA differential) with market volatility (ATR), offering a more flexible and noise-resistant structure recognition system. The integration of Wave A/B logic, dynamic reversal zones, and Vic Line validation makes it a comprehensive tool for structural traders.
⚠️ Disclaimer
This tool is for technical analysis and educational purposes. It does not guarantee profit or forecast market direction. Trading involves risk—use this script as part of a larger strategy with proper risk management.
High Low Levels by JZCustom High Low Levels Indicator - features
Clearly plotted high and low levels for specific trading sessions. This indicator provides visual representations of key price levels during various trading periods. Below are the main features and benefits of this indicator:
1. Display high and low levels for each session
- previous day high/low: display the high and low from the previous day, giving you a better understanding of how the price moves compared to the prior day.
- asia, london, and custom sessions: track the high and low levels for the major trading sessions (asian and london) and two custom user-defined sessions.
2. Complete line and label customization
- custom line appearance: choose the color, line style (solid, dashed, dotted), and line thickness for each trading session. you can also decide if the lines should extend beyond the current price action.
- custom labels: define your own label texts for each custom session. this way, you can label the levels precisely and easily track price movements.
3. Define your own trading sessions
- add up to two custom sessions (custom and custom 2), which can be defined using precise start and end times (hour and minute).
- each custom session allows you to specify the label text for the high and low levels, enabling you to easily differentiate different parts of the day on the chart.
4. Clear and intuitive design
- grouped settings: all settings are grouped based on trading sessions, so you can easily customize every aspect of the visual representation.
- simple toggle on/off: you can easily enable or disable each line (previous day, asia, london, custom 1, custom 2). this allows you to keep your chart clean and focus only on the important levels you need at any moment.
5. Flexible time zones
- time zone settings: set the time zone (utc, europe/london, america/new_york, asia/tokyo) to properly align the timeframes for each level depending on the market you're focusing on.
6. Automatic cleanup of old lines and labels
- old levels removal: automatically remove old lines and labels to prevent clutter on your chart. this ensures that only current, relevant levels for each trading day or session are displayed.
7. Precise plotting and line extension
- accurate level markings: the indicator calculates the precise times when the high and low levels were reached and plots lines that visually represent these levels.
- line extension options: you have the option to extend the high/low lines beyond their point of calculation, which helps with identifying price action trends beyond the current period.
Dec 7, 2024
Release Notes
Changes and Improvements for Users:
1. Customizable Offset for Lines and Labels:
- A new input, `Line and Label Offset`, allows users to control how far the lines and their associated text labels extend. This ensures the labels and lines remain aligned and can be adjusted as needed.
2. Unified Offset Control:
- The same offset value is applied to all types of lines and labels (e.g., Previous Day High/Low, Asia High/Low, London High/Low, and custom sessions). Users can change this in one place to affect the entire script consistently.
3. Enhanced Flexibility:
- Users now have more control over the appearance and position of their lines and labels, making the indicator adaptable to different chart setups and personal preferences.
These updates aim to enhance user convenience and customization, ensuring a more tailored charting experience.

TripleTrend with RSI ReversalTripleTrend with RSI Reversal
The TripleTrend with RSI Reversal indicator is a comprehensive trading tool designed to identify trend direction, potential trend reversals, and trade entry/exit signals. It combines three independent SuperTrend indicators with varying sensitivities to provide a multi-layered view of the market trend. Additionally, it incorporates an RSI (Relative Strength Index) module to detect potential price reversals based on overbought/oversold conditions and to filter trend flip signals.
This indicator aims to provide clear visual cues on the chart, including trend lines, trend flip labels, and RSI-based reversal warnings, helping traders make more informed decisions.
Key Features
Triple SuperTrend Analysis
Utilizes three configurable SuperTrend lines, each with its own ATR period and multiplier, allowing for a nuanced view of short, medium, and long-term trends.
RSI Reversal Signals
Identifies potential market turning points when the RSI deeply penetrates overbought or oversold zones, plotting distinct visual cues and labels.
Trend Flip Labels
Displays labels on the chart when one, two, or all three SuperTrends change direction simultaneously, indicating the strength of the new trend. These labels also include the current RSI value.
Customizable RSI Filtering
Offers an option to filter out trend flip labels when the RSI is within a user-defined neutral range, reducing signals in choppy market conditions.
Configurable Alerts
Provides various alert conditions for trend flips and signal confirmations.
How It Works
SuperTrend Calculation:
- The indicator plots three separate SuperTrend lines. Each SuperTrend is calculated using an Average True Range (ATR) period and a multiplier.
- A SuperTrend line below the price indicates an uptrend (typically colored green).
- A SuperTrend line above the price indicates a downtrend (typically colored red).
- The sensitivity of each SuperTrend can be adjusted independently.
RSI Reversal Detection:
- A standard RSI is calculated.
- The indicator monitors if the RSI moves significantly beyond the user-defined Upper Threshold (overbought) or Lower Threshold (oversold).
- The depth of this penetration is measured as a percentage. If this percentage exceeds the Upper reversal range percent trigger (for overbought) or Lower reversal range percent trigger (for oversold), a blue line is plotted above the high (for potential bearish reversal) or below the low (for potential bullish reversal) of the signal candle.
- A "REV" label appears at the start of this blue line, showing the penetration percentage and the current RSI value.
Trend Flip Labels:
- When one or more SuperTrends flip direction, the indicator checks RSI conditions.
- For buy signals (trend flips upwards), labels appear if the RSI is below the RSI Upper threshold (i.e., not extremely overbought).
- For sell signals (trend flips downwards), labels appear if the RSI is above the RSI Lower threshold (i.e., not extremely oversold).
- Labels indicate which SuperTrend(s) flipped ("1", "2", "3", "1 2", etc.) and the current RSI value.
- An optional Custom RSI Filter can be enabled. If active, trend flip labels will not be shown if the RSI value is between the Custom RSI filter high limit and Custom RSI filter low limit, helping to avoid signals during market indecision.
Usage Guide
Interpreting SuperTrend Lines:
- The three SuperTrend lines act as dynamic levels of support (in an uptrend) or resistance (in a downtrend).
- A break of a SuperTrend line by the price suggests a potential change in that specific trend's direction.
- Confluence of trends (e.g., all three lines indicating an uptrend) suggests a stronger overall trend.
Trend Flip Labels:
- Single Trend Flip Labels ("1", "2", or "3"): Indicate an early change in one of the SuperTrends. These can be used for more aggressive entries or to signal a potential shift in momentum. The label includes the RSI value at the time of the flip.
- Double Trend Flip Labels ("1 2", "1 3", "2 3"): Offer stronger confirmation as two SuperTrends align in a new direction.
- Triple Trend Flip Labels ("1 2 3"): Represent the strongest trend confirmation, as all three SuperTrends have flipped simultaneously.
- Green labels suggest buy signals; red labels suggest sell signals.
- Always consider the accompanying RSI value on the label and the overall market context.
RSI Reversal Signals (Blue Lines & "REV" Labels):
- REV is for Reverse
- A blue line appearing above the price with a "REV" label suggests the RSI is deeply overbought, indicating potential uptrend exhaustion or a bearish reversal.
- A blue line appearing below the price with a "REV" label suggests the RSI is deeply oversold, indicating potential downtrend exhaustion or a bullish reversal.
- These are counter-trend signals and should be used with caution, preferably with confirmation from other indicators or price action. They can also serve as warnings to take profit on existing trend-following trades.
- Trend flip labels are suppressed when an RSI Reversal line is active, prioritizing the exhaustion signal.
Combining Signals:
- Look for trend flip labels (especially double or triple) that align with the broader market structure and occur when the RSI is not in extreme territory (as per label logic).
- Use RSI Reversal signals as potential early warnings of a trend ending or for high-probability counter-trend setups if strongly supported by other factors.
- If the Use custom RSI filter is enabled, be aware that trend flip labels will be hidden if the RSI is within the specified neutral zone. This can help avoid weaker signals in range-bound markets.
Settings Customization
Trend 1, 2, 3 Settings:
- ATR Period: Adjusts the lookback period for ATR calculation. Shorter periods make the SuperTrend more sensitive to price changes.
- Source: The price source used for calculations (default is hl2).
- ATR Multiplier: Controls the distance of the SuperTrend line from the price. Smaller multipliers result in tighter stops and more signals; larger multipliers result in wider stops and fewer signals.
- Show single/double/triple trend flip labels: Toggle visibility for these specific label types.
Label settings:
- Label Size: Adjusts the size of all indicator labels.
- Show reversal labels: Toggles visibility for the "REV" labels associated with RSI Reversal signals.
RSI Settings (Change often):
- RSI Length: The lookback period for the RSI calculation.
- RSI Upper threshold: The RSI level considered overbought.
- RSI Lower threshold: The RSI level considered oversold.
RSI Reversal detection settings:
- Upper reversal range percent trigger: Percentage of penetration into the (RSI Upper Threshold to 100) zone required to trigger an upper reversal signal. Higher values mean RSI needs to be deeper into overbought.
- Lower reversal range percent trigger: Percentage of penetration into the (RSI Lower Threshold to 0) zone required to trigger a lower reversal signal. Higher values mean RSI needs to be deeper into oversold.
Custom RSI filter settings:
- Use custom RSI filter: Enable/disable this filter for trend flip labels.
- Custom RSI filter high limit: If the filter is active, no trend flip labels will show if RSI is below this value (and above the low limit).
- Custom RSI filter low limit: If the filter is active, no trend flip labels will show if RSI is above this value (and below the high limit).
Alerts
- Individual trend flips (TripleTrend: Trend 1/2/3 flipped).
- Multiple trend flips (TripleTrend: 2 Trends flipped, TripleTrend: 3 Trends flipped).
- Confirmed buy/sell signals based on label logic (TripleTrend: Early/Double/Triple trend buy/sell signals).
- Configure these alerts in TradingView to receive notifications for specific market events detected by the indicator.
How I use TripleTrend with RSI Reversal
I use it on 5, 10 and 30 minute time frames.
I adjust the settings, especially the RSI thresholds for what I am trading, the day could be in the lower or upper regions of the RSI, I adjust as needed, when needed. I then use the REV (aka REVERSAL) indicators to indicate when to get out or caution me to not enter at that point. Unless I see something else which indicates otherwise.
Disclaimer
Trading involves substantial risk of loss and is not suitable for every investor. The TripleTrend indicator is to be used at your own risk and is only created to help you make decisions, it is not intended to make decisions for you. Past performance is not indicative of future results. Always do your own research and risk assessment before making any trading decisions. By using this indicator you use it at your own risk.

MestreDoFOMO Future Projection BoxMestreDoFOMO Future Projection Box - Description & How to Use
Description
The "MestreDoFOMO Future Projection Box" is a TradingView indicator tailored for crypto traders (e.g., BTC/USDT on 1H, 4H, or 1D timeframes). It visualizes current price ranges, projects future levels, and confirms trends using semi-transparent boxes. With labeled price levels and built-in alerts, it’s a simple yet powerful tool for identifying support, resistance, and potential price targets.
How It Works
Blue Box (Current Channel): Shows the recent price range over the last 10 bars (adjustable). The top is the highest high plus an ATR buffer, and the bottom is the lowest low minus the buffer. Labels display exact levels (e.g., "Top: 114000", "Bottom: 102600").
Green Box (Future Projection): Projects the price range 10 bars ahead (adjustable) based on the trend slope of the moving average. Labels show "Proj Top" and "Proj Bottom" for future targets.
Orange Box (Moving Average): Traces a 50-period EMA (adjustable) to confirm the trend. An upward slope signals a bullish trend; a downward slope signals a bearish trend. A label shows the current MA value (e.g., "MA: 105000").
Alerts: Triggers when the price nears the projected top or bottom, helping you catch breakouts or retracements.
How to Use
Add the Indicator: Apply "MestreDoFOMO Future Projection Box" to your chart in TradingView.
Interpret the Trend: Check the orange box’s slope—upward for bullish, downward for bearish.
Identify Key Levels: Use the blue box’s top as resistance and bottom as support. On a 4H chart, if the top is 114,000, expect resistance; if the bottom is 102,600, expect support.
Plan Targets: Use the green box for future targets—top for profit-taking (e.g., 114,000), bottom for stop-loss or buying (e.g., 102,600).
Set Alerts: Enable alerts for "Near Upper Projection" or "Near Lower Projection" to get notified when the price hits key levels.
Trade Examples:
Bullish: If the price breaks above the blue box top (e.g., 114,000), buy with a target at the green box top. Set a stop-loss below the green box bottom.
Bearish: If the price rejects at the blue box top and drops below the orange MA, short with a target at the blue box bottom.
Customize: Adjust the lookback period, projection bars, ATR multiplier, and MA length in the settings to fit your trading style.
Tips
Use on 1H for short-term trades, 4H for swing trades, or 1D for long-term trends.
Combine with volume or RSI to confirm signals.
Validate levels with market structure (e.g., candlestick patterns).

Day of Week and HTF Period SeparatorDay of Week & HTF Period Separator
A minimalist Pine Script indicator that adds clear, time-based separators and labels to intraday charts for better structure and analysis.
Key Features
• Day Labels
• Displays abbreviated weekday names (MON, TUE, WED, etc.) at a user-defined hour
• Custom text color and position
• Limits display to the most recent 28 days for a clean view
• Time Separators
• Daily: Vertical line at 00:00 each trading day
• 4-Hour: Lines at 00:00, 04:00, 08:00, 12:00, 16:00, 20:00
• Hourly: Divisions at every hour for detailed timing
• Customization
• Individual color picker for each separator type
• Choose line style: Solid, Dashed or Dotted
• Enable or disable any separator or label independently
• Smart limits to avoid clutter on extended history
• Smart Behavior
• Active only on intraday timeframes
• Projects upcoming separators into the future for planning
• Automatically caps historical plotting for performance
• Lines extend across full visible price range
Perfect for traders who need distinct session breaks, precise time-based zoning and an organized chart layout.
Inputs
• Show Day Labels (true/false)
• Label Hour (0–23)
• Day Label Color
• Show Daily Separators (true/false)
• Show 4H Separators (true/false)
• Show 1H Separators (true/false)
• Daily Line Color, Style
• 4H Line Color, Style
• Hourly Line Color, Style
• Max Days to Display
Enhance your intraday analysis with clean, customizable time markers. 👁

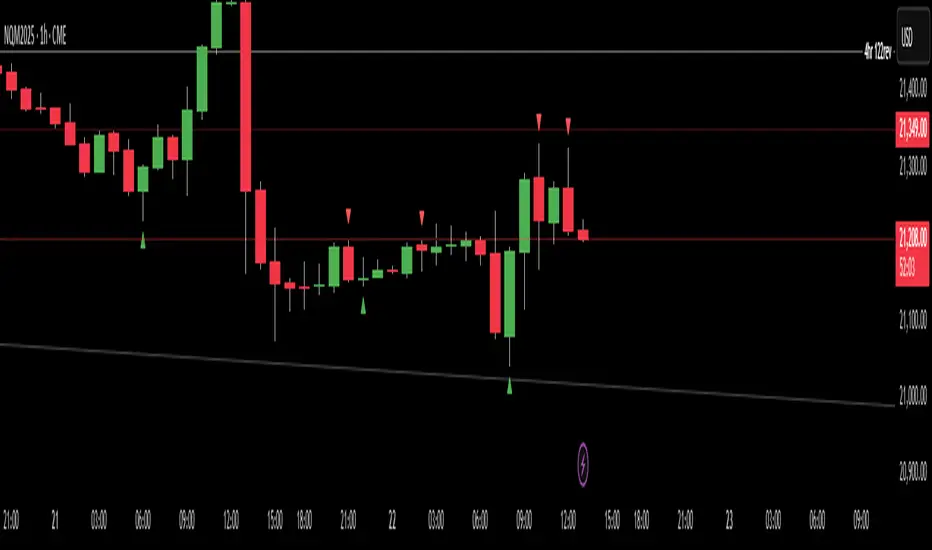
Wick Spike 50% Detector (15m & 1h)This script identifies candles with significant upper or lower wicks (spikes) based on a percentage of the total candle range. It helps spot potential reversals, exhaustion moves, or liquidity grabs — especially useful in volatile markets.
📍 Key Features:
15-Minute Timeframe:
Red Triangle Above: Candle range ≥ 0.35% and upper wick ≥ 50% of the range.
Green Triangle Below: Candle range ≥ 0.30% and lower wick ≥ 50% of the range.
1-Hour Timeframe:
Red Circle Above: Candle range ≥ 0.50% and upper wick ≥ 50%.
Green Circle Below: Candle range ≥ 0.50% and lower wick ≥ 50%.
📢 Alerts:
Alerts trigger when the 50% spike condition is met — within the last 60 seconds before candle close — ensuring timely notifications.
🎯 Designed to assist traders in identifying spike-driven opportunities and refining entry/exit strategies.

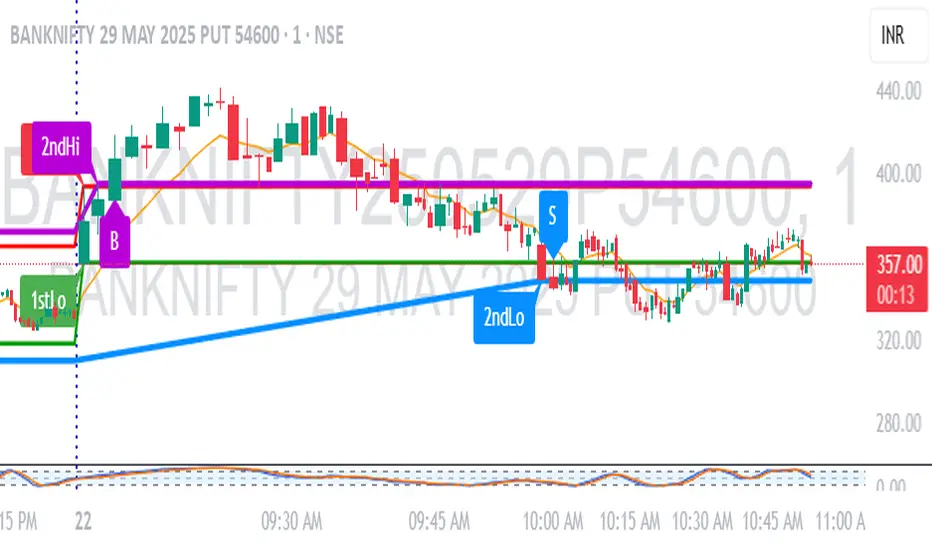
1M Scalp Setup – 2ndHi/2ndLo Breakout1M Scalp Setup – 2ndHi/2ndLo Breakout
This script is designed for 1-minute chart scalpers seeking high-probability intraday breakout setups based on early session price action. The strategy revolves around identifying the first high and low of the day, and then detecting the second breach (2nd high or 2nd low) to anticipate breakout entries.
🔍 Core Logic:
EMA Filter : A configurable EMA (default 8-period) is plotted for trend context.
1st High/Low Detection : Captures the very first high and low of each trading day.
2nd High/Low Markers : Identifies the second time price breaks the initial high or low, acting as a potential signal zone.
Breakout Signals :
A Buy Signal is triggered when price closes above the 2nd high.
A Sell Signal is triggered when price closes below the 2nd low.
Each signal is only triggered once per day to reduce noise and avoid overtrading.
🖌️ Visual Markers:
1stHi and 1stLo : Early session levels (red and green).
2ndHi and 2ndLo : Key breakout reference points (purple and blue).
B and S Labels : Buy and Sell triggers marked in real-time once breakouts occur.
⚙️ Inputs:
EMA Length (default: 8)
Customizable Colors for Buy/Sell signals and key markers
This tool is best used in fast-moving markets or during high-volume sessions. Combine with volume or higher-timeframe confirmation for improved accuracy.
VWAP + Candle-Rating SELL (close, robust)This multi‐timeframe setup first scans the 15-minute chart for strong bearish candles (body position in the bottom 40% of their range, i.e. rating 4 or 5) that close below the session VWAP. When it finds the first such “setup” of a trading period, it pins the low of that 15-minute candle as a trigger level and draws a persistent red line there. On the 5-minute chart, the strategy then waits for a similarly strong bearish candle (rating 4 or 5) to close below that marked low—at which point it emits a one‐time SELL signal. The trigger level remains in place (and additional sell signals are locked out) until the market “rescues” the price: a 15-minute bullish candle (rating 1 or 2) closing back above VWAP clears the old setup and allows the next valid bearish 15-minute candle to form a new trigger. This design ensures you only trade the most significant breakdowns after a clear bearish bias and avoids repeated signals until a genuine bullish reversal resets the system.

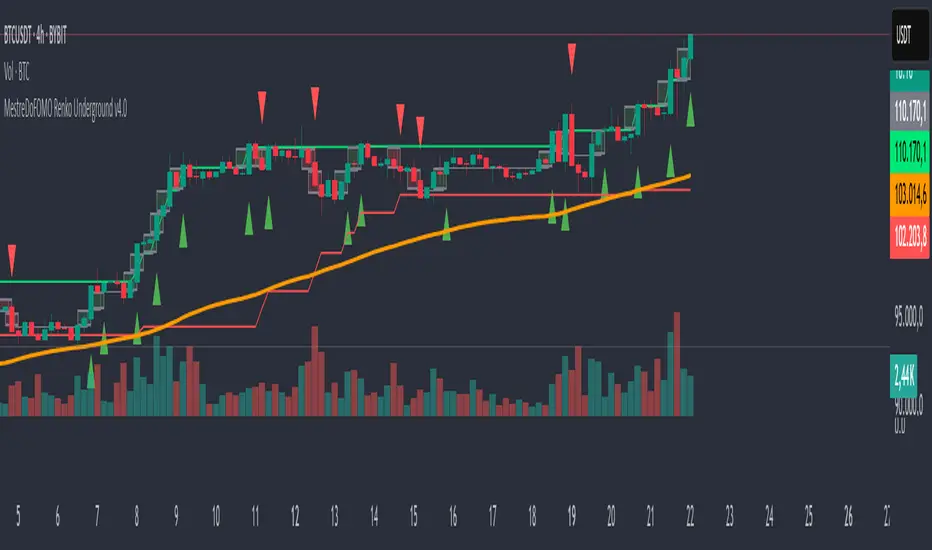
MestreDoFOMO Renko Underground v4.0Description:
The "MestreDoFOMO Renko Underground v4.0" is a custom indicator for TradingView that creates a dynamic Renko chart to help identify trends and reversal points in the market. Unlike traditional candlestick charts, Renko focuses solely on significant price movements, ignoring time and market noise. This script includes advanced features like support and resistance channels, moving averages, and alerts to assist with your trading decisions.
How It Works:
Dynamic Renko Bricks:
The brick size (price units to form each "box" on the chart) is calculated automatically using the ATR (Average True Range) with an adjustable multiplier. This means the size adapts to the asset's volatility (e.g., BTC/USDT). When the price moves up or down by the brick size, a new brick is created (green for up, red for down).
Reversal Signals:
Green triangles (🔼) appear below bars when the trend shifts to bullish, and red triangles (🔽) appear above when it shifts to bearish. These signals only appear on direction changes, reducing false signals.
Renko Channel:
The script draws two lines (green for resistance and red for support) based on the highs and lows of the last 10 bricks (or the value you set). This helps identify key price zones.
Moving Average on Bricks:
An orange line shows the moving average (EMA or SMA, your choice) of the last 20 bricks, helping confirm the overall trend.
Alerts:
You can set up alerts in TradingView to be notified when the trend shifts to bullish or bearish, perfect for active trading.
Visualization:
A gray dashed line shows the level of the last brick, providing a clear reference for the next expected move.
How to Use:
Add the indicator to your chart (e.g., BTC/USDT 1D).
Adjust parameters like the ATR multiplier, channel length, and moving average type in the settings menu.
Watch the bricks and signals to identify trends, and use the channels and moving average to plan entries and exits.
Enable alerts to receive real-time notifications.
Tip:
Test on different timeframes (1H, 4H, 1D) and adjust the ATR multiplier to match the volatility of the asset you're trading. Combine with other indicators (like RSI) for better results!
ORB - Opening Range Breakout + AlertsThe only ORB indicator you'll ever need.
- Flexible Range: Tailor the opening range (e.g., 5m, 15m, 30m) to your trading style.
- Key Levels: Auto-plots striking pink/purple support/resistance lines post-range for clear trade setups.
- Breakout Alerts: Reliable LONG/SHORT signals on 5m chart for confirmed breakouts; enable/disable as needed.
- Personalized Design: Customize line color and thickness for optimal visibility.
A friendly reminder that no tool or indicator guarantees success. Integrate this into a robust trading plan.

PSP/TrueOpen💎 Precision Swing Point (PSP) & True Open Levels Indicator 🚀
This advanced tool highlights Precision Swing Points (PSPs) and plots True Open Levels across major timeframes. It’s designed to help you spot potential reversals, align with institutional bias, and build higher-probability setups — all while giving you full customization over how everything looks and feels.
🔥 Key Features:
PSP Candle Highlighting
Automatically detects and highlights candles that meet the PSP criteria — usually found at major turning points in the market. Full customization options for wick color, border color, and visual appearance.
True Open Levels
TSO – True Session Open
TDO – True Day Open
TWO – True Week Open
TMO – True Month Open
Customization Options (for each True Open level):
Color
Line type – solid, dashed, or checkered
Line length – full-width or shortened
Custom Text Labels – Add your own notes to each level (e.g., “Weekly Bias,” “Institutional Anchor”)
🌟 What is a PSP?
A Precision Swing Point is a specific candle formation that shows up before strong moves. It usually sweeps a key level and closes with intent. PSPs often confirm SMT or SSMT divergences with a candle close at key levels — adding conviction to the idea that a reversal or expansion is about to unfold.
These points offer clean, asymmetric opportunities when aligned with structure or higher-timeframe bias. This indicator spots them automatically for you — no more guessing.
🚨 How to Use True Opens to Your Advantage:
True Opens act as precision anchors for market bias. When you compare the current cycle’s open to the higher timeframe’s open, it gives instant insight into context.
If the current session/day/week opens below the higher timeframe’s open, you’re operating in extreme discount.
If it opens above, you’re sitting in extreme premium.
That tells you whether you’re trading from a favorable location or chasing into poor pricing — especially when combined with PSPs, SMT, or Fair Value Gaps.
✨ Why Use True Opens?
True Opens aren’t just lines — they represent where institutions reset the auction. Price respects them across all timeframes. Whether you're scalping NY session or planning a swing entry, these levels help frame the market, highlight where power shifts, and clarify if you're early or late to a move.
⚠️ Caution:
If you find the PSP candle colors aren’t visible or appear behind other chart elements, right-click on the candles, select Visual Order, then choose Send to Back. This will ensure the highlights display properly.
🌠 Thank you for using my indicator. I appreciate your trust and support — wishing you success and clarity in your trading journey.

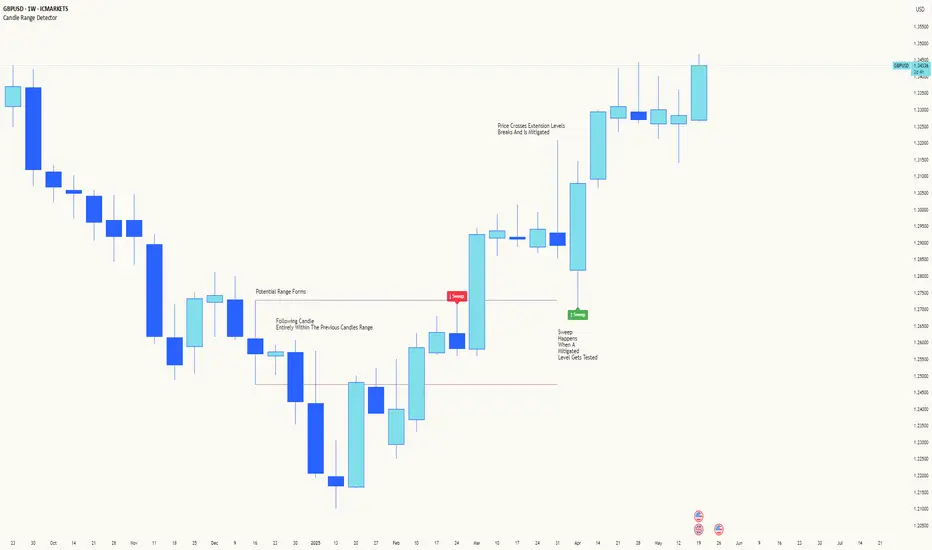
Candle Range DetectorCandle Range Detector
// Pine Script v6
// Detects candle-based ranges, mitigations, and sweeps with advanced logic
Overview
This indicator automatically detects price ranges based on candle containment, then tracks when those ranges are mitigated (broken) and when a sweep occurs. It is designed for traders who want to identify liquidity events and range breaks with precision.
How It Works
- Range Detection: A range is formed when a candle is fully contained within the previous candle (its high is lower and its low is higher). This marks a potential area of price balance or liquidity.
- Mitigation: A range is considered mitigated when price closes beyond its extension levels (configurable by normal or Fibonacci logic). This signals that the range has been invalidated or "taken out" by price action.
- Sweep Detection: After mitigation, the script watches for a sweep event: a candle that both trades through the range extreme and closes decisively beyond the log-mid of the candle itself. This is a strong sign of a liquidity grab or stop run.
- Alerts & Visuals: You can enable alerts and on-chart labels for sweeps. Only the most recent mitigated range can be swept, and each range can only be swept once.
- Timeframe Sensitivity: On weekly or monthly charts, a candle can both mitigate and sweep a range on the same bar. On lower timeframes, only one event can occur per bar.
Why It Works
- Candle containment is a robust way to identify natural price ranges and liquidity pools, as it reflects where price is consolidating or being absorbed.
- Mitigation marks the moment when a range is no longer defended, often leading to new directional moves.
- Sweeps are powerful signals of stop hunts or liquidity grabs, especially when confirmed by a close beyond the log-mid of the candle, indicating strong intent.
Visual Explanation
Tip: Use this tool to spot high-probability reversal or continuation zones, and to get alerted to key liquidity events in real time.
Peters Fibs IndicatorPeters Fibs Indicator helps you find great spots to enter trades, set stop-losses, and take profits using Fibonacci levels. It spots important price swings (highs and lows) and draws key levels on your chart to guide your trading decisions. Here's how it works in simple terms:
1-Finds Swings: It looks at recent price action to spot major highs ("H") and lows ("L") on your chart.
2-Draws Fibonacci Levels: Uses these swings to mark three key levels:
Entry (default at 61.8%): Where you might jump into a trade.
Stop-Loss (default at 79%): Where to cut losses if the trade goes wrong.
Take-Profit (default at 14.6% and -0.236) : Where to lock in profits.
3-Shows Trade Signals: Alerts you when the price hits the entry level, so you know it's time to act.
How to Tweak It for Different Timeframes
You can adjust the indicator to work for fast-paced or slower trading styles by changing a few settings:
*Fast Charts (e.g., 5-minute or 15-minute):
Swing Length: Set to 5-10 to catch quick price swings.
Minimum Bars Between Swings: Use 5-10 to allow swings close together.
*Slower Charts (e.g., 1-hour or 4-hour):
Swing Length: Bump up to 20-50 to focus on bigger, more important swings.
Minimum Bars Between Swings: Set to 15-30 to space out swings for clearer signals.
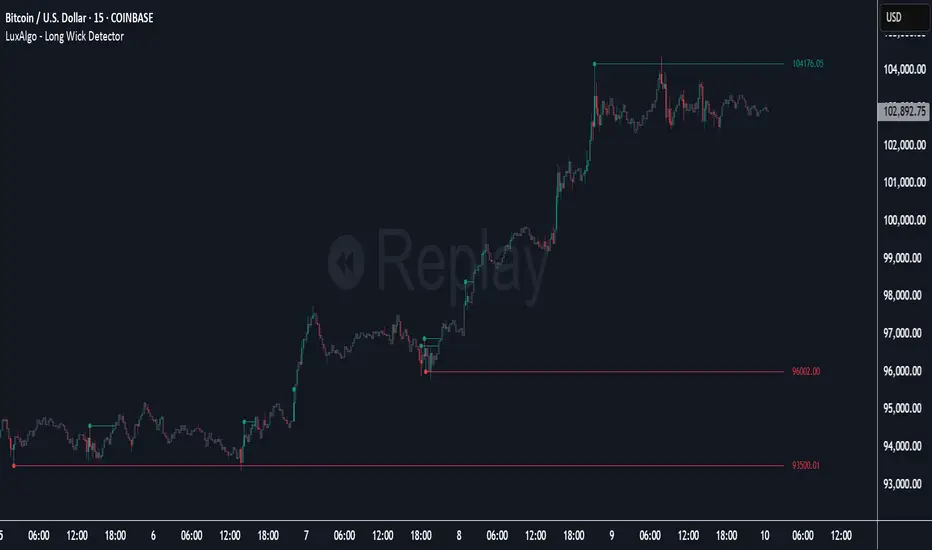
Long Wick Detector [LuxAlgo]The Long Wick Detector tool allows traders to identify candle wicks longer than a user-defined volatility threshold. This makes it useful for spotting zones with high supply or demand.
The tool displays mitigated and unmitigated levels and changes the color of the candles based on wick size and level breakouts.
🔶 USAGE
By default, the tool displays long mitigated and unmitigated candle wicks, with a maximum duration for an unmitigated long wick of 1,000 bars. What does all this mean?
🔹 Wick Threshold
Traders can adjust the volatility threshold to identify long wicks, with a higher threshold detecting more significant wicks.
As we can see in the image above, the tool detects more wicks with a smaller threshold compared to a higher one.
🔹 Level %
Traders can choose the percentage of the wick at which the level is located. By default, the level is displayed at the extremes of the wick. This parameter accepts values between 0 and 100.
100: extreme of the wick
50: middle of the wick
0: start of the wick
🔹 Max Duration
This parameter allows traders to specify the number of bars for the levels. The tool will only display mitigated or unmitigated levels up to the specified number of bars.
As shown in the above image, a longer duration allows more room for mitigation, displaying more levels.
🔹 Colored Candles
The tool allows for color customization using two parameters from the settings panel. The chart shows the different outputs.
The setting "Wick-Based Transparency" makes candles with smaller wicks less visible and candles with longer wicks more visible.
On the other hand, "Breakout-Based Color" changes the base color of the candles based on the mitigation of long wicks. When the price breaks above a detected top wick, the bullish color is used. When the price breaks below a detected bottom wick, the bearish color is used.
🔶 SETTINGS
Wick Threshold: The volatility threshold for wick detection. Use a smaller value to detect smaller wicks.
Level %: Placement of the plotted level relative to the wick.
Max Duration: The maximum duration in bars of mitigated wicks.
Mitigated Wicks: Enable or disable mitigated wicks.
🔹 Style
Wick Based Transparency: Make candles with smaller wicks more transparent and candles with longer wicks more solid.
Breakout Based Color: Change the base color based on wick mitigation.
Bullish & Bearish Colors
MetaPlanet USD Prices + Cheapest/Expensive SummaryThis custom TradingView indicator tracks and compares the real-time USD-equivalent prices of MetaPlanet Inc. (Ticker 3350) across three different global exchanges:
🇯🇵 TSE:3350 (Tokyo Stock Exchange, JPY)
🇩🇪 FWB:DN3 (Frankfurt/Xetra Exchange, EUR)
🇺🇸 OTC:MTPLF (US Over-the-Counter, USD)
It converts all prices into USD using live forex rates (USDJPY and EURUSD via OANDA) and plots them together for easy visual comparison.

10 Monday's 1H Avg Range + 30-Day Daily RangeWhat This Script Does
This indicator is designed for traders who want to monitor volatility and range behavior at the start of the trading week . It focuses specifically on the first four 15-minute candles of each Monday and tracks their combined high-low range over time.
How It Works
Monday 1H Range Detection:
Each week, it automatically detects and highlights the first 4 candles of Monday on a 15-minute chart (1 hour total). It calculates the range between the highest high and lowest low of these candles.
10-Week Average of Monday 1H Ranges:
It stores and averages the last 10 such ranges, displaying this average in a table for weekly comparison.
30-Day Daily Range Average:
Separately, it calculates the average daily range (high – low) of the last 30 daily candles. This value helps put the Monday 1H range into broader context and can guide Stop Loss or TP planning.
Dynamic Labeling & Visual Highlights:
The script visually highlights the first 4 candles of Monday and places a label showing the pip range once the 4 candles have completed. It also updates a small table with the two averages described above.
How to Use It
Use it on the 15-minute timeframe to activate the Monday 1H logic.
Compare the current week’s Monday range to the 10-week average to see if volatility is increasing or decreasing.
Use the 30-day daily range to determine if the Monday opening movement is unusually large or small.
Consider adjusting trade entries, stops, or targets if the Monday range is disproportionately large compared to recent historical behavior.
What Makes It Original?
This is not a typical volatility indicator like ATR or standard deviation. Instead, it’s a purpose-built tool combining:
Time-specific behavior (first hour of the week),
Historical contextualization (10-week average tracking),
A dual-timeframe analysis (15-min + daily),
A user-friendly table and visual interface.
This script helps intraday or swing traders spot abnormal volatility early in the week and adjust their strategies accordingly—especially in fast-moving Forex or Index markets.

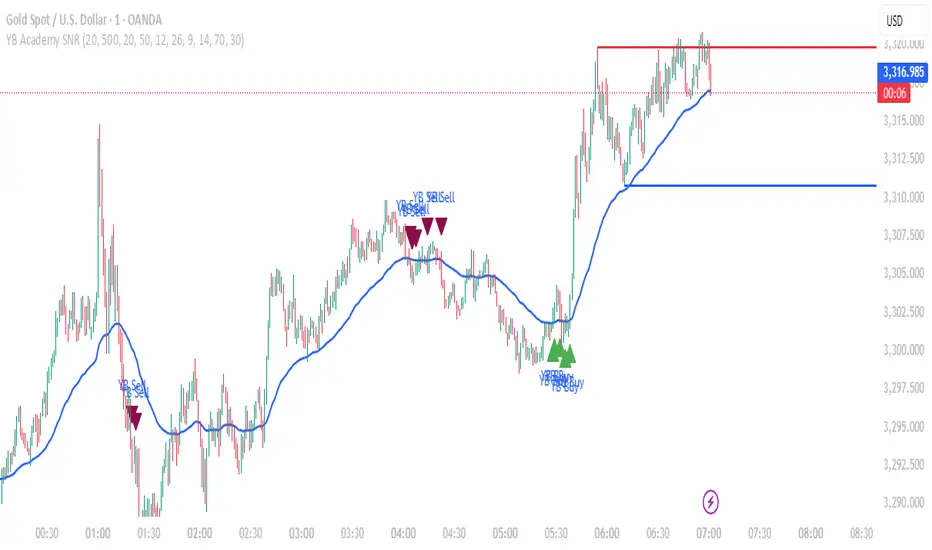
YB Academy SNRThe YB Academy SNR indicator is a complete swing-based Support & Resistance mapping tool with powerful built-in entry/exit signals. Designed for traders who want to identify high-probability reaction zones and get real-time alerts for the best buy and sell opportunities, this script helps you trade with structure, confidence, and discipline—on any time frame.
How It Works
1. Automatic Support & Resistance Detection
The indicator automatically scans for major swing highs and swing lows on your chart using a sensitivity parameter.
Every time a new swing high/low forms, a horizontal SNR line is drawn at that price level.
Both support and resistance lines automatically extend to the right of your chart, providing a persistent map of key levels for future entries and exits.
You can control how many recent zones are shown (max_snrs), keeping your chart clean and focused.
2. Smart Buy/Sell Signal Generation
Buy signals (“YB Buy”): Trigger when price touches or bounces off a support line, with trend/momentum/freshness filters:
Price is above the EMA50 (trend filter)
MACD is bullish (momentum)
RSI confirms no overbought
Sell signals (“YB Sell”): Trigger when price hits resistance, with strict confirmation:
Price is below EMA50
MACD is bearish
RSI not oversold
Both signals are shown as clear up/down triangle arrows directly on your chart.
3. Powerful Alerts
Never miss a trade: Real-time alerts fire as soon as a valid buy or sell condition appears.
Use with TradingView app, web, or SMS for 24/7 notification—no chart-watching needed.
4. Fully Customizable
Change sensitivity for tighter/looser SNR mapping.
Control the look and feel: colors for SNR, signals, number of zones, extension distance.
Works on any market: gold, forex, indices, crypto, stocks.
5. Clean Visuals, Zero Clutter
SNR lines are automatically managed—older zones are removed as new ones appear.
Only the latest/best buy/sell signals are shown, so you can act quickly and decisively.
Perfect For:
Scalpers, Day Traders, Swing Traders
Anyone who wants to trade using clean price action levels, NOT lagging indicators
Traders looking for rule-based, mechanical entries and exits
What Makes This Unique?
Precision: Uses swing structure, not arbitrary pivots or moving averages, for SNR.
Multi-Filter Entries: Combines trend, momentum, and overbought/oversold logic for high-probability signals.
Alerts & Automation: Built-in, with no need for manual chart watching.
Simple to Use: Add to any TradingView chart, adjust settings, and go.
Upgrade your trading with the YB Academy SNR!
Get alerted to the real opportunities—right at the key price zones, with all the discipline of a professional.
Open-Based Percentage Levelsv2
This is an updated version of my original script.
Changes:
I took off the displacement levels since there served no purpose on this script.
I also fixed it to where the percentage level lines are visible continually throughout the entire trading day. Old version had these lines disappearing.
I also updated the name to better reflect its purpose.
Now only works on 30 min and below as the higher time frames are meaningless. The older version allow higher time frames and the code is open source to adjust as desired

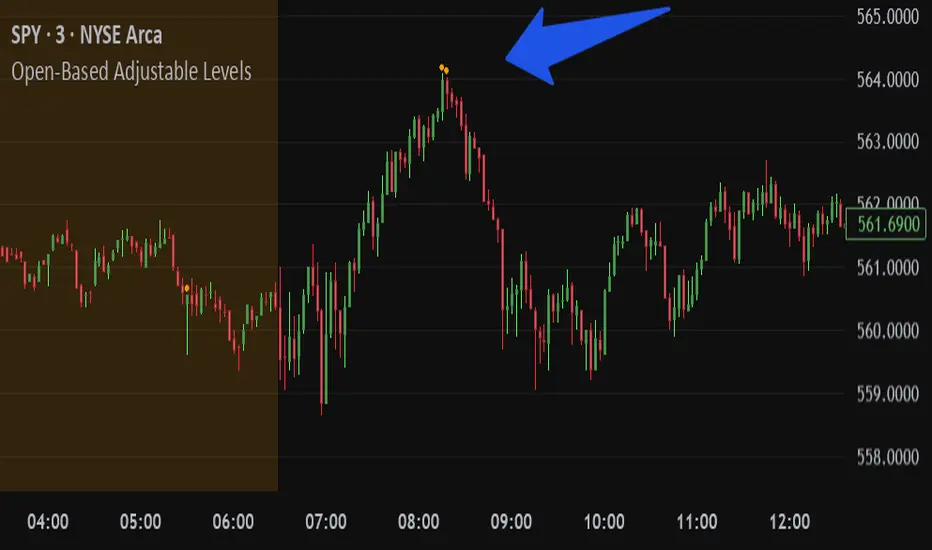
Open-Based Adjustable LevelsThis indicator gives signals for levels where the buy or sell volume is above adjustable levels (ex, volume at 100,000). And these levels will only signal after the price has gone above/below a certain 'adjustable' percentage of the stocks opening price.
Example: Signal sell when the price action is 0.7% above market opening price and when sell volume is above 120,000
or
Signal buy when buy volume is above 80,000 and the price is 0.5% below market opening price.
Great for day trading and detecting potential swings in the market. Above image is on a 3min chart.
Doesn't work as well on daily time frames or above.
Should be combined with other indicators like buy/sell channels, for the best confirmations