Buy Signal Above 1/3 Candle1 hr candle buy on engulfing candle, basically sends buy signals if 1hr candle closes above 1/3 of its size
Chart patterns

Gold Mini Strategy: EMA | RSI | MACD | VWAP | BB | PAGood Script to view all the important indicator into one

SY_Quant_AI_YJ✅ Improved and Compliant Description (for SY_Quant_AI_YJ)
Strategy Name: SY_Quant_AI_YJ
Type: Visual Trend System + MACD Cycle Filter + Smart Alerts
Status: Invite-Only / Visualization & Alerts Only (No order execution)
📌 Overview:
SY_Quant_AI_YJ is a trend-following visual strategy and alert system designed to help traders detect directional bias, time entries with MACD cross logic, and receive structured JSON-format push alerts. It combines Supertrend, EMA/SMA structures, and MACD cycles to build a coherent and actionable trend view, enhanced by visual stop-loss guidance and profit-taking alerts.
🔍 Core Logic:
This script integrates technical components into a multi-step trend confirmation framework:
Supertrend (ATR-based): Serves as the primary trend filter, reducing noise and false breakouts.
EMA-55, SMA-15, SMA-80: Help establish short- to mid-term trend structure.
MACD Cycle Crosses: Configurable for long, medium, or short cycles to adapt to different market phases.
Bar Coloring System: Highlights trend strength (e.g., green for strong bullish, red for bearish), assisting in quick decision-making.
Signal Confirmation: Entry signals (long/short) are confirmed by trend alignment, price structure, and MACD cycle phase.
⚙️ Default Settings:
Supertrend: ATR period 15, multiplier 3.1
MACD Mode: Selectable via dropdown (Long, Medium, Short Cycle)
Stop-Loss Logic: Automatically tied to Supertrend value at entry bar
Signal Filtering: Consecutive same-direction entries are blocked to avoid redundancy
No trading simulation: Entries and exits are visual only; alerts replace real trade execution
📈 Usage:
Long/Short signals are displayed using labelup / labeldown markers (“做多” / “做空”)
JSON-format alerts are triggered for:
✅ Entry zones (including stop-loss and entry range)
✅ Profit-taking when MACD reverses and position is floating in profit
Stop-loss guide lines plotted dynamically during active positions
Suitable for use on 15-minute to 4-hour charts
⚠️ Disclaimer:
This strategy does not simulate or execute trades. It is designed for monitoring and decision support only. All signals are informational and should be used alongside proper risk management and independent analysis. Past visual or alert performance does not guarantee future results.
🔑 Access:
To gain access to this invite-only script, please send a private message or contact us via the designated link. Access is reviewed and granted manually per user request.

IFVG PD BETA 3The IFVG PD (Inverted Fair Value Gap Pro Dashboard) indicator detects inverted fair value gaps based on price inefficiencies. It helps traders identify potential entry zones by visualizing key imbalance areas across timeframes. Ideal for SMC strategies.

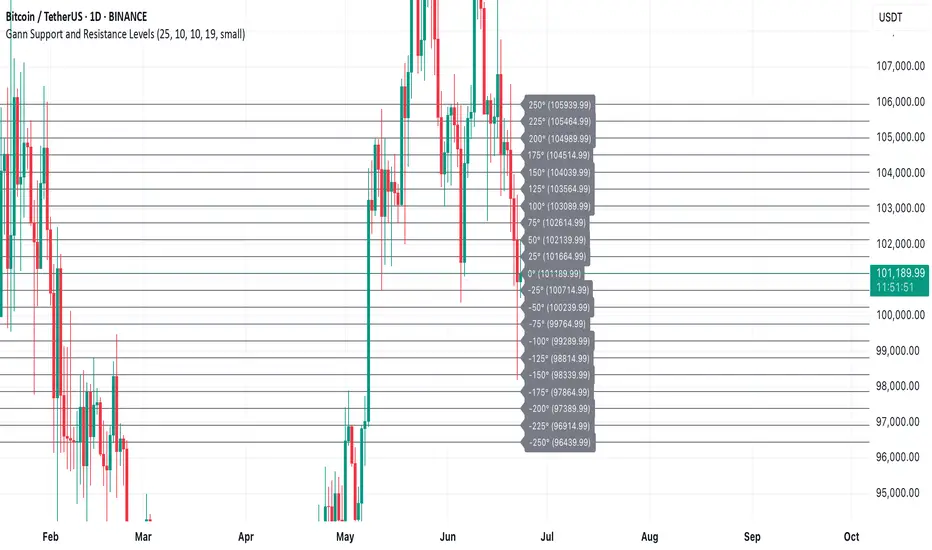
Gann Support and Resistance LevelsThis indicator plots dynamic Gann Degree Levels as potential support and resistance zones around the current market price. You can fully customize the Gann degree step (e.g., 45°, 30°, 90°), the number of levels above and below the price, and the price movement per degree to fine-tune the levels to your strategy.
Key Features:
✅ Dynamic levels update automatically with the live price
✅ Adjustable degree intervals (Gann steps)
✅ User control over how many levels to display above and below
✅ Fully customizable label size, label color, and text color for mobile-friendly visibility
✅ Clean visual design for easy chart analysis
How to Use:
Gann levels can act as potential support and resistance zones.
Watch for price reactions at major degrees like 0°, 90°, 180°, and 270°.
Can be combined with other technical tools like price action, trendlines, or Gann fans for deeper analysis.
📌 This tool is perfect for traders using Gann theory, grid-based strategies, or those looking to enhance their visual trading setups with structured levels.
SY_Quant_AI_Trend.1.0✅ Improved and Compliant Description (for SY_Quant_AI_Trend)
Strategy Name: SY_Quant_AI_Trend
Type: Visual Trend Detection & Signal Confirmation System
Status: Invite-Only / Visualization-Only (no trading logic enabled)
📌 Overview:
SY_Quant_AI_Trend is a multi-layered trend detection strategy that visually identifies market direction using a combination of Supertrend, multi-period Exponential Moving Averages (EMAs), and MACD cycle filters. It is designed to assist traders in recognizing key trend phases, potential reversals, and zones of interest for possible entries and exits.
🔍 Core Logic:
This script integrates multiple indicators into a coherent trend analysis framework:
Supertrend is used as the backbone for trend confirmation, smoothing volatility and filtering false breakouts.
EMA structure (e.g. 20, 34, 55) helps identify the momentum and directional bias.
MACD cycles are used to time potential swing entries within broader trends.
Stop-loss guide lines (not orders) are plotted based on recent price structure to help users visualize risk zones.
By combining these elements, the strategy aims to reduce noise and highlight higher-probability directional moves.
⚙️ Default Settings:
Supertrend length: 10–15 for trend clarity without excessive lag
EMAs: Tuned to reflect short-to-mid-term market structure
MACD smoothing: Adjusted to filter choppy signals in low volatility phases
No trades are executed – this script is for visual support and alerts only.
📈 Usage:
The script provides visual trend bias, potential entry zones, and risk references.
Designed for use on 15M–4H timeframes, but flexible across other periods.
Suitable for trend-following, momentum, and pullback traders.
⚠️ Disclaimer:
This script is for educational and informational purposes only. It does not execute or simulate trades. Users must perform their own analysis and apply proper risk management when making trading decisions. Past performance or signal visualization does not guarantee future results.
🔑 Access:
To obtain access to this invite-only script, please send a private message or contact us through our provided link. Access is granted on a per-user basis.

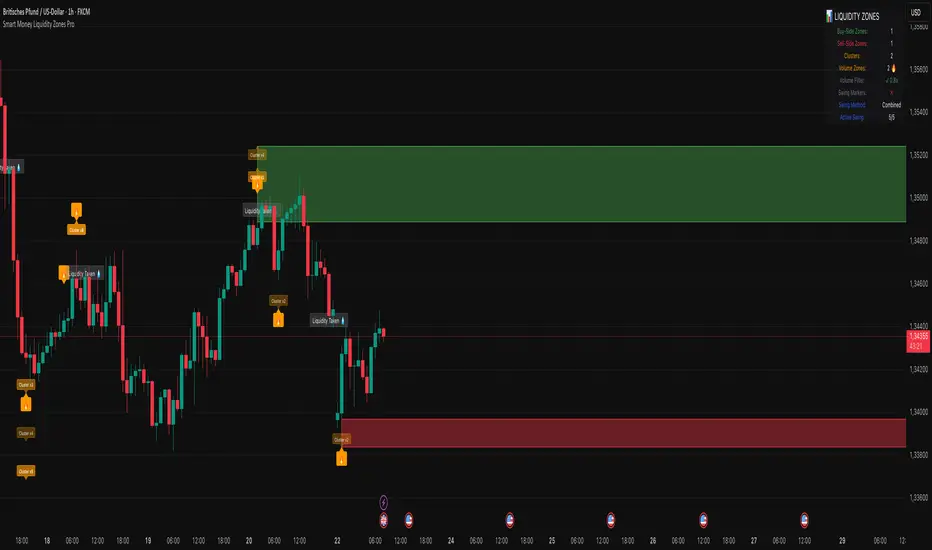
Smart Money Liquidity Zones ProThe Smart Money Liquidity Zones Pro indicator identifies and visualizes key liquidity areas in the market where institutional traders (smart money) are likely to have placed their stop-loss orders. These zones represent areas of high liquidity that often act as magnets for price, making them valuable reference points for trading decisions.
What the Indicator Does
Core Functionality
Swing Point Detection: The indicator identifies significant swing highs and lows using three different methods (Classic, Fractal, or Combined) to locate potential liquidity pools.
Liquidity Zone Creation: At each valid swing point, the indicator creates a horizontal zone representing an area where stop-loss orders are likely clustered.
Zone Clustering: When multiple swing points occur near the same price level, the indicator intelligently combines them into larger cluster zones, indicating stronger liquidity areas.
Volume Confirmation: The indicator can filter zones based on volume, showing only those swing points that occurred with significant trading volume.
Zone Break Detection: When price closes through a liquidity zone, the indicator marks it as "Liquidity Taken" and removes the zone from the chart.
Zone Types
Buy-Side Liquidity Zones (Green): Created at swing highs where short sellers' stop-losses are likely placed
Sell-Side Liquidity Zones (Red): Created at swing lows where long traders' stop-losses are likely placed
Trading Strategies
Basic Concepts
Liquidity Runs: Price often moves toward these zones to trigger stop-loss orders before reversing. This creates trading opportunities.
Support and Resistance: Unbroken liquidity zones can act as support (sell-side) or resistance (buy-side) levels.
Breakout Confirmation: When price breaks through a zone with strong momentum, it often continues in that direction.
Entry Strategies
Strategy 1: Liquidity Grab Reversa l
Wait for price to spike into a liquidity zone
Look for rejection candles (wicks) at the zone
Enter in the opposite direction after confirmation
Place stop-loss beyond the liquidity zone
Strategy 2: Zone Break Continuation
Wait for price to close decisively through a zone
Enter on the retest of the broken zone
Target the next liquidity zone in the direction of the break
Strategy 3: Zone Clustering Trade
Focus on areas with multiple overlapping zones (clusters)
These areas offer higher probability setups
Trade bounces from cluster zones with tighter risk management
Risk Management
Always use stop-losses beyond the liquidity zones
Consider the overall market context and trend
Zones on higher timeframes are generally more significant
Volume-confirmed zones have higher reliability
Settings Explanation
Swing Detection Settings
Swing Strength (Lookback Bars)
Determines how many bars to look back for swing point validation
Higher values find more significant swings but fewer zones
Recommended settings:
1m-5m charts: 3-5
15m-1h charts: 5-8
Daily charts: 5-10
Weekly charts: 3-5
Monthly charts: 2-3
Adaptive Swing Detection
Automatically adjusts swing detection based on available historical data
Prevents errors when there's limited chart history
Recommended to keep enabled
Minimum Bars for Swing
Sets the absolute minimum bars required for swing detection
Lower values allow detection in limited data conditions
Swing Detection Method
Classic: Strict price comparison for pure swing highs/lows
Fractal: Williams Fractal pattern (2 bars on each side)
Combined: Uses both methods for maximum zone detection
Auto-Adjust for Timeframe
Automatically optimizes settings based on chart timeframe
Prevents inappropriate settings on higher timeframes
Zone Settings
Max Number of Visible Zones
Limits the number of zones displayed to prevent chart clutter
Older zones are automatically removed
Max Zone Duration (Bars)
Zones older than this are automatically deleted
Keeps the chart focused on recent liquidity areas
Enable Zone Clustering
Groups nearby zones into larger clusters
Identifies stronger liquidity areas
Cluster Threshold (%)
Maximum price distance for zones to be clustered
Lower values create tighter clusters
Show Cluster Labels
Displays "Cluster x2", "Cluster x3" etc. on grouped zones
Volume Filter Settings
Enable Volume Filter
When enabled, only creates zones at high-volume swing points
Increases zone quality but reduces quantity
Volume Multiplier
Multiplier for average volume to determine "high volume"
Lower values (0.7-0.9) create more zones
Higher values (1.2+) create fewer, higher-quality zones
Volume SMA Period
Period for calculating average volume
Higher values create smoother volume baseline
Show Volume Confirmation Icon
Displays a fire emoji on volume-confirmed zones
Volume Visualization Settings
Show Volume Dots
Displays dots below high-volume bars
Dynamic Zone Colors
Volume-confirmed zones appear with more intense colors
Show Volume Background
Highlights the chart background on high-volume bars
Visual Settings
Buy-Side/Sell-Side Zone Colors
Customize colors for long and short liquidity zones
Border Width
Thickness of zone borders (1-3)
Show 'Liquidity Taken' Labels
Displays labels when zones are broken
Label Size
Size of the liquidity taken labels
Show Swing Point Markers
Displays triangles at detected swing points
Show Debug Info
Shows diagnostic information for troubleshooting
Dashboard Settings
Show Dashboard
Toggles the information panel display
Dashboard Position
Choose from 6 positions on the chart
Background Color
Dashboard background color
Text Color
Dashboard text color
Text Size
Dashboard text size (tiny/small/normal/large)
Tips for Effective Use
Start with default settings and adjust based on your trading style and timeframe
Use multiple timeframes to identify confluence between zones on different scales
Combine with other indicators like trend analysis or momentum oscillators
Pay attention to clusters as they represent stronger liquidity areas
Monitor volume-confirmed zones for higher probability setups
Adjust zone duration based on your trading timeframe (shorter for scalping, longer for swing trading)
Use the debug feature if zones aren't appearing to understand why
Keep the chart clean by limiting the number of visible zones
Common Issues and Solutions
No zones appearing:
Lower the Swing Strength setting
Switch to Combined detection method
Disable volume filter if active
Check if there's enough historical data
Too many zones:
Increase Swing Strength
Enable volume filter
Reduce Max Number of Visible Zones
Increase Cluster Threshold
Zones disappearing too quickly:
Increase Max Zone Duration
Check if zones are being broken by price
Poor performance on higher timeframes:
Enable Auto-Adjust for Timeframe
Use appropriate Swing Strength for the timeframe
Consider using Classic method instead of Fractal
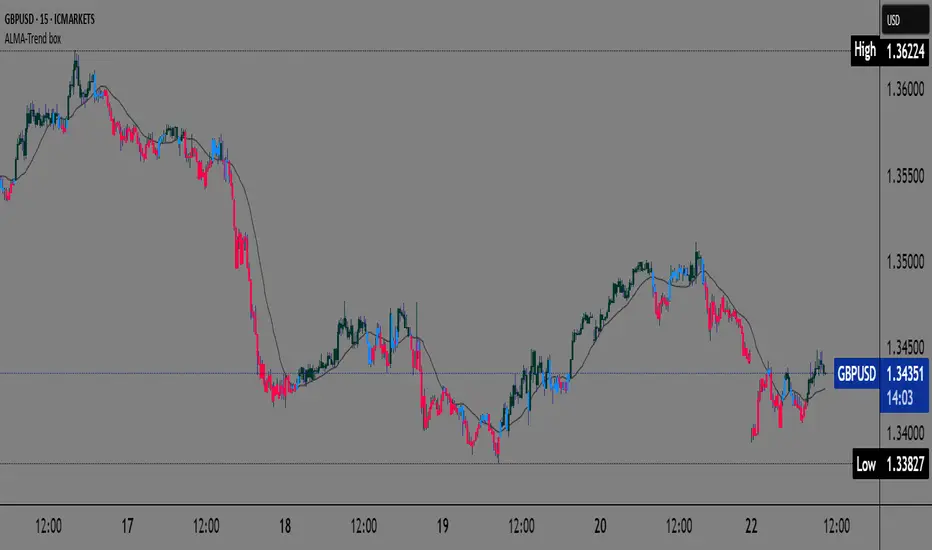
ALMA Trend-boxALMA Trend-box — an innovative indicator for detecting trend and consolidation based on the ALMA moving average
This indicator combines the Adaptive Laguerre Moving Average (ALMA) with unique visual representations of trend and consolidation zones, providing traders with clearer and deeper insight into current market conditions.
Originality and Usefulness
Unlike classic indicators based on simple moving averages, ALMA uses a Gaussian weighting function and an offset parameter to reduce lag, resulting in smoother and more accurate trend signals. This indicator not only plots the ALMA but also analyzes the slope angle of the ALMA line, combining it with the price’s position relative to the moving average to identify three key market states:
Uptrend (bullish): when the ALMA slope angle is above a defined threshold and the price is above ALMA,
Downtrend (bearish): when the slope angle is below a negative threshold and the price is below ALMA,
Consolidation or sideways trend: when neither of the above conditions is met.
A special contribution is the automatic identification of consolidation zones (periods of weak trend or transition between bullish and bearish phases), visually represented by blue-colored candlesticks on the chart. This feature can help traders better recognize moments when the market is indecisive and adjust their strategies accordingly.
How the Indicator Works
ALMA is calculated using user-defined parameters — length, offset, and sigma — which can be adjusted for different timeframes and instruments.
The slope angle of the ALMA line is calculated based on the difference between the current and previous ALMA values, converted into degrees.
Based on the slope angle and the relative price position to ALMA, the indicator determines the trend type and changes the candle colors accordingly:
Green for bullish (uptrend),
Red for bearish (downtrend),
Blue for sideways trend (consolidation).
When the slope angle falls within a certain range and the price behavior contradicts the trend, the indicator detects consolidation and displays it graphically through semi-transparent boxes and background color.
How to Use This Indicator
Use candle colors for quick identification of the current trend and potential trend reversals.
Pay attention to consolidation zones marked by boxes (blue candles), as these are potential signals for trend breaks or preparation for stronger price moves.
ALMA parameters can be adjusted depending on the timeframe and market volatility, providing flexibility in analysis.
The indicator is useful for both short-term scalping strategies and longer-term trend monitoring and position management.
Why This Indicator is Useful
Many existing trend indicators do not consider the slope angle of the moving average as a quantitative measure of trend strength, nor do they automatically detect consolidations as separate zones. ALMA Trend-box fills this gap by combining sophisticated mathematical processing with simple and intuitive visual representation. This way, users get a tool that helps make decisions based on more objective criteria of trend and consolidation rather than just price location relative to averages.
Devils MarkThe Devil’s Mark Indicator identifies bullish or bearish candlesticks with no opposing wick, plotting a horizontal line at the open/low (bullish) or open/high (bearish) price to mark the inefficiency.
This line highlights the level where price is expected to retrace to form the missing wick, serving as a visual cue.
The line is automatically removed from the chart once price crosses it, confirming the inefficiency has been rebalanced.

80% Rule Indicator (ETH Session + SVP Prior Session)I created this script to show the 80% opportunity on chart if setting lines up.
"80% rule: Open outside the vah or Val. Spend 30 mins outside there then break back inside spend 15 mins below or above depending which way u broke. Then come back and retest the vah/val and take it to the poc as a first target with the final target being the other Val/vah "
📌 Script Summary
The "80% Rule Indicator (ETH Session + SVP Prior Session)" overlays your chart with prior session value area levels (VAH, VAL, and POC) calculated from extended-hours 30-minute data. It tracks when the price reenters the value area and confirms 80% Rule setups during your chosen trading session. You can optionally trigger alerts, show/hide market sessions, and fine-tune line appearance for a clean, modular workflow.
⚙️ Options & Settings Breakdown
- Use 24-Hour Session (All Markets)
When checked, the indicator ignores time zones and tracks signals during a full 24-hour period (0000-0000), helpful if you're outside U.S. trading hours or want consistent behavior globally.
- Market Session
Dropdown to select one of three key market zones:
- New York (09:30–16:00 ET)
- London (08:00–16:30 local)
- Tokyo (09:00–15:00 local)
Used to gate entry signals during relevant hours unless you choose the 24-hour option.
- Show PD VAH/VAL/POC Lines
Toggle to show or hide prior day’s levels (based on the 30-min extended session). Turning this off removes both the lines and their white text labels.
- Extend Lines Right
When enabled, the VAH/VAL/POC lines extend into the current day’s session. If disabled, they appear only at their anchor point.
- Highlight Selected Session
Adds a soft blue background to help visualize the active session you selected.
- Enable Alert Conditions
Allows TradingView alerts to be created for long/short 80% Rule entries.
- Enable Audible Alerts
Plays an in-chart sound with a popup message (“80% Rule LONG” or “SHORT”) when signals trigger. Requires the chart to be active and sounds enabled in TradingView.

Scanner Candles v2.01The "Scanner Candle v.2.01" is an indicator classifies candles based on the body/range ratio: indecisive (small body, ≤50%), decisive (medium body), explosive (large body, ≥70%). It includes EMAs to identify trends and "Reset Candles" (RC), small-bodied candles near EMAs, signaling potential reversals or continuations. Useful for analyzing volatility, breakouts, reversals, and risk management.
Description of the indicator:
The "Scanner Candle v.2.01" indicator classifies candles into three categories based on the proportion of the candle's body to its range (high-low):
Indecisive: candles with a small body (≤ set threshold, default 50%), indicating low volatility or market uncertainty.
Decisive: candles with a medium body, reflecting a clear but not extreme price movement.
Explosive: candles with a large body (≥ set threshold, default 70%), signaling strong directional moves.
Additionally, the indicator includes:
Customizable exponential moving averages (EMAs) to identify trends and support/resistance levels.
Detection of "Reset Candles" (RC), specific candles (e.g., dojis, ) with a small bodies body near EMAs, useful for identifying potential reversal or continuation points.
Coloring and visualization:
Candles are colored by category (white for indecisive, orange for decisive, purple for explosive).
Reset Candles are marked with circles above/below the candle (green for bullish, red for bearish).
Potential uses:
Volatility analysis: Identifying uncertain (indecisive), directional (decisive), or impulsive (explosive) market phases.
Breakout trading: Explosive candles can signal entry opportunities on strong moves.
Reversal detection: Reset Candles near EMAs can indicate turning points or trend continuation.
Trend-following support: Integrated EMAs contextualize candles within the main trend.
Risk management: Indecisive candles suggest avoiding trades in low-directionality phases.
The indicator is customizable (thresholds, colors, thresholdsEMAs, ) and adaptable to various timeframes and strategies, from day trading to swing trading.
Reset Candles:
Reset Candles (RC) are specific candles signaling potential reversals or continuations, often near EMAs. They are defined by:
Small body: Body < 5% of the range of the last 10 candles, indicating low volatility (e.g., doji).
EMA proximity: The candle is near or crosses a defined EMA (e.g., 10, 60, or 223 periods).
Trend conditions: Follows a red candle, with the close of the previous previous candles above a specific EMA, suggesting a potential bullish resumption or stabilization.
Limited spike: The candle has minimal tails (spikes, ) below a set threshold (default 1%).
Minimum timeframe: Appears on timeframes ≥ set value (default 5 minutes) or daily charts.
Non-consecutive: Not preceded by other RCs in the last 3 candles.
Types:
Doji_fin: Green circle above, signaling a bullish bullish setup near longer EMAs.
Dojifin_2: Yellow Red circle below, signaling a bearish setup near shorter EMAs.
Trading uses:
Reversal: RCs near EMAs signal bounces or rejections, ideal for counter-trend trades.
Continuation: In trends, RCs indicate pauses before trend resumption, offering low-risk entries.
Support/resistance confirmation: EMA proximity strengthens the level's significance.
Risk management: Small bodies and EMA proximity allow tight stop-losses.
Limitations:
False signals: Common in volatile or sideways markets; use with additional confirmation.
Timeframe dependency: More reliable on higher timeframes (e.g., 1-hour or daily).
Customization needed: Thresholds (e.g., spike, timeframe) must be tailored to the market.
Conclusion:
Reset Candles highlight low-volatility moments near technical levels (EMAs) that may precede significant moves. They are ideal for precise entries with tight stops in reversal or continuation strategies but require clear market context and additional confirmation for optimal effectiveness.
#ema #candlepattern #scalping

BeeQuant - Hive Visualizer💠 OVERVIEW
The " Hive Visualizer " is a game-changing, invite-only tool, expertly designed to give every trader, from beginner to experienced, instant and clear visual clues about what price is doing. Its main job is to easily show you the highest and lowest points price has reached recently. Think of it as a smart, automated helper that colors your candles to reveal powerful market moves. This helps you quickly see if prices are getting stronger or weaker right on your chart. It's a groundbreaking, high-quality tool that cuts through the noise, making it simple to spot key moments when the market is about to make a big move up or down, giving you an edge.
__________________________________________________________________________
🧠 CONCEPTS
The core philosophy behind Hive Visualizer is rooted in contextual volatility exposure and directional bias reinforcement. Through a sophisticated internal mechanism that evaluates local maxima/minima behavior within a compact temporal field, the indicator provides adaptive color‑based candle transitions that align with latent directional pressure.
1. Uses localized equilibrium breach detection to monitor directional intent and exhaustion points.
2. Embeds a dynamically updating framework that reacts to both trend continuation and structural reversals.
3. Avoids false positives by disregarding noisy fluctuations below system‑defined relevance thresholds.
4. Provides non‑repainting, fully forward‑confirmed visual outputs for reliable retrospective analysis.
Hive Visualizer is not designed to be predictive. Instead, it allows traders to observe the evolution of price structure in a cleaner and more digestible format, supporting high-confidence discretionary execution or automated model overlays.
__________________________________________________________________________
✨ FEATURES
The "Hive Visualizer" comes with a suite of smart features, all designed for amazing clarity, quick reactions, and deeper understanding, making your charting experience truly effortless:
🔹 Easy Range Customization
A super easy "Smoother" setting lets you perfectly adjust how the indicator reacts to recent price changes. This means you can fine-tune it to match exactly how you like to trade
🔹 Instant, Clear Signals
The simple Green and Red candles give you immediate, unmistakable visual cues about strong upward or downward moves, providing insights you can grasp in a heartbeat.
🔹 Smart Continuity in Quiet Times
The clever way it keeps the same color for candles that aren't breaking out offers valuable, subtle insights into those periods when the market is just moving sideways or finding its balance, helping you see the hidden dynamics.
🔹 Seamless Chart Integration
This indicator works like a transparent overlay, appearing directly on your price chart without getting in the way or changing your original candles. It fits perfectly, making your analysis smooth and uninterrupted.
🔹 Clean and Focused Visuals
The indicator’s simple design focuses only on coloring the main candle body and border to clearly highlight important breakouts. This keeps your chart clean and effective, showing you only what truly matters.
🔹 Cross-Market Versatility
This indicator is engineered to perform with precision across all major markets—whether you're trading forex, commodities, stocks, or indices. Its adaptive logic automatically aligns with the unique volatility and structure of each asset class, delivering consistently reliable insights no matter where you trade.
__________________________________________________________________________
⚙️ USAGE
Using and making the "Hive Visualizer" a part of your trading routine is incredibly simple and designed to significantly boost how you understand the market:
Getting Started: Once you have access, just add the "Hive Visualizer" indicator to any chart and timeframe you want on TradingView. It's that easy.
Tuning the "Smoother" Setting: Go into the indicator's settings and play with the "Smoother" number. This is a crucial step to make it react just right for you.
Smaller numbers (like 1-3 bars) will make the indicator very quick to react to the most recent, short-term ups and downs, perfect for fast trading.
Larger numbers (like 5-10+ bars) will give you a wider view, smoothing out small changes and highlighting bigger, more important breakouts, ideal for longer-term analysis. Spend a little time trying different settings to find what works best for your chosen asset and your trading style – it's like finding the perfect lens for your market view.
Understanding the Colors: Once you've set it up, here's how to quickly understand what the "Hive Visualizer" is telling you: New Green Candle: This means a strong sign that buyers are in control and prices are likely to keep moving up, giving you confidence in bullish moves.
New Red Candle: This indicates as a strong signal that sellers are dominating and prices are likely to keep moving down, preparing you for bearish shifts.
__________________________________________________________________________
⚠️ LIMITATIONS
👉 Visual Guide, Not a Bot: Use as part of a broader strategy—it won’t auto‑trade for you
👉 Retroactive Insight: It reflects past price action; it doesn’t predict the future.
👉 Setting‑Dependent: Effectiveness relies on your “Smoother” choice—too low = noise; too high = lag.
👉 Price‑Range Focused: Highlights trends and range only — doesn’t analyze volume, news, or other complex factors.
👉 This tool enhances trend validation but isn’t a standalone signal generator.
█ ▒▒▒▒▒▒▒▒▒▒▒▒▒▒▒▒▒▒▒▒▒▒▒ 『•••• ✎ ••••』 ▒▒▒▒▒▒▒▒▒▒▒▒▒▒▒▒▒▒▒▒▒▒▒▒ █
🎯 CONCLUSION
The "Hive Visualizer" offers an incredibly easy-to-use and adaptable way to see price strength and weakness with crystal clarity on your charts. By giving you instant, clear feedback on whether prices are powerfully breaking out or falling below a recent historical range, it truly empowers you to quickly understand market momentum and spot key turning points. Seamlessly add this smart visual tool into your current trading methods to gain a sharper, more insightful view, and elevate your trading decisions. It's about seeing the market with new eyes.
▣▣▣▣▣▣▣▣▣▣▣▣▣▣▣▣▣▣▣▣▣▣▣▣▣▣▣▣▣▣▣▣▣▣▣▣▣▣▣▣▣▣▣▣▣▣▣▣▣▣▣
🚨 RISK DISCLAIMER
Engagement in financial market speculation inherently carries a substantial degree of inherent risk, and the potential for capital diminution, potentially exceeding initial deposits, is a pervasive and non-trivial consideration. All content, algorithmic tools, scripts, articles, and educational materials disseminated by "Hive Visualizer" are exclusively purposed for informational and pedagogical objectives, strictly for reference. Historical performance data, whether explicitly demonstrated or implicitly suggested, offers no infallible assurance or guarantee of future outcomes. Users bear sole and ultimate accountability for their individual trading decisions and are emphatically urged to meticulously assess their financial disposition, risk tolerance parameters, and conduct independent due diligence prior to engaging in any speculative market activity.

LilSpecCodes1. Killzone Background Highlighting:
It highlights 4 key market sessions:
Killzone Time (EST) Color
Silver Bullet 9:30 AM – 12:00 PM Light Blue
London Killzone 2:00 AM – 5:00 AM Light Green
NY PM Killzone 1:30 PM – 4:00 PM Light Purple
Asia Open 7:00 PM – 11:00 PM Light Red
These are meant to help you focus during high-probability trading times.
__________________________________________________
2. Previous Day High/Low (PDH/PDL):
Plots green line = PDH
Plots red line = PDL
Tracks the current day’s session high/low and sets it as PDH/PDL on a new trading day
CHANGES WITH ETH/RTH
3. Inside Bar Marker:
Plots a small black triangle under bars where the high is lower than the previous bar’s high and the low is higher than the previous bar’s low (inside bars)
Useful for spotting potential breakout or continuation setups
4. Vertical Time Markers (White Dashed Lines)
Time (EST) Label
4:00 AM End of London Silver Bullet
9:30 AM NYSE Open
10:00 AM Start of NY Silver Bullet
11:00 AM End of NY Silver Bullet
11:30 AM (Customizable Input)
3:00 PM PM Killzone Ends
3:15 PM Futures Market Close
7:15 PM Asia Session Watch

Breakout Confirmation🔍 Indicator Name: Breakout Confirmation (Body + Volume)
📌 Purpose:
This indicator is designed to detect high-probability breakout setups based on price structure and volume strength. It identifies moments when the market breaks through a key support or resistance level, confirmed by two consecutive strong candles with large real bodies and high volume.
⚙️ How It Works
1. Support and Resistance Detection
The indicator uses pivot points to identify potential horizontal support and resistance levels.
A pivot high or pivot low is considered valid if it stands out over a configurable number of candles (default: 50).
Only the most recent valid support and resistance levels are tracked and displayed as horizontal lines on the chart.
2. Breakout Setup
The breakout condition is defined as:
First Candle (Breakout Candle):
Large body (compared to the recent body average)
High volume (compared to the recent volume average)
Must close beyond a resistance or support level:
Close above resistance (bullish breakout)
Close below support (bearish breakout)
Second Candle (Confirmation Candle):
Also must have a large body and high volume
Must continue in the direction of the breakout (i.e., higher close in bullish breakouts, lower close in bearish ones)
3. Signal Plotting
If both candles meet the criteria, the indicator plots:
A green triangle below the candle for bullish breakouts
A red triangle above the candle for bearish breakouts
📈 How to Interpret the Signals
✅ Green triangle below a candle:
Indicates a confirmed bullish breakout.
The price has closed above a recent resistance level with strength.
The trend may continue higher — possible entry for long positions.
🔻 Red triangle above a candle:
Indicates a confirmed bearish breakout.
The price has closed below a recent support level with strength.
Potential signal to enter short or exit long positions.
⚠️ The plotted horizontal lines show the last key support and resistance levels. These are the zones being monitored for breakouts.
📊 How to Use It
Timeframe: Works best on higher timeframes (1H, 4H, Daily), but can be tested on any chart.
Entry: Consider entries after the second candle confirms the breakout.
Stop Loss:
For longs: Below the breakout candle or the broken resistance
For shorts: Above the breakout candle or broken support
Take Profit:
Based on previous structure, risk:reward ratios, or using trailing stops.
Filter with Trend or Other Indicators (optional):
You can combine this with moving averages, RSI, or market structure for confluence.
🛠️ Customization Parameters
lengthSR: How many candles to look back for identifying support/resistance pivots.
volLength: Length of the moving average for volume and body size comparison.
bodyMultiplier: Multiplier threshold to define a “large” body.
volMultiplier: Multiplier threshold to define “high” volume.
✅ Ideal For:
Price action traders
Breakout traders
Traders who use volume analysis
Anyone looking to automate the detection of breakout + confirmation setups

FVG fill with immediate rebalance [LuciTech]The "FVG fill with immediate rebalance AKA Golden Arrow" indicator is designed to identify Fair Value Gaps (FVGs) and detect immediate rebalances to highlight potential trading opportunities. It uses colored boxes to mark FVGs and triangular markers to signal bullish or bearish setups, helping traders pinpoint key price levels where imbalances occur and price reactions are likely.
Key Features
FVG Detection: Spots bullish and bearish Fair Value Gaps based on price action, with customizable width settings.
Golden Arrow Signals: Displays triangular markers when price fills an FVG and immediately rebalances, indicating potential reversal or continuation zones.
Customizable Colors: Bullish FVGs appear in green and bearish FVGs in red by default, with options to tweak colors in the settings.
Time Filter: Allows signals to be restricted to a specific time window, highlighted by a background fill for clarity.
Alert System: Supports TradingView alerts for "Bullish Golden Arrow" and "Bearish Golden Arrow" signals to keep traders updated on setups.
How It Works
FVG Calculation: Analyzes gaps between candles to identify FVGs, with user-defined minimum width options (points, percentages, or ATR-based).
Signal Generation: Triggers a Golden Arrow signal when price fills the FVG and rebalances immediately, based on wick penetration and closing conditions.
Visual Aids:
Bullish FVGs are shown as green boxes, bearish FVGs as red boxes.
Upward triangles mark bullish signals, downward triangles mark bearish signals.
Time-Based Filtering: Optionally limits signals to specific hours, with a background fill showing the active period.

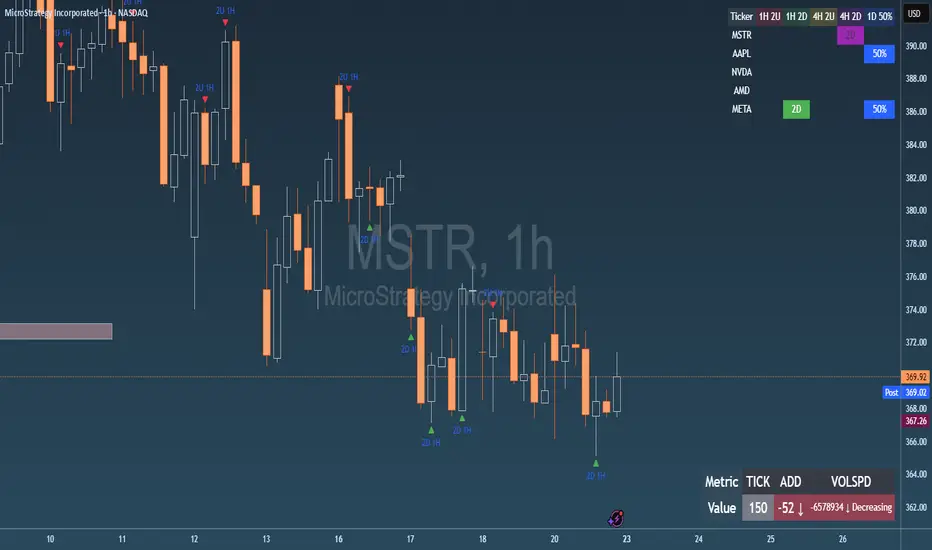
Failed 2U/2D + 50% Retrace Scanner📈 Multi-Ticker Failed 2U/2D Scanner with Daily Retrace & Market Breadth Table
This TradingView indicator is a multi-symbol price action scanner designed to catch high-probability reversal signals using The Strat’s failed 2U/2D patterns and daily 50% retrace logic, while also displaying market breadth metrics ( USI:TICK and USI:ADD ) for context.
Monitored Symbols:
SPY, SPX, QQQ, IWM, NVDA, AMD, AAPL, META, MSTR
🔍 Detection Logic
1. Failed 2U / Failed 2D Setups
Failed 2U: Price breaks above the previous candle’s high but closes back below the open → Bearish reversal
Failed 2D: Price breaks below the previous candle’s low but closes back above the open → Bullish reversal
Timeframes Monitored:
🕐 1-Hour (1H)
⏰ 4-Hour (4H)
2. Daily 50% Candle Retrace
Checks if price has retraced 50% or more of the previous day’s candle body
Highlights potential trend exhaustion or reversal confluence
3. Market Breadth Metrics (Display Only)
USI:TICK : Measures real-time NYSE up vs. down ticks
USI:ADD : Advance-Decline Line (net advancing stocks)
Not used in signal logic — just displayed in the table for overall market context
🖼️ Visual Elements
✅ Chart Markers
🔺 Red/Green Arrows for 1H Failed 2U/2D
🟨 Yellow Squares for 4H Failed 2U/2D
Visual markers are plotted directly on the relevant candles
📊 Signal Table
Lists all 9 tickers in rows
Columns for:
1H Signal
4H Signal
Daily 50% Retrace
USI:TICK Value
USI:ADD Value
Color-Coded Cells:
🔴 Red = Failed 2U
🟢 Green = Failed 2D
⚠️ Highlight if 50% Daily Retrace condition is true
🟦 Neutral-colored cells for TICK/ADD numeric display
🔔 Alerts
Hardcoded alerts fire when:
A 1H or 4H Failed 2U/2D is detected
The Daily 50% retrace condition is met
Each alert is labeled clearly by symbol and timeframe:
"META 4H Failed 2D"
"AAPL Daily 50% Retrace"
🎯 Use Case
Built for:
Reversal traders using The Strat
Swing or intraday traders watching hourly setups
Traders wanting quick visual context on market breadth without relying on it for confirmation
Monitoring multiple tickers in one clean view
This is scan 2
Add scan 1 for spx, spy, iwm, qqq, aapl
This indicator is not financial advice. Use the alerts to check out chart and when tickers trigger.
Cycle Composite 3.6 WeightedThe Cycle Composite is a multi-factor market cycle model designed to classify long-term market behavior into distinct phases using normalized and weighted data inputs.
It combines ten key on-chain, dominance, volatility, sentiment, and trend-following metrics into a single composite output. The goal is to provide a clearer understanding of where the market may stand in the broader cycle (e.g., accumulation, early bull, late bull, or euphoria).
This version (3.4) introduces flexible weighting, trend strength markers, and additional context-aware signals such as risk-on confirmations and altseason flags.
Phases Identified:
The model categorizes the market into one of five zones:
Euphoria (> 85)
Late Bull (70 – 85)
Mid Bull (50 – 70)
Early Bull (30 – 50)
Fear (< 30)
Each phase is determined by a smoothed EMA of the weighted composite score.
Data Sources and Metrics Used (10 total):
BTC Dominance (CRYPTOCAP:BTC.D)
Stablecoin Dominance (USDT + USDC average) (inverted for risk-on)
ETH Dominance (CRYPTOCAP:ETH.D)
BBWP (normalized Bollinger Band Width % over 1-year window)
WVF (Williams VIX Fix for volatility spike detection)
NUPL (Net Unrealized Profit/Loss, external source)
CMF (Chaikin Money Flow, smoothed volume accumulation)
CEX Open Interest (custom input from DAO / external source)
Whale Inflows (custom input from whale exchange transfer data)
Google Trends Average (BTC, Crypto, Altcoin terms)
All inputs are normalized over a 200-bar window and combined via weighted averaging, where each weight is user-configurable.
Additional Features:
Phase Labels: Labels are printed only when a new phase is entered.
Bull Continuation Marker: Triangle up when composite makes higher highs and NUPL increases.
Weakening Marker: Triangle down when composite rolls over in Late Bull and NUPL falls.
Risk-On Signal: Green circle appears when CMF and Google Trends are both rising.
Altseason Flag: Orange diamond appears when dominance of "others.d" exceeds BTC.D and ETH.D and composite is above 50.
Background Shading: Each phase is shaded with a semi-transparent background color.
Timeframe-Aware Display: All markers and signals are shown only on weekly timeframe for clarity.
Intended Use:
This script is intended for educational and macro-trend analysis purposes.
It can be used to:
Identify macro cycle position (accumulation, bull phases, euphoria, etc.)
Spot long-term trend continuation or weakening signals
Add context to price action with external on-chain and sentiment data
Time rotation events such as altseason risk
Disclaimer:
This script does not constitute financial advice.
It is intended for informational and research purposes only.
Users should conduct their own due diligence and analysis before making investment decisions.

Impulsive Candle Detector TRW [3-in-1]Impulsive Candle Detector
Description: professor Michael impulsive candle but 3 -1 code by me
The Impulsive Candle Detector is a powerful tool designed to identify and highlight three different types of impulsive candles on your TradingView chart—all in a single, customizable indicator. Each impulsive candle type uses its own configurable settings, allowing traders to easily visualize various market dynamics without crowding their charts with multiple indicators.
How it works:
The indicator detects “impulsive” candles based on custom thresholds for candle range, volume, and body-to-wick ratio.
Each of the three types is independently configurable with its own parameters (length for averages, size multiplier, volume multiplier, body ratio, and color).
When an impulsive candle is detected, the corresponding bar is colored and can optionally display a label above the candle indicating its type.
Separate alerts can be set for each impulsive candle type, enabling you to react to different market conditions instantly.
Features:
Three independent impulsive candle detection types, all in one indicator
Adjustable settings for each type (range, volume, body ratio, and color)
Clean, uncluttered chart view
Custom bar coloring and optional labels for instant visual recognition
Supports individual alert notifications for each impulsive candle type
Perfect for:
Traders looking to spot strong market moves or volatility spikes
Those who want to monitor multiple impulsive candle patterns without overlapping indicators
Anyone who values clean and customizable charting solutions

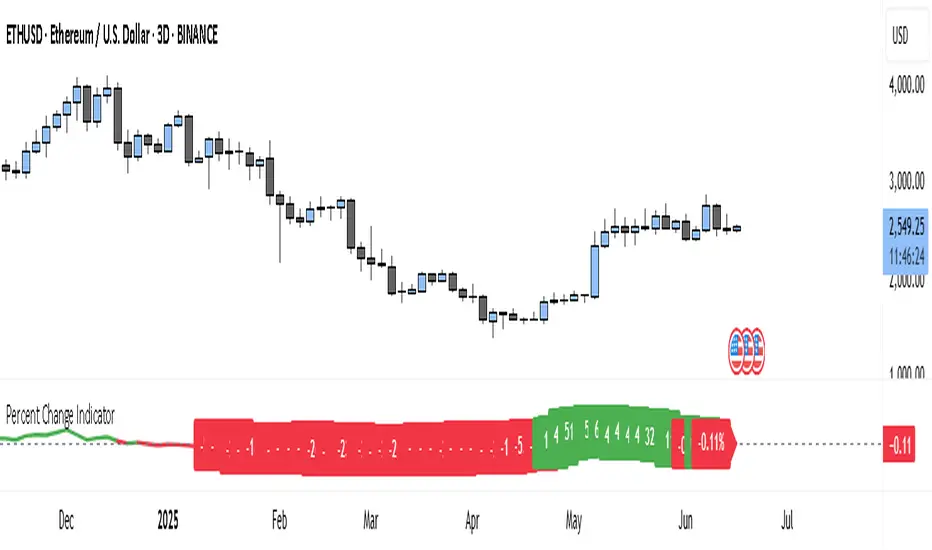
Percent Change IndicatorThe Percent Change Indicator helps you see how much the price of an asset has changed over a specific number of bars (or candles) on the chart. You get to decide how many bars to look back — for example, the last 10 candles. The indicator takes the current closing price and compares it to the closing price from 10 bars ago, then calculates the percentage difference between the two.
If the price has increased, the indicator shows a positive value and displays it in green. If the price has dropped, the value is negative and shown in red. A horizontal zero line helps you quickly see whether the market is gaining or losing value over the selected period.
On your chart, this indicator appears as a line that moves up or down with the price trend. It updates in real time and works on all timeframes — so whether you're trading on the 1-minute chart or analyzing the daily chart, it always tells you how much the price has changed over the number of bars you chose.
This tool is especially useful for spotting trends, measuring price momentum, or identifying when the market is starting to reverse direction.
Sessions By petranThis indicator highlights the key trading sessions on the chart: Asian, Frankfurt, London, and New York. It helps traders visually track when each session begins and ends, making it easier to analyze price action, volume, and volatility during specific times of the day.
Key features:
Customizable session start and end times
Up to 4 major sessions highlighted
Best used on intraday timeframes (1-minute to 1-hour)
Clean, minimal design with adjustable colors and transparency
No repainting – reliable for both live trading and backtesting
Ideal for intraday traders and anyone who wants to better understand market dynamics during different trading sessions.

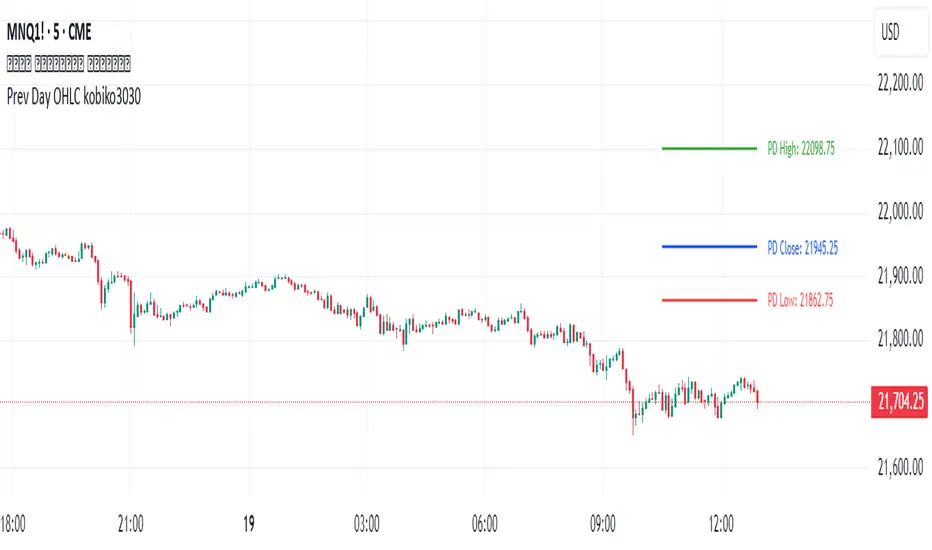
Previous Daily OHLCPrevious Daily OHLC Indicator
Overview:
This professional TradingView indicator displays the previous day's key price levels (Open, High, Low, Close, and 50% midpoint) as horizontal lines on your chart. These levels are essential for traders who use previous day data as support and resistance zones in their technical analysis.
What It Does
Displays Previous Day Levels: Automatically shows horizontal lines for yesterday's OHLC data
Real-Time Updates: Lines update dynamically each new trading day
Fully Customizable: Complete control over which levels to display and how they appear
Smart Line Management: Choose between showing lines for recent bars or across the entire chart
Professional Labels: Clear labels with optional price values for each level
Color Coded System: Distinct colors for each level type for instant recognition
Key Features
Five Important Price Levels
Previous Day Open: Yesterday's opening price - often acts as psychological level
Previous Day High: Yesterday's highest price - key resistance level for breakout trading
Previous Day Low: Yesterday's lowest price - important support level for breakdowns
Previous Day Close: Yesterday's closing price - significant reference point
50% Midpoint: Calculated midpoint between previous day's high and low - bias indicator
Metatron Lines (Highs & Lows Geometry)Metatron Lines
Hey TradingView community! 👋
I wanted to share something I've been working on that might help you see market structure from a different angle. This indicator connects pivot highs and lows using geometric patterns, creating what I call "Metatron Lines."
What it does (simply put):
- Finds significant highs and lows on your chart
- Draws lines connecting these points to reveal hidden geometric relationships
- Shows you the underlying structure that price tends to respect
Why I built this:
I noticed that markets often move in patterns that aren't immediately obvious. Sometimes the most important levels aren't the obvious support and resistance lines, but the intersections and angles created by connecting multiple pivot points. This tool helps visualize those relationships.
How it might help you:
- Pattern Recognition : Spot geometric formations that traditional analysis might miss
- Support/Resistance : See where multiple geometric lines converge to create strong levels
- Market Structure : Better understand how price flows and where it might find obstacles
- Confluence Areas : Identify zones where multiple geometric elements align
A few honest thoughts:
This isn't a magic bullet or a guaranteed profit maker (nothing is!). It's simply another lens through which to view price action. Some traders find geometric analysis helpful, others prefer different approaches - and that's perfectly fine.
I've tried to make it customizable so you can adjust it to fit your trading style and timeframe. The default settings work well for most instruments, but feel free to experiment.
Settings you can adjust:
- Pivot detection sensitivity
- Number of connection points
- Line colors and styles
- Which connections to show (highs, lows, or both)
I hope some of you find this useful! I'm always learning from this community, so if you have suggestions for improvements or different ways to use it, I'd love to hear them.
Trade safe and trust your process! 📈
---
This indicator is provided as-is for educational and analysis purposes. Please practice proper risk management and never risk more than you can afford to lose.

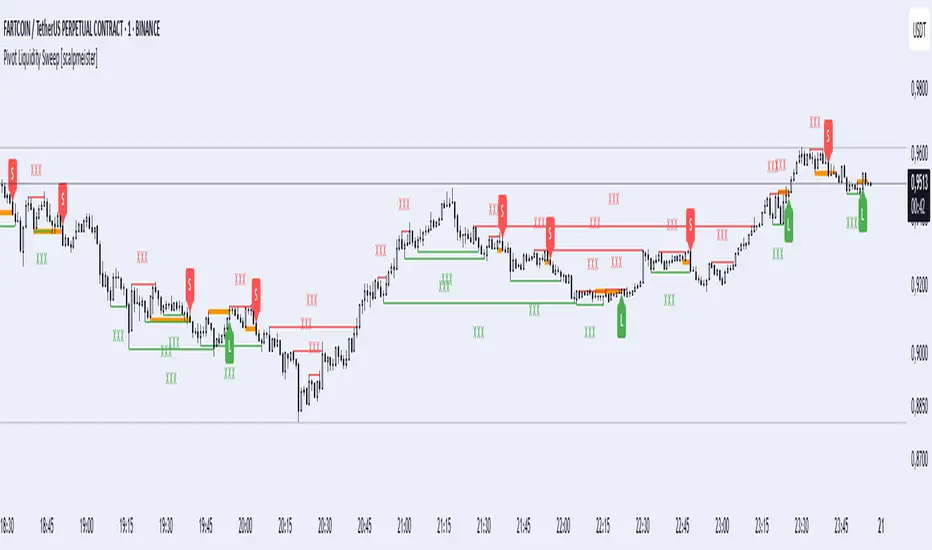
Pivot Liquidity Sweep [scalpmeister]📌 Pivot Liquidity Sweep
Scalp-oriented, liquidity sweep-based advanced signal and strategy indicator.
This indicator analyzes the price's sweeping of significant pivot levels and the subsequent breakouts to generate long/short signals based on different logics. It is sensitive to both classic sweep logic and strong reversal candles. Additionally, it visually marks liquidity gathering zones, offering excellent opportunities especially for scalp and intraday traders.
⚙️ Features and Strategy Types
🟢 Automatic Pivot Detection:
Pivot high/low levels are detected and stored based on the number of left and right bars.
🔴 Sweep Detection (Stop Hunt):
If the price violates a pivot level with a wick and closes inside, it is considered a sweep (liquidity cleaning). Strategies activate after this sweep.
🧠 5 Different Signal Styles:
SweepBreak:
It is expected that the extreme (high/low) level of the sweeping candle is broken with a close.
PivotBreak:
After the sweep, the first newly formed pivot in the trend direction is expected to break. (It is dynamically determined and drawn on the chart.)
StrongSweep:
It is sufficient if the candle following the sweep surpasses the previous candle with a single candle. No additional breakout is expected.
StrongCandle:
Strong momentum candles measured with a special RSI calculation are taken into account. It considers strong opposite-direction candles formed shortly after a pivot sweep.
ReversalCandleSweep:
Reversal candles that close in the opposite direction after a sweep (e.g., a red close on a sweep candle formed at the top or a green close at the bottom) are directly considered as signals.
📐 Technical Details:
Signals are triggered only once (triggered control).
Sweep lines (green/red), Long and Short lines (Orange)
Strong candles are filtered using an RSI-momentum-based measurement system (StrongCandle).
Sweep and breakout zones are dynamically invalidated. That is, if the zones are violated by the price, the signals and lines are automatically canceled.
🎯 Who Should Use It?
Professional traders working with liquidity zones
Scalp and intraday strategy practitioners
Those focused on stop hunts, sweeps, and reversal zones
🔔 Alert Support:
Sweep High / Low Alert
Long / Short Signal Alert