AI Smart Liquidity Signal 🚀🚀 AI Smart Liquidity Signal
🔐 إشارات تداول ذكية مبنية على اختراقات السيولة الحقيقية + فلاتر دقيقة تؤكد الإشارات بفعالية.
✅ فلترة الاتجاه العام + الاتجاه الذكي
✅ تأكيد عبر RSI و MACD
✅ مناطق دعم ومقاومة ديناميكية ومتعددة الفريمات
✅ أهداف Take Profit و Stop Loss محسوبة تلقائيًا عبر ATR
⛔️ بدون إعادة رسم – إشارات موثوقة ومجربة
🔎 نسبة دقة تفوق 95% على البيانات التاريخية
💬 للحصول على صلاحية الاستخدام أو الدعم:
@AISmartliquiditySignalBot
––––––––––––––––––––––––––––––––––––––––––––––––––
🚀 AI Smart Liquidity Signal
🔐 Real-time smart signals based on true liquidity breakouts with advanced filters.
✅ General + Smart Trend filters
✅ RSI & MACD confirmation
✅ Dynamic and Multi-Timeframe Support/Resistance
✅ Auto-calculated Take Profit & Stop Loss via ATR
⛔️ No repaint – trusted & verified signals
🔎 Historical accuracy above 95%
💬 For access or support:
@AISmartliquiditySignalBot
––––––––––––––––––––––––––––––––––––––––––––––––––
📌 ملاحظة / Disclaimer:
هذا المؤشر مخصص لأغراض تعليمية ولا يُعد نصيحة مالية. التداول على مسؤوليتك الخاصة.
This script is for educational purposes only and does not constitute financial advice. Trade at your own risk.
Chart patterns

StratNinjaTableThis Pine Script indicator provides traders with a dynamic table overlay on the chart that displays The Strat candle patterns across multiple selectable timeframes. The table includes:
The candle pattern according to The Strat method (1, 2UP, 2DOWN, 3) for each chosen timeframe
Direction arrows showing bullish (▲), bearish (▼), or neutral (■) candle direction
Real-time countdown timer showing remaining time until the current candle closes, adapting automatically to daily, weekly, monthly, and longer timeframes
User inputs for selecting which timeframes to display and positioning of the table on the chart
The current ticker symbol and chart timeframe displayed prominently
The script is developed using Pine Script version 6 and is inspired by the work of shayy110, who contributed foundational code for The Strat methodology in TradingView.

HedgeFi - 30 Min OpenTest script for Miyagi
Script maps the first 30minute candle high and low for London and NY sessions.
When price cleanly closes above the high or below the low, within the first 90 minutes of the session, a signal is generated.
Aligned to NY timezone.

OPR Asia-New-York [Elykia]This Pine Script indicator, called "OPR Asia-New-York ", displays time-based boxes corresponding to two specific trading periods known as OPR (Opening Price Range):
🎯 Purpose of the Indicator:
To visualize two key market time windows (morning and afternoon) as extended boxes, helping with technical analysis around opening ranges.
🕒 Two sessions displayed as boxes:
🔹 Morning OPR:
Default: from 09:00 to 09:15 (configurable)
The box extends until 10:30.
It captures the highest and lowest candle within this interval.
🔸 Afternoon OPR:
Default: from 15:30 to 15:45
The box extends until 17:30.
Follows the same logic as the morning session.
⚙️ Dashboard Options:
Enable or disable the morning or afternoon box individually
Select the timezone (e.g., GMT+2)
Customize all colors (morning/afternoon boxes, median line)
Set your own start/end/extension times for each session
📦 Each box includes:
A colored rectangle showing the price range (high/low)
A dotted median line between the high and low
The box and line extend until the end time defined
🧠 Usefulness for Traders:
Identify liquidity zones or consolidation areas
Trade setups like liquidity grabs, breakouts, or fakeouts around the OPR
Align with ICT methods or scalping strategies based on session behavior

MOE²: Sniper Entry Signal SystemMOE² General is a closed source indicator designed for active traders in Forex, Crypto, Metals, and Indices. It helps define entries, stop losses, and profit targets by combining classic price action with layered technical analysis.
The script integrates traditional tools such as exponential moving averages, volume surges, and candle pattern recognition. These are used together to validate market structure and highlight actionable trade zones. Entry areas are visually mapped on the chart and paired with logical exit levels to support clarity in decision making.
It is calibrated for short term strategies and performs best on 5 minute to 1 hour timeframes. Signal frequency is intentionally limited to maintain quality over quantity and promote disciplined trade selection.
MOE² General is built for traders who value clean visuals, straightforward logic, and risk awareness. It provides structured guidance without relying on lagging confirmations alone.
All logic is embedded within the tool. No external references or outside dependencies are required.

Detector de BOSDetection of Break Of Structure to know when the market can shift from bullish to bearish or from bearish to bullish trends.

3-Candle HH/HL or LH/LL (Number Labels Over Candles)What This Script Does:
This Pine Script detects 3 consecutive candlesticks that show:
Higher Highs and Higher Lows → a bullish structure
Lower Highs and Lower Lows → a bearish structure
When such a pattern is found, the script:
Marks each of the 3 candles with a number: 1, 2, and 3
Labels appear centered on each candle (at the close price)
You can adjust:
Label size (tiny → huge)
Background color (bullish/bearish)
Text color
Example:
If candles form:
Candle A: higher high & higher low
Candle B: higher than A
Candle C: higher than B
Then you’ll see 1, 2, 3 labels on those candles in green (or your selected color).
Same goes for a bearish pattern in red.

📈🧠 SignalAnalytics™ ProSignalAnalytics™ Pro is a multi-factor signal engine combining trend, momentum, volume, and relative strength into a unified scorecard with smart AI commentary.
🔧 Features: EMA stack, RSI divergence, ADX trend strength, MACD cross, OBV/ADL flow, RS Alpha vs custom benchmark.
⚙️ Customizable: Change benchmark (e.g., SPY, XJO, NIFTY), scorecard position, AI font size, and toggle commentary/table.
🤖 Commentary: Detects breakouts, warns of divergence, and offers clear trade guidance.
✅ Ideal for swing traders and momentum investors who value signal clarity and objective decisions.

Live Breakout Zones (No Repaint)The Live Breakout Zones indicator is a non-repainting, real-time breakout detection tool designed to help traders identify critical price breakouts as they happen — without lag and without repainting past signals.
This indicator scans recent price action to determine the highest high and lowest low over a user-defined lookback period. When price closes above the recent high or below the recent low, it immediately plots a breakout zone on the chart and provides a visual confirmation through labels and optional alerts.
🔍 Key Features:
✅ No Repainting – Signals are locked in as soon as a breakout happens; no future bar confirmation is needed.
⏱️ Minimal Lag – Reacts on breakout of recent range highs/lows without waiting for pivots or candle confirmation.
📦 Breakout Zones – Automatically draws colored rectangles showing the breakout level and zone width for clearer analysis.
🔔 Real-Time Alerts – Alerts for both bullish and bearish breakouts help you stay informed without watching the screen.
⚙️ Customizable – Adjustable lookback length, zone width, and color settings to match your strategy or chart style.
📈 Use Cases:
Identify key breakout moments for entry or retest zones.
Confirm breakout-based strategies in trending or consolidating markets.
Use zones for setting risk-reward areas, SL/TP levels, or re-entry planning.
⚙️ Settings:
Lookback Range (High/Low): Defines how many previous bars are checked for breakout levels.
Zone Width: Number of bars to extend the breakout box forward.
Bullish/Bearish Zone Color: Choose custom colors for breakout visualization.
🧠 Trading Tip:
Combine this tool with volume spikes, tail candles, or support/resistance for more reliable breakout setups.

Market Direction Arrowsmy indicater when market is up trend they show green arrow when market is down trend they
show red arrow confirm my indicater never fail

IME's Community First Presented FVGsIME's Community First Presented FVGs v1.5 - Advanced Implementation
ORIGINALITY & INNOVATION
This indicator advances beyond basic Fair Value Gap detection by implementing a sophisticated 24-hour FVG lifecycle management system aligned with institutional trading patterns. While many FVG indicators simply detect gaps and extend them indefinitely, this implementation introduces temporal intelligence that mirrors how institutional algorithms actually manage these inefficiencies.
Key Innovations that set this apart:
- 24-Hour Lifecycle Management: FVGs extend dynamically until 16:59, then freeze until removal at 17:00 next day
- Institutional Day Alignment: Recognizes 18:00-16:59 trading cycles vs standard calendar days
- Multi-Session Detection: Simultaneous monitoring of Midnight, London, NY AM, and NY PM sessions
- Advanced Classification System: A.FVG detection with volume imbalance analysis vs classic FVG patterns
- Volatility Settlement Logic: Blocks contamination from opening mechanics (3:01+, 0:01+, 13:31+ rules)
- Visual Enhancement System: C.E. lines, contamination warnings, dark mode support with proper transparency handling
BASED ON ICT CONCEPTS
This indicator implements First Presented Fair Value Gap methodology taught by ICT (Inner Circle Trader). The original F.P. FVG concepts, timing rules, and session-based detection are credited to ICT's educational material. This implementation extends those foundational concepts with advanced lifecycle management and institutional alignment features.
ICT's Core F.P. FVG Rules Implemented:
- First clean FVG after session opening (avoids opening contamination)
- 3-candle pattern requirement for valid detection
- Session-specific timing windows and volatility settlement
- Consequent Encroachment level identification
IME's Advanced Enhancements:
- Automated lifecycle management with institutional day recognition
- Multi-session simultaneous monitoring with proper isolation
- Advanced visual system with transparency states for aged FVGs
- A.FVG classification with volume imbalance detection algorithms
HOW IT WORKS
Core Detection Engine
The indicator monitors four key institutional sessions using precise timing windows:
- Midnight Session: 00:01-00:30 (blocks 00:00 contamination)
- London Session: 03:01-03:30 (blocks 03:00 contamination)
- NY AM Session: 09:30-10:00 (configurable 9:30 detection)
- NY PM Session: 13:31-14:00 (blocks 13:30 contamination)
During each session window, the algorithm scans for the first valid FVG pattern using ICT's 3-candle rule while applying volatility settlement principles to avoid false signals from opening mechanics.
Advanced Classification System
Classic FVG Detection:
Standard 3-candle wick-to-wick gap where candle 1 and 3 don't overlap, creating an inefficiency that institutions must eventually fill.
A.FVG (Advanced FVG) Detection:
Enhanced pattern recognition that includes volume imbalance analysis (deadpool detection) to identify more significant institutional inefficiencies. A.FVGs incorporate both the basic gap plus additional price imbalances between candle bodies, creating larger, more significant levels.
24-Hour Lifecycle Management
Phase 1 - Dynamic Extension (Creation Day):
From detection until 16:59 of creation day, FVGs extend in real-time as new bars form, maintaining their relevance as potential support/resistance levels.
Phase 2 - Freeze Period (Next Day):
At 16:59, FVGs stop extending and "freeze" at their final size, remaining visible as reference levels but no longer growing. This prevents outdated levels from contaminating fresh analysis.
Phase 3 - Cleanup (17:00 Next Day):
Exactly 24+ hours after creation, FVGs are automatically removed to maintain chart clarity. This timing aligns with institutional trading cycle completion.
Institutional Day Logic
The algorithm recognizes that institutional trading days run from 18:00-16:59 (not midnight-midnight). This alignment ensures FVGs are managed according to institutional timeframes rather than arbitrary calendar boundaries.
Contamination Avoidance System
Volatility Settlement Principle:
Opening mechanics create artificial volatility that can produce false FVG signals. The indicator automatically blocks detection during exact session opening times (X:00) and requires settlement time (X:01+) before identifying clean institutional inefficiencies.
Special NY AM Handling:
Provides configurable 9:30 detection for advanced users who want to capture potential opening range FVGs, with clear visual warnings about contamination risk.
VISUAL SYSTEM
Color Intelligence
- Current Day FVGs: Full opacity with session-specific colors
- Previous Day FVGs: 70% transparency for historical reference
- Special Timing (9:30): Dedicated warning color with alert labels
- Dark Mode Support: Automatic text/line color adaptation
Enhanced Visual Elements
C.E. (Consequent Encroachment) Lines:
Automatically calculated 50% levels within each FVG, representing the most likely fill point based on institutional behavior patterns. These levels extend and freeze with their parent FVG.
Contamination Warnings:
Visual alerts when FVGs are detected during potentially contaminated timing, helping traders understand signal quality.
Session Identification:
Clear labeling system showing FVG type (FVG/A.FVG), session origin (NY AM, London, etc.), and creation date for easy reference.
HOW TO USE
Basic Setup
1. Session Selection: Enable/disable specific sessions based on your trading strategy
2. FVG Type: Choose between Classic FVGs or A.FVGs depending on your analysis preference
3. Visual Preferences: Adjust colors, text size, and enable dark mode if needed
Trading Applications
Intraday Reference Levels:
Use current day FVGs as potential support/resistance for price action analysis. The dynamic extension ensures levels remain relevant throughout the trading session.
Multi-Session Analysis:
Monitor how price interacts with FVGs from different sessions to understand institutional flow and market structure.
C.E. Level Trading:
Focus on the 50% consequent encroachment levels for high-probability entry points when price approaches FVG zones.
Historical Context:
Previous day FVGs (shown with transparency) provide context for understanding market structure evolution across multiple trading days.
Advanced Features
9:30 Special Detection:
For experienced traders, enable 9:30 FVG detection to capture opening range inefficiencies, but understand the contamination risks indicated by warning labels.
A.FVG vs Classic Toggle:
Switch between detection modes based on market conditions - A.FVGs for trending environments, Classic FVGs for ranging conditions.
Best Practices
- Use on 1-minute to 15-minute timeframes for optimal session detection
- Combine with other institutional concepts (order blocks, liquidity levels) for comprehensive analysis
- Pay attention to transparency states - current day FVGs are more actionable than previous day references
- Consider C.E. levels as primary targets rather than full FVG fills
TECHNICAL SPECIFICATIONS
Platform: Pine Script v6 for optimal performance and reliability
Timeframe Compatibility: All timeframes (optimized for 1M-15M)
Market Compatibility: 24-hour markets (Forex, Crypto, Futures)
Session Management: Automatic trading day detection with weekend handling
Memory Management: Intelligent capacity limits with automatic cleanup
Performance: Optimized algorithms for smooth real-time operation
CLOSED SOURCE JUSTIFICATION
This indicator is published as closed source to protect the proprietary algorithms that enable:
- Precise 24-hour lifecycle timing calculations with institutional day alignment
- Advanced A.FVG classification with sophisticated volume imbalance detection
- Complex multi-session coordination with contamination filtering
- Optimized memory management preventing performance degradation
- Specialized visual state management for transparency and extension logic
The combination of these advanced systems creates a unique implementation that goes far beyond basic FVG detection, warranting protection of the underlying computational methods while providing full transparency about functionality and usage.
PERFORMANCE CHARACTERISTICS
Real-Time Operation: Smooth performance with minimal resource usage
Accuracy: Precise session detection with timezone consistency
Reliability: Robust error handling and edge case management
Scalability: Supports multiple simultaneous FVGs without performance impact
This advanced implementation represents significant evolution beyond basic FVG indicators, providing institutional-grade analysis tools for serious traders while maintaining the clean visual presentation essential for effective technical analysis.
IMPORTANT DISCLAIMERS
Past performance does not guarantee future results. This indicator is an educational tool based on ICT's Fair Value Gap concepts and should be used as part of a comprehensive trading strategy. Users should understand the risks involved in trading and consider their risk tolerance before making trading decisions. The indicator identifies potential support/resistance levels but does not predict market direction with certainty.
2 days ago
Release Notes
IME's Community First Presented FVGs v1.5.2 - Critical Bug Fixes
Bug Fixes:
v1.5.1 - Fixed 9:30 Contamination Blocking:
Issue: When 9:30 detection toggle was OFF, script still detected 9:30 candles as F.P. FVGs
Fix: Added proper contamination blocking logic that prevents 9:30 middle candle detection when toggle is OFF
Result: Toggle OFF now correctly shows clean F.P. FVGs at 9:31+ (proper ICT volatility settlement)
v1.5.2 - Fixed A.FVG Box Calculation Accuracy:
Issue: A.FVG boxes incorrectly included ALL body levels even when no actual deadpool existed between specific candles
Fix: Implemented selective body level inclusion - only adds body prices where actual volume imbalances exist
Result: A.FVG boxes now accurately represent only areas with real institutional volume imbalances
Impact:
More Accurate Detection: 9:30 contamination properly blocked when disabled
Precise A.FVG Zones: Boxes only include levels with actual deadpools/volume imbalances
Institutional Accuracy: Both fixes align detection with true institutional trading principles
Technical Details:
Enhanced contamination blocking checks middle candle timing in normal mode
A.FVG calculation now selectively includes body levels based on individual deadpool existence
Maintains backward compatibility with all existing features and settings
These fixes ensure the indicator provides institutionally accurate FVG detection and sizing for professional trading analysis.

True Strength Index By DejanTrue Strength Index (TSI)
The True Strength Index is a price momentum oscillator based on double smoothing processing, primarily used to identify overbought/oversold market conditions and trend strength. This version is independently developed and maintained by the Dejan Team, optimized specifically for cryptocurrency trading.
1. Key Features
Double Smoothing Processing: Utilizes two exponential moving average (EMA) calculations on price changes to reduce market noise
Momentum Indicator: Reflects both the rate and direction of price changes
Zero-line Oscillation: Typically fluctuates between +30 and -30
2. Calculation Formula
TSI = (Double-smoothed price change / Double-smoothed absolute price change) × 100
Where:
Primary EMA period: Typically 25
Secondary EMA period: Typically 13
Signal line: Usually a 7-12 period EMA
3. Usage Guidelines
Zero-line Crossovers :
TSI crosses above zero: Buy signal
TSI crosses below zero: Sell signal
Overbought/Oversold Conditions :
TSI > +30: Potential overbought condition
TSI < -30: Potential oversold condition
Divergence Analysis :
Price reaches new high while TSI fails to make new high: Potential bearish divergence
Price reaches new low while TSI fails to make new low: Potential bullish divergence
Signal Line Crossovers :
TSI crosses above signal line: Buy signal
TSI crosses below signal line: Sell signal
4. Advantages and Limitations
Advantages :
Highly responsive to price changes
Effectively filters out short-term volatility
Adaptable to multiple timeframes
Limitations :
May remain in overbought/oversold territory for extended periods during strong trends
Requires confirmation from additional indicators for reliable signals
The TSI indicator works best when combined with other technical analysis tools to enhance trading signal accuracy.
Contact:
QQ: 673008865
WeChat: dejan_he

My script// This Pine Script® code is subject to the terms of the Mozilla Public License 2.0 at mozilla.org
// © AlgoTrade_Pro
//@version=5
indicator(title='Twin Range Filter ', overlay=true, timeframe='')
//Inputs
TRsource = input(defval=close, title='Source')
TRper1 = input.int(defval=27, minval=1, title='Fast period')
TRmult1 = input.float(defval=1.6, minval=0.1, title='Fast range')
TRper2 = input.int(defval=55, minval=1, title='Slow period')
TRmult2 = input.float(defval=2, minval=0.1, title='Slow range')
//Calculations
smoothrng(TRx, TRt, TRm) =>
TRwper = TRt * 2 - 1
TRavrng = ta.ema(math.abs(TRx - TRx ), TRt)
TRsmoothrng = ta.ema(TRavrng, TRwper) * TRm
TRsmoothrng
TRsmrng1 = smoothrng(TRsource, TRper1, TRmult1)
TRsmrng2 = smoothrng(TRsource, TRper2, TRmult2)
TRsmrng = (TRsmrng1 + TRsmrng2) / 2
rngfilt(TRx, TRr) =>
TRrngfilt = TRx
TRrngfilt := TRx > nz(TRrngfilt ) ? TRx - TRr < nz(TRrngfilt ) ? nz(TRrngfilt ) : TRx - TRr : TRx + TRr > nz(TRrngfilt ) ? nz(TRrngfilt ) : TRx + TRr
TRrngfilt
TRfilt = rngfilt(TRsource, TRsmrng)
TRupward = 0.0
TRupward := TRfilt > TRfilt ? nz(TRupward ) + 1 : TRfilt < TRfilt ? 0 : nz(TRupward )
TRdownward = 0.0
TRdownward := TRfilt < TRfilt ? nz(TRdownward ) + 1 : TRfilt > TRfilt ? 0 : nz(TRdownward )
TRSTR = TRfilt + TRsmrng
TRSTS = TRfilt - TRsmrng
TRFUB = 0.0
TRFUB := TRSTR < nz(TRFUB ) or close > nz(TRFUB ) ? TRSTR : nz(TRFUB )
TRFLB = 0.0
TRFLB := TRSTS > nz(TRFLB ) or close < nz(TRFLB ) ? TRSTS : nz(TRFLB )
TRTRF = 0.0
TRTRF := nz(TRTRF ) == TRFUB and close <= TRFUB ? TRFUB : nz(TRTRF ) == TRFUB and close >= TRFUB ? TRFLB : nz(TRTRF ) == TRFLB and close >= TRFLB ? TRFLB : nz(TRTRF ) == TRFLB and close <= TRFLB ? TRFUB : TRFUB
//Entry Signals
TRlong = ta.crossover(close, TRTRF)
TRshort = ta.crossunder(close, TRTRF)
//Plots
plotshape(TRlong, title='Long', text='BUY', style=shape.labelup, textcolor=color.white, size=size.tiny, location=location.belowbar, color=#1be600)
plotshape(TRshort, title='Short', text='SELL', style=shape.labeldown, textcolor=color.white, size=size.tiny, location=location.abovebar, color=#e60000)
Trfff = plot(TRTRF, color=color.white)
mPlot = plot(ohlc4, title='', style=plot.style_circles, linewidth=0)
longFillColor = close > TRTRF ? color.green : na
shortFillColor = close < TRTRF ? color.red : na
fill(mPlot, Trfff, title='UpTrend Highligter', color=longFillColor, transp=90)
fill(mPlot, Trfff, title='DownTrend Highligter', color=shortFillColor, transp=90)
//Alerts
alertcondition(TRlong, title='Long', message='Long')
alertcondition(TRshort, title='Short', message='Short')
//End

Heatmap w/ ATRThis script combines Heatmap Volume with a scaled ATR (Average True Range) overlay for dynamic market insight. Volume bars are color-coded based on how many standard deviations they deviate from a moving average, helping identify spikes, absorption, or anomalies.
The ATR is scaled relative to the maximum volume observed to maintain visual alignment in the same pane. This allows traders to compare price volatility (ATR) against real market activity (volume) in one view.
Use this overlay to:
Spot high-volatility, high-conviction moves (rising ATR + red/orange bars)
Detect low-volume fakeouts (high ATR, cool-colored bars)
Identify compression zones before expansion (low ATR + normal volume)

Combined Indicators: RSI, DMI, ATR, EMA, SMAit is a script that adds every single type of indicator ( but not ribbons ) ...
give it your interest and try it out !!!
feel free to give it a like ...
yours truly jitendra thakur ...

Auto Enhanced Trendline ChannelAuto Enhanced Trendline Channel" is an intelligent technical analysis tool designed to automatically identify and plot key trendlines and price channels in the market. Using advanced algorithms, this tool not only detects the price's fluctuating trends but also adjusts the channel range in real-time based on market changes, enabling traders to more accurately capture market fluctuations and optimize trading decisions. The enhanced version offers higher flexibility and accuracy, making it suitable for various market environments, and helps users seize more trading opportunities in complex markets.
Red Trendline: Explicit resistance trendline.
Green Trendline: Explicit support trendline.
Orange Trendline: Antagonistic resistance trendline (forecast).
Blue Trendline: Antagonistic support trendline (forecast).
The semi-transparent red and green lines form the volume channel.

🤖🧠 ALGO Sniper🤖🧠 How the Script Works
The ALGO Sniper Indicator is a powerful trend-following tool designed to identify high-probability trading opportunities with precise buy and sell signals. Built on Pine Script v5, it leverages advanced trend detection and risk management features to enhance trading decisions. Below are the key mechanics of the script:
1. Advanced Trend Detection: Utilizes a smoothed range algorithm and the proprietary Algo Sniper filter to identify market trends, ensuring accurate trend direction analysis.
2. Candle-Close Signals: Generates buy and sell signals only after candle confirmation (barstate.isconfirmed), eliminating lag and ensuring reliable entries.
3. Sideways Market Filter: Includes a "No Signal in Sideways Market" option to avoid false signals during low-volatility, range-bound conditions.
4. Dynamic Stop-Loss: Offers both manual (ATR-based) and auto (20-40 pips) stop-loss options, allowing users to manage risk effectively.
5. Flexible Take-Profit: Supports manual (user-defined pips) and auto (300-800 pips) take-profit settings for customizable profit targets.
6. Visual Clarity: Plots clear buy/sell signals with "STRONG BUY" and "STRONG SELL" labels, along with dashed stop-loss and entry lines for easy trade monitoring.
7. Customizable Inputs: Provides user-friendly inputs for scan range, observation period, stop-loss offset, line colors, and thicknesses to tailor the indicator to individual preferences.
8. Alert System: Includes alert conditions for buy, sell, and take-profit events, enabling users to stay informed about market opportunities.
9. Volatility Adjustment: Adapts to market conditions using a smoothed range multiplier, ensuring robust performance across different assets and timeframes.
10. Non-Repainting Logic: Signals are generated post-candle close, preventing repainting and providing dependable trade setups.

ABC + Liquidity Trendlines Combined# ABC + Liquidity Trendlines Combined Indicator
## Overview
This comprehensive technical analysis tool combines advanced pattern recognition with dynamic liquidity zone detection to provide traders with high-probability entry and exit signals. The indicator integrates ABC harmonic pattern analysis with intelligent trendline breakout detection, creating a powerful multi-dimensional trading system.
## Key Features
### ABC Pattern Recognition System
- **Automated ZigZag Detection**: Identifies significant price swings using configurable period settings
- **Fibonacci-Based ABC Patterns**: Detects classic ABC retracement patterns with customizable Fibonacci levels (default 38.2% - 61.8%)
- **Error Rate Tolerance**: Built-in flexibility to accommodate market noise and imperfect patterns
- **Visual Pattern Marking**: Clear A, B, C labels with connecting lines for easy pattern identification
### Dynamic Liquidity Trendlines
- **Adaptive Trendline Generation**: Automatically draws support and resistance trendlines based on pivot highs and lows
- **Liquidity Zone Visualization**: Filled areas between parallel trendlines showing institutional liquidity zones
- **Real-time Trendline Updates**: Lines extend dynamically as new price data becomes available
- **Breakout Detection**: Immediate identification of trendline violations with visual alerts
### Trend Cloud System
- **Multi-Timeframe Moving Averages**: Incorporates 4 SMAs and 2 EMAs for comprehensive trend analysis
- **Dynamic Trend Cloud**: Color-coded cloud that visually represents market sentiment and trend strength
- **Trend Direction Filter**: Helps filter ABC signals based on overall market direction
### Advanced Signal Generation
- **ABC Entry Signals**: Precise entry points when ABC patterns complete near trend cloud support/resistance
- **Liquidity Breakout Alerts**: Immediate notification when price breaks through established liquidity zones
- **Confluence-Based Filtering**: Signals are generated only when multiple conditions align
- **Stochastic Confirmation**: Additional momentum confirmation using modified stochastic oscillator
## Signal Types
### ABC Signals (Small Triangles)
- **Green Triangle Up**: ABC long signal - Price completes ABC pattern with bullish confluence
- **Red Triangle Down**: ABC short signal - Price completes ABC pattern with bearish confluence
### Liquidity Breakout Signals (Large Triangles)
- **Blue Triangle Up**: Bullish liquidity breakout - Price breaks above resistance trendline
- **Red Triangle Down**: Bearish liquidity breakout - Price breaks below support trendline
## Configuration Options
### ABC Settings
- **ZigZag Period**: Sensitivity of swing detection (2-50)
- **Fibonacci Levels**: Customizable max/min retracement levels
- **Error Rate**: Tolerance for pattern imperfection (0-30%)
- **Pattern Display**: Toggle ABC pattern visibility and persistence
### Liquidity Settings
- **Pivot Period**: Lookback period for trendline calculation
- **Padding Distance**: Space between parallel trendlines
- **Color Customization**: Separate colors for bullish/bearish zones
- **Breakout Alerts**: Toggle for breakout signal display
### Trend Cloud
- **Moving Average Lengths**: Four SMA and two EMA period settings
- **Source Selection**: Choose price input for moving average calculations
- **Cloud Visualization**: Toggle trend cloud display with custom colors
## Best Practices
### Entry Strategies
1. **ABC Confluence**: Enter when ABC signals align with trend cloud direction
2. **Liquidity Breaks**: Trade breakouts with volume confirmation when available
3. **Multi-Timeframe**: Use higher timeframe trend cloud for directional bias
### Risk Management
- Place stops beyond pattern completion points for ABC trades
- Use trendline reclaim levels as stop loss for breakout trades
- Consider position sizing based on signal strength and confluence
### Market Conditions
- **Trending Markets**: Focus on ABC signals in trend direction
- **Range Markets**: Emphasize liquidity breakout signals
- **High Volatility**: Increase error rate tolerance for pattern recognition
## Alert System
The indicator provides comprehensive alert notifications for:
- ABC long and short signal generation
- Liquidity trendline breakouts (both directions)
- Pattern completion events
- Trend cloud direction changes
This indicator is designed for traders who appreciate the combination of harmonic pattern analysis with modern liquidity concepts, providing a robust framework for identifying high-probability trading opportunities across multiple timeframes and market conditions.

水印This custom indicator allows you to add a watermark to your TradingView charts, offering a straightforward way to label or brand your chart images. Whether you want to mark your charts for personal use, sharing, or copyright protection, this indicator provides a flexible and easy-to-use solution.
TG:https://t.me/BTC_133333

Pivot + Supports and ResistancesBot that automatically takes the high, low, and close of the previous day and gives three supports and three resistances

Smart Money OscillatorSmart Money Oscillator — Description and Interpretation
The Smart Money Oscillator is a momentum-style indicator designed to highlight when informed, institutional traders (“smart money”) are likely accumulating (buying) or distributing (selling) assets.

Smart Money vs Dumb Money ZonesSmart Money vs Dumb Money Buy & Sell Signals on Candle Chart
Smart Money Signals
Smart Money Buy: Indicates institutional or informed traders accumulating positions. This usually happens when volume spikes on a down candle near recent lows — a sign of savvy buying before price rises.
Smart Money Sell: Signals institutional distribution. Typically shown by volume spikes on up candles near recent highs — suggesting smart traders are offloading positions before a potential drop.
Dumb Money Signals
Dumb Money Buy: Reflects retail traders chasing price momentum at overbought levels, often buying near local or recent highs based on hype or fear of missing out.
Dumb Money Sell: Represents panic selling by retail traders at oversold levels near recent lows, often selling in fear as price falls further.
Visual on Candle Chart:
This data is restricted to paid members
Why It Matters:
Smart Money signals help identify potential turning points caused by large, well-informed players. Following these can help you align trades with market movers.
Dumb Money signals warn of retail emotional extremes — often contrarian trade opportunities when the crowd is overly optimistic or fearful.

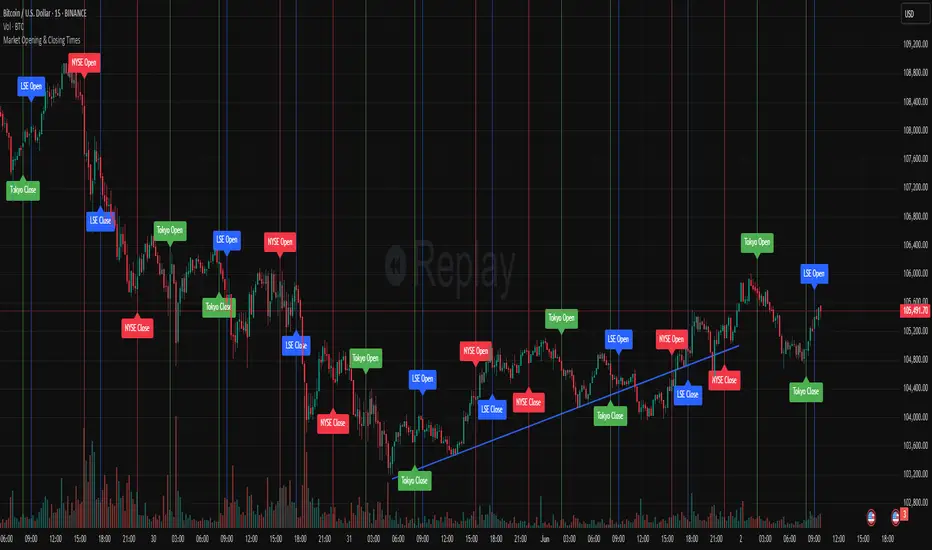
Market Opening & Closing TimesThis indicator highlights the opening and closing times of major global markets (NYSE, LSE, Tokyo) on any chart timeframe. Users can toggle the display of lines and labels, and customize colors per market.
Features:
Toggle each market’s Open/Close separately
Global toggles: Show/Hide all lines or labels
Customizable colors for NYSE, LSE, and Tokyo markers
Accurate event detection using timezone-aware timestamp checks within each bar