ES OHLC BASED ON 9:301. RTH Price Levels
YC (Yesterday's Close): Previous day's RTH closing price at 4:00 PM ET
0DTE-O (Today's Open): Current day's RTH opening price at 9:30 AM ET
T-E-M (Today's Europe-Asia Midpoint): Midpoint of overnight session high/low
T-E-R (Today's Europe-Asia Resistance): Overnight session high
T-E-S (Today's Europe-Asia Support): Overnight session low
Y-T-M (Yesterday-Today Midpoint): Midpoint between YC and 0DTE-O
2. Previous Bar Percentage Levels
Displays 50% retracement level for all bars
Shows 70% level for bullish bars (close > open)
Shows 30% level for bearish bars (close < open)
Lines automatically update with each new bar
3. Custom Support/Resistance Lines
Up to 4 customizable horizontal levels (2 resistance, 2 support)
Useful for marking key psychological levels or pivot points
4. VIX-Based Options Strategy Suggestions
Real-time VIX value display
Time Zone Handling
The indicator is configured for Central Time (CT) as Pine Script's default:
RTH Open: 8:30 AM CT (9:30 AM ET)
RTH Close: 3:00 PM CT (4:00 PM ET)
Overnight session: 7:00 PM CT to 8:30 AM CT next day
Usage Notes
Chart Requirement: This indicator only works on 5-minute timeframe charts
Auto-refresh: All lines and labels automatically refresh at each new trading day's RTH open
24-hour Market: Designed for ES futures which trade nearly 24 hours
Visual Clarity: Different line styles and colors for easy identification
Ideal For
Day traders focusing on ES futures
0DTE options traders needing key reference levels
Traders using overnight gaps and previous day's levels
Those incorporating VIX-based strategies in their trading
Chart patterns

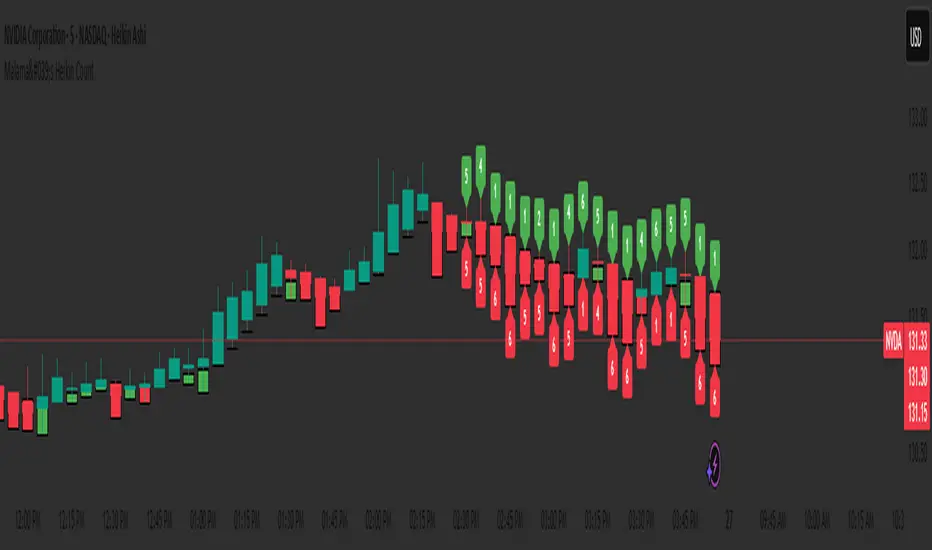
Malama's Heikin CountMalama's Heikin Count is a Pine Script indicator designed to enhance price action analysis by combining Heikin Ashi candlestick calculations with a normalized measurement of upper and lower shadow sizes. The indicator overlays Heikin Ashi candles on the chart and displays the relative sizes of upper and lower shadows as numerical labels (scaled from 1 to 10) for candles within the last two days, starting from 9:00 AM each day. This tool aims to help traders identify the strength of price movements and potential reversals by quantifying the significance of candlestick shadows in the context of Heikin Ashi’s smoothed price data. It is particularly useful for day traders and swing traders who rely on candlestick patterns to gauge market sentiment and momentum.
The indicator solves the problem of interpreting raw candlestick data by providing a smoothed visualization through Heikin Ashi candles and a simplified, numerical representation of shadow sizes. This allows traders to quickly assess whether a candle’s upper or lower shadow indicates strong buying or selling pressure, aiding in decision-making for entries, exits, or reversals.
Originality and Usefulness
Originality: While Heikin Ashi candles are a well-known technique for smoothing price data and reducing noise, Malama's Heikin Count introduces a novel feature by calculating and normalizing the sizes of upper and lower shadows relative to the total candle height. Unlike standard Heikin Ashi implementations, which focus solely on candle body trends, this indicator quantifies shadow proportions and presents them on a standardized 1–10 scale. This normalization makes it easier for traders to compare shadow significance across different timeframes and assets without needing to manually interpret raw measurements. The restriction of shadow size labels to the last two days from 9:00 AM ensures relevance for active trading sessions, avoiding clutter from older data.
Usefulness: The indicator is particularly valuable for traders who combine candlestick pattern analysis with trend-following strategies. By integrating Heikin Ashi’s trend-smoothing capabilities with shadow size metrics, it provides a unique perspective on market dynamics. For example, large upper shadows (high normalized values) may indicate rejection at resistance levels, while large lower shadows may suggest support or buying pressure. Unlike other open-source Heikin Ashi indicators, which typically focus only on candle plotting, this script’s shadow size normalization and time-based filtering offer a distinctive tool for intraday and short-term trading strategies.
Detailed Methodology ("How It Works")
The core logic of Malama's Heikin Count revolves around three main components: Heikin Ashi candle calculations, shadow size analysis, and time-based filtering for label display. Below is a breakdown of how these components work together:
Heikin Ashi Candle Calculations:
The script calculates Heikin Ashi candles to smooth price data and reduce market noise, making trends easier to identify.
Formulas:
haClose = (open + high + low + close) / 4: The Heikin Ashi close is the average of the current bar’s open, high, low, and close prices.
haOpen = na(haOpen ) ? (open + close) / 2 : (haOpen + haClose ) / 2: The Heikin Ashi open is either the average of the current bar’s open and close (for the first bar) or the average of the previous Heikin Ashi open and close.
haHigh = max(high, max(haOpen, haClose)): The Heikin Ashi high is the maximum of the current bar’s high, Heikin Ashi open, and Heikin Ashi close.
haLow = min(low, min(haOpen, haClose)): The Heikin Ashi low is the minimum of the current bar’s low, Heikin Ashi open, and Heikin Ashi close.
These calculations produce smoothed candles that emphasize trend direction and reduce the impact of short-term price fluctuations.
Shadow Size Analysis:
The script calculates the upper and lower shadows of each Heikin Ashi candle to assess market sentiment.
Formulas:
upperShadow = haHigh - max(haClose, haOpen): Measures the length of the upper shadow (distance from the top of the candle body to the high).
lowerShadow = min(haClose, haOpen) - haLow: Measures the length of the lower shadow (distance from the bottom of the candle body to the low).
totalHeight = haHigh - haLow: Calculates the total height of the candle (from high to low).
upperShadowPercentage = (upperShadow / totalHeight) * 100: Converts the upper shadow length to a percentage of the total candle height.
lowerShadowPercentage = (lowerShadow / totalHeight) * 100: Converts the lower shadow length to a percentage of the total candle height.
Normalization: The normalizeShadowSize function scales the shadow percentages to a 1–10 range using math.round(value / 10). This ensures that shadow sizes are presented in an easily interpretable format, where 1 represents a very small shadow (less than 10% of the candle height) and 10 represents a very large shadow (90–100% of the candle height). The normalization caps values between 1 and 10 for consistency.
Time-Based Filtering:
The script only displays shadow size labels for candles within the last two days, starting from 9:00 AM each day. This is achieved by calculating a start timestamp using timestamp(year(timenow), month(timenow), dayofmonth(timenow) - daysBack, startHour, startMinute), where daysBack = 2, startHour = 9, and startMinute = 0.
The condition time >= startTime ensures that labels are only plotted for candles within this time window, keeping the chart relevant for recent trading activity and avoiding clutter from older data.
Signal Generation:
The script does not generate explicit buy or sell signals but provides visual cues through shadow size labels. Large upper shadow sizes (e.g., 8–10) may indicate selling pressure or resistance, while large lower shadow sizes may suggest buying pressure or support. Traders can use these metrics in conjunction with the Heikin Ashi candle colors (green for bullish, red for bearish) to make trading decisions.
Strategy Results and Risk Management
Backtesting: The script is an indicator and does not include built-in backtesting or strategy logic for generating buy/sell signals. As such, it does not assume specific commission, slippage, or account sizing parameters. Traders using this indicator should incorporate it into their existing strategies, applying their own risk management rules.
Risk Management Guidance:
Traders can use the shadow size labels to inform risk management decisions. For example, a large upper shadow (e.g., 8–10) at a resistance level may prompt a trader to set a tighter stop-loss above the candle’s high, anticipating a potential reversal. Conversely, a large lower shadow at a support level may suggest a wider stop-loss below the low to account for volatility.
Default settings (e.g., 2-day lookback, 9:00 AM start) are designed to focus on recent price action, which is suitable for intraday and short-term swing trading. Traders should combine the indicator with other tools (e.g., support/resistance levels, trendlines) to define risk limits, such as risking 5–10% of equity per trade.
The indicator does not enforce specific risk management settings, allowing traders to customize their approach based on their risk tolerance and trading style.
User Settings and Customization
The script includes the following user-customizable inputs:
Days Back (daysBack = 2):
Description: Controls the lookback period for displaying shadow size labels. The default value of 2 means labels are shown for candles within the last two days.
Impact: Increasing daysBack extends the time window for label display, which may be useful for longer-term analysis but could clutter the chart. Decreasing it focuses on more recent data, ideal for intraday trading.
Start Hour (startHour = 9) and Start Minute (startMinute = 0):
Description: Defines the start time of the trading day (default is 9:00 AM). Labels are only shown for candles after this time each day within the lookback period.
Impact: Traders can adjust these settings to align with their preferred trading session (e.g., 9:30 AM for U.S. market open). Changing the start time shifts the time window for label display, affecting which candles are analyzed.
These settings allow traders to tailor the indicator to their trading timeframe and session preferences, ensuring that the shadow size labels remain relevant to their analysis.
Visualizations and Chart Setup
The indicator plots the following elements on the chart:
Heikin Ashi Candles:
Plotted using plotcandle(haOpen, haClose, haHigh, haLow), these candles overlay the standard price chart.
Color Coding: Green candles indicate bullish momentum (Heikin Ashi close ≥ open), while red candles indicate bearish momentum (Heikin Ashi close < open).
These candles provide a smoothed view of price trends, making it easier to identify trend direction and continuations.
Shadow Size Labels:
Upper Shadow Labels: Displayed above each candle at the Heikin Ashi high, showing the normalized upper shadow size (1–10). These labels are green with white text and use the label.style_label_down style for clear visibility.
Lower Shadow Labels: Displayed below each candle at the Heikin Ashi low, showing the normalized lower shadow size (1–10). These labels are red with white text and use the label.style_label_up style.
Labels are only shown for candles within the last two days from 9:00 AM, ensuring that only recent and relevant data is visualized.
Debugging Labels (Optional):
A blue label at the bottom of the chart displays the text "Upper: Lower: " for each candle, showing both shadow sizes for debugging purposes. This can be removed or commented out if not needed, as it is primarily for development use.
The visualizations are designed to be minimal and focused, ensuring that traders can quickly interpret the Heikin Ashi trend and shadow size metrics without unnecessary clutter. The use of color-coded candles and labels enhances readability, while the time-based filtering keeps the chart clean and relevant.
Malama's Candle Sniper Malama's Candle Sniper
This Pine Script is an overlay indicator crafted for TradingView to detect and highlight a variety of bullish and bearish candlestick patterns directly on the price chart. Its primary goal is to assist traders in identifying potential reversal or continuation signals by marking these patterns with labeled visual cues. The indicator is versatile, applicable across different markets (e.g., stocks, forex, cryptocurrencies) and timeframes, making it a valuable tool for enhancing technical analysis and informing trading decisions.
Originality and Usefulness
While the candlestick patterns detected by this script are well-established in technical analysis, "Malama's Candle Sniper" stands out due to its comprehensive nature. It consolidates the detection of numerous patterns—ranging from engulfing patterns to doji variations and multi-candle formations—into a single, unified indicator. This eliminates the need for traders to apply multiple individual indicators, streamlining their charting process and saving time.
The indicator’s usefulness lies in its ability to:
Provide Visual Clarity: Labels are plotted on the chart when patterns are detected, offering immediate recognition of potential trading opportunities.
Broad Pattern Coverage: It identifies both bullish and bearish patterns, accommodating various market conditions and trading strategies.
This makes it an ideal tool for traders who incorporate candlestick analysis into their decision-making, whether for spotting trend reversals or confirming ongoing momentum.
How It Works
"Malama's Candle Sniper" operates by defining helper functions in Pine Script that evaluate whether specific candlestick pattern conditions are met for the current bar. Each function returns a boolean value (true/false) based on predefined criteria involving the open, high, low, and close prices of the candles. The script then checks for transitions from false to true (i.e., a pattern newly appearing) and plots a corresponding label on the chart.
Bullish Patterns Detected
The script identifies the following bullish patterns, which typically signal potential upward price movements:
Bullish Engulfing: A small bearish candle followed by a larger bullish candle that engulfs it.
Three White Soldiers: Three consecutive bullish candles with higher closes.
Bullish Three Line Strike: Three bullish candles followed by a bearish candle that doesn’t negate the prior uptrend.
Three Inside Up: A bearish candle, a smaller bullish candle within its range, and a strong bullish confirmation candle.
Dragonfly Doji: A doji with a long lower wick and little to no upper wick, opening and closing near the high.
Piercing Line: A bearish candle followed by a bullish candle that opens below the prior low and closes above the midpoint of the prior candle.
Bullish Marubozu: A strong bullish candle with no upper or lower wicks.
Bullish Abandoned Baby: A bearish candle, a doji gapped below it, and a bullish candle gapped above the doji.
Rising Window: A gap up between two candles, with the current low above the prior high.
Hammer: A candle with a small body and a long lower wick, indicating rejection of lower prices.
Morning Star: A three-candle pattern with a bearish candle, a small-bodied middle candle, and a strong bullish candle.
Bearish Patterns Detected
The script also detects these bearish patterns, which often indicate potential downward price movements:
Bearish Engulfing: A small bullish candle followed by a larger bearish candle that engulfs it.
Three Black Crows: Three consecutive bearish candles with lower closes.
Bearish Three Line Strike: Three bearish candles followed by a bullish candle that doesn’t reverse the downtrend.
Three Inside Down: A bullish candle, a smaller bearish candle within its range, and a strong bearish confirmation candle.
Gravestone Doji: A doji with a long upper wick and little to no lower wick, opening and closing near the low.
Dark Cloud Cover: A bullish candle followed by a bearish candle that opens above the prior high and closes below the midpoint of the prior candle.
Bearish Marubozu: A strong bearish candle with no upper or lower wicks.
Bearish Abandoned Baby: A bullish candle, a doji gapped above it, and a bearish candle gapped below the doji.
Falling Window: A gap down between two candles, with the current high below the prior low.
Hanging Man: A candle with a small body and a long lower wick after an uptrend, signaling potential reversal.
Label Plotting
When a pattern is detected (i.e., its condition transitions from false to true):
Bullish Patterns: A label is plotted at the high of the bar, using a green background with white text and a downward-pointing style (e.g., "Bull Engulf" for Bullish Engulfing).
Bearish Patterns: A label is plotted at the low of the bar, using a red background with white text and an upward-pointing style (e.g., "Bear Engulf" for Bearish Engulfing).
This visual distinction helps traders quickly differentiate between bullish and bearish signals and their precise locations on the chart.
Strategy and Risk Management
Backtesting: "Malama's Candle Sniper" is strictly an indicator and does not include backtesting capabilities or automated trading signals. It does not simulate trades or provide performance statistics such as win rates or profit/loss metrics.
Risk Management: As an informational tool, it lacks built-in risk management features. Traders must independently implement strategies like stop-loss orders, take-profit levels, or position sizing to manage risk when acting on the detected patterns. For example, a trader might place a stop-loss below a Hammer pattern’s low or above a Hanging Man’s high to limit potential losses.
User Settings and Customization
Inputs: The script does not offer user-configurable inputs. All pattern detection logic is hardcoded, meaning traders cannot adjust parameters such as lookback periods or pattern sensitivity through the interface.
Customization: Advanced users with Pine Script knowledge can modify the code directly to:
Add or remove patterns.
Adjust the conditions (e.g., tweak the wick-to-body ratio for a Hammer).
Change label styles or colors.
However, the default version is fixed and ready-to-use as is.
Visualizations and Chart Setup
Plotted Elements:
Bullish Labels: Appear at the candle’s high with a green background, white text, and a downward-pointing arrow (e.g., "Hammer").
Bearish Labels: Appear at the candle’s low with a red background, white text, and an upward-pointing arrow (e.g., "Hanging Man").
Chart Setup: The indicator is configured as an overlay (overlay=true), meaning it integrates seamlessly with the price chart. Labels are displayed directly on the candlesticks, eliminating the need for a separate pane and keeping the focus on price action.
Usage Example
To use "Malama's Candle Sniper":
Add the indicator to your TradingView chart via the Indicators menu.
Observe the price chart for green (bullish) or red (bearish) labels as they appear.
Analyze the context of each pattern (e.g., trend direction, support/resistance levels) to decide on potential trades.
Apply your own entry, exit, and risk management rules based on the signals.
For instance, spotting a "Morning Star" label during a downtrend near a support level might prompt a trader to consider a long position, while a "Dark Cloud Cover" at resistance could signal a short opportunity.

Inside 4+ Candles Box (Entry + Target + SMA Stop Logic)🔍 What This Script Does
This indicator detects price compression areas using 4 or more consecutive inside candles, then draws a breakout box to visually highlight the range.
Once price closes above the box, a long entry marker is plotted, along with:
🎯 Target line at 1x box size above the breakout.
❌ Stop-loss at the box low or at a dynamic SMA-based level if the box is too large.
🧠 Why It’s Unique
This script combines inside bar compression, breakout logic, risk control, and visual clarity — all in one tool.
It also cancels the setup entirely if price closes below the box low before breakout, avoiding late or false entries.
⚙️ Customizable Settings
Minimum inside candles (default = 4)
SMA length (used as stop if box is large)
Box size % threshold to activate smart stop
Entry, Target, and Stop marker colors
📌 Notes
For long setups only (no short signals).
Use on any asset or timeframe (ideal on 4H/1D).
This is not financial advice. Use with proper risk management.
Backtest thoroughly before live use.
Built with ❤️ by using Pine Script v6.
🇸🇦 وصف مختصر باللغة العربية:
هذا المؤشر يكتشف مناطق تماسك السعر من خلال 4 شموع داخلية أو أكثر، ثم يرسم مربعًا يحدد منطقة الاختراق المحتملة.
عند الإغلاق أعلى المربع، يتم عرض إشارة دخول وسطر هدف بنسبة 100% من حجم المربع.
كما يتم احتساب وقف الخسارة تلقائيًا إما عند قاع المربع أو عند متوسط متحرك ذكي (SMA) إذا كان حجم المربع كبيرًا.
الميزة الإضافية: إذا تم كسر قاع المربع قبل الاختراق، يتم إلغاء الصفقة تلقائيًا لتجنب الدخول المتأخر.
🧪 للاستفادة التعليمية والتحليل فقط. لا يُعتبر توصية مالية.

Failure Swing IndicatorIdentify Failure Swing nice and easy
J. Welles Wilder Jr. describes Failure Swings as specific chart patterns used in conjunction with the Relative Strength Index (RSI) to identify potential reversals in price trends.
These patterns signal weakening momentum and can indicate a shift in market direction
Wilder emphasized that these patterns are more reliable when confirmed by price action or other technical indicators.
EMA Pullback Indicator with Volume Confirmationvolume analysis that follows momentum and only enters on pullbacks. Exit at end of next candle

ORB 5M + VWAP + Braid Filter + TP 2R o Niveles PreviosORB 5-Minute Breakout Strategy Summary
Strategy Name:
ORB 5M + VWAP + Braid Filter + TP 2R or Previous Levels
Timeframe:
5-minute chart
Trading Window:
9:35 AM to 11:00 AM (New York time)
✅ Entry Conditions:
Opening Range: Defined from 9:30 to 9:35 AM (first 5-minute candle).
Breakout Entry:
Long trade: Price breaks above the opening range high.
Short trade: Price breaks below the opening range low.
Confirmation Filters (All must be met):
Strong candle (green for long, red for short).
VWAP in the direction of the trade.
Braid Filter by Mango2Juice supports the breakout direction (green for long, red for short).
📉 Stop Loss:
Placed at the opposite side of the opening range.
🎯 Take Profit (TP):
+2R (Risk-to-Reward Ratio of 2:1),
or
Closest of the following: previous day’s high/low or premarket levels.
⚙️ Additional Rules:
Only valid signals between 9:35 and 11:00 AM.
Only one trade per breakout direction per day.
Filter out "trap candles" (very small or indecisive candles).
Avoid trading after 11:00 AM.
📊 Performance Goals:
Maintain a high Profit Factor (above 3 ideally).
Focus on tickers with good historical performance under this strategy (e.g., AMZN, PLTR, CVNA).

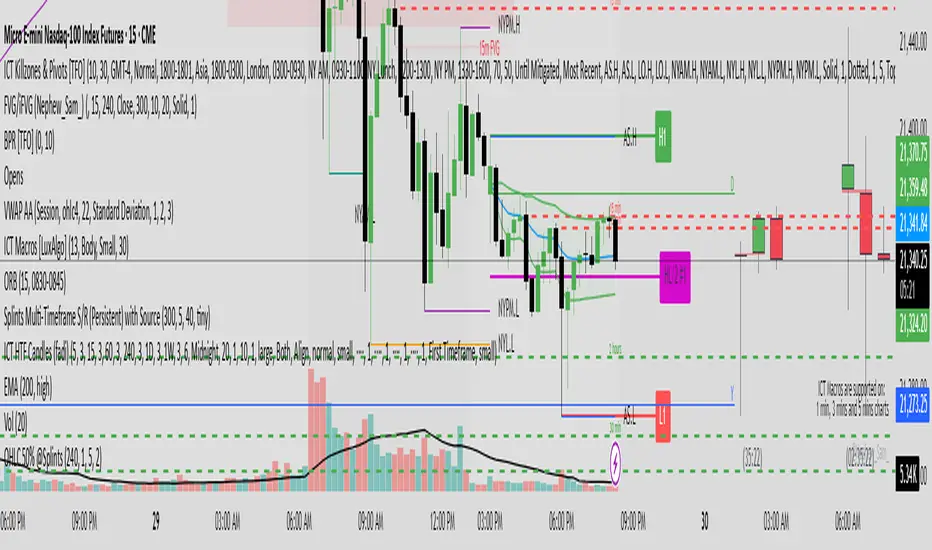
FVG (Nephew sam remake)Hello i am making my own FVG script inspired by Nephew Sam as his fvg code is not open source. My goal is to replicate his Script and then add in alerts and more functions. Thus, i spent few days trying to code. There is bugs such as lower time frame not showing higher time frame FVG.
This script automatically detects and visualizes Fair Value Gaps (FVGs) — imbalances between demand and supply — across multiple timeframes (15-minute, 1-hour, and 4-hour).
15m chart shows:
15m FVGs (green/red boxes)
1H FVGs (lime/maroon)
4H FVGs (faded green/red with borders) (Bugged For now i only see 1H appearing)
1H chart shows:
1H FVGs
4H FVGs
4H chart shows:
4H FVGs only
There is the function to auto close FVG when a future candle fully disrespected it.
You're welcome to:
🔧 Customize the appearance: adjust box colors, transparency, border style
🧪 Add alerts: e.g., when price enters or fills a gap
📅 Expand to Daily/Weekly: just copy the logic and plug in "D" or "W" as new layers
📈 Build confluence logic: combine this with order blocks, liquidity zones, or ICT concepts
🧠 Experiment with entry signals: e.g., candle confirmation on return to FVG
🚀 Improve performance: if you find a lighter way to track gaps, feel free to optimize!

Dual Bollinger BandsIndicator Name:
Double Bollinger Bands (2-9 & 2-20)
Description:
This indicator plots two sets of Bollinger Bands on a single chart for enhanced volatility and trend analysis:
Fast Bands (2-9 Length) – Voilet
More responsive to short-term price movements.
Useful for spotting quick reversals or scalping opportunities.
Slow Bands (2-20 Length) – Black
Smoother, trend-following bands for longer-term context.
Helps confirm broader market direction.
Both bands use the standard settings (2 deviations, SMA basis) for consistency. The transparent fills improve visual clarity while keeping the chart uncluttered.
Use Cases:
Trend Confirmation: When both bands expand together, it signals strong momentum.
Squeeze Alerts: A tight overlap suggests low volatility before potential breakouts.
Multi-Timeframe Analysis: Compare short-term vs. long-term volatility in one view.
How to Adjust:
Modify lengths (2-9 and 2-20) in the settings.
Change colors or transparency as needed.
Why Use This Script?
No Repainting – Uses standard Pine Script functions for reliability.
Customizable – Easy to tweak for different trading styles.
Clear Visuals – Color-coded bands with background fills for better readability.
Ideal For:
Swing traders, day traders, and volatility scalpers.
Combining short-term and long-term Bollinger Band strategies.

Separators & Liquidity [K]Separators & Liquidity
This indicator offers a unified visual framework for institutional price behaviour, combining calendar-based levels, intraday session liquidity, and opening price anchors. It is specifically designed for ICT-inspired traders who rely on time-of-day context, prior high/low sweeps, and mitigation dynamics to structure their trading decisions.
Previous Day, Week, and Month Highs/Lows
These levels are dynamically updated and optionally stop projecting forward once mitigated. Mitigation is defined as a confirmed price interaction (touch or break), and labels visually adjust upon confirmation.
Intraday Session Liquidity Zones
Includes:
Asia Session (18:00–02:30 EST)
London Session (02:00–07:00 EST)
New York AM Session (07:00–11:30 EST)
New York Lunch Session (11:30–13:00 EST)
Each session tracks its own high/low with mitigation logic and duplicate filtering to avoid plotting overlapping levels when values are identical to previous session or daily levels.
Opening Price Anchors
Plots key opens:
Midnight (00:00 EST) (Customizable)
New York Open (09:30 EST) (Customizable)
PM Session Open (13:30 EST) (Customizable)
Weekly Open
Monthly Open
These levels serve as orientation for daily range expansion/contraction and premium/discount analysis.
Time Labels
Includes weekday markers and mid-month labels for better visual navigation on intraday and higher timeframes.
All components feature user-defined controls for visibility, line extension, color, label size, and plotting style. Filtering logic prevents redundant lines and maintains chart clarity.
Originality and Justification
While elements such as daily highs/lows and session ranges exist in other indicators, this script combines them under a fully mitigation-aware, duplicate-filtering, and session-synchronized logic model. Each level is tracked and managed independently, but drawn cooperatively using a shared visual and behavioral control system.
This script is not a mashup but an integrated tool designed to support precise execution timing, market structure analysis, and liquidity-based interpretation within ICT-style trading frameworks.
This version does not reuse any code from open-source scripts, and no built-in indicators are merged. The logic is independently constructed for real-time tracking and multi-session visualization.
Inspiration
This tool is inspired by core ICT concepts and time-based session structures commonly discussed in educational content and the broader ICT community.
It also draws conceptual influence from the TFO Killzones & Pivots script by tradeforopp, particularly in the spirit of time-based liquidity tracking and institutional session segmentation. This script was developed independently but aligns in purpose. Full credit is given to TFO as an inspiration source, especially for traders using similar timing models.
Intended Audience
Designed for traders studying or applying:
ICT’s core market structure principles
Power of Three (PO3) setups
Session bias models (e.g., AM reversals, London continuations)
Liquidity sweep and mitigation analysis
Time-of-day-based confluence planning
The script provides structural levels—not signals—and is intended for visual scaffolding around discretionary execution strategies.

Beta Tracker [theUltimator5]This script calculates the Pearson correlation coefficient between the charted symbol and a dynamic composite of up to four other user-defined tickers. The goal is to track how closely the current asset’s normalized price behavior aligns with, or diverges from, the selected group (or basket)
How can this indicator be valuable?
You can compare the correlation of your current symbol against a basket of other tickers to see if it is moving independently, or being pulled with the basket.... or is it moving against the basket.
It can be used to help identify 'swap' baskets of stocks or other tickers that tend to generally move together and visually show when your current ticker diverges from the basket.
It can be used to track beta (or negative beta) with the market or with a specific ticker.
This is best used as a supplement to other trading signals to give a more complete picture of the external forces potentially pulling or pushing the price action of the ticker.
🛠️ How It Works
The current symbol and each selected comparison ticker are normalized over a custom lookback window, allowing fair pattern-based comparison regardless of price scale.
The normalized values from 1 to 4 selected tickers are averaged into a composite, which represents the group’s collective movement.
A Pearson correlation coefficient is computed over a separate correlation lookback period, measuring the relationship between the current asset and the composite.
The result is plotted as a dynamic line, with color gradients:
Blue = strongly correlated (near +1)
Orange = strongly inverse correlation (near –1)
Intermediate values fade proportionally
A highlighted background appears when the correlation drops below a user-defined threshold (e.g. –0.7), helping identify strong negative beta periods visually.
A toggleable info table displays which tickers are currently being compared, along with customizable screen positioning.
⚙️ User Inputs
Ticker 1–4: Symbols to compare the current asset against (blank = ignored)
Normalization Lookback: Period to normalize each series
Correlation Lookback: Period over which correlation is calculated
Negative Correlation Highlight: Toggle for background alert and threshold level
Comparison Table: Toggle and position controls for an on-screen summary of selected tickers
imgur.com
⚠️ Notes
The script uses request.security() to pull data from external symbols; these must be available for the selected chart timeframe.
A minimum of one valid ticker must be provided for the script to calculate a composite and render correlation.

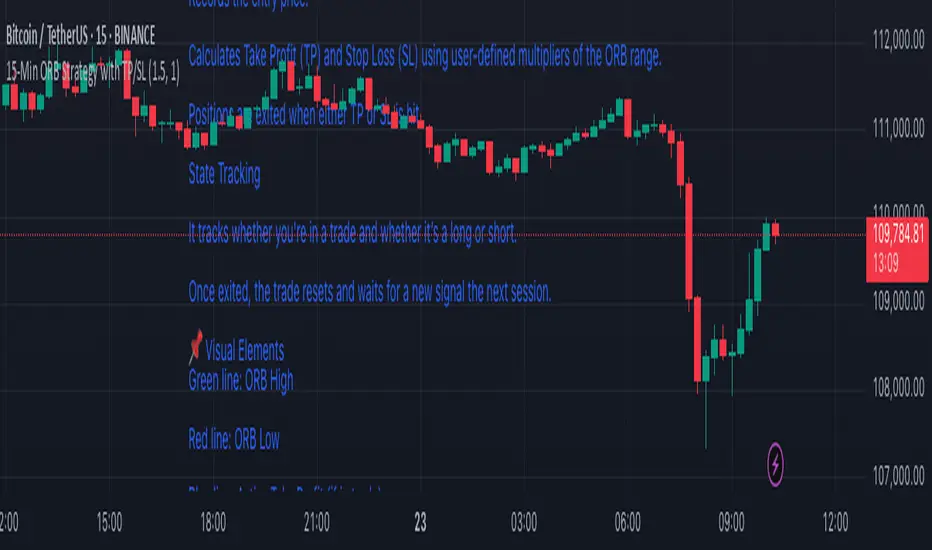
15-Min ORB Strategy with TP/SL
🔧 How It Works
Opening Range Defined
At market open, it tracks the first 15-minute candle.
The high and low of that candle form the Opening Range.
Breakout Detection
A Buy Signal is triggered when price closes above the ORB high (with confirmation).
A Sell Signal is triggered when price closes below the ORB low.
Trade Management
On a confirmed breakout, the script:
Records the entry price.
Calculates Take Profit (TP) and Stop Loss (SL) using user-defined multipliers of the ORB range.
Positions are exited when either TP or SL is hit.
State Tracking
It tracks whether you're in a trade and whether it’s a long or short.
Once exited, the trade resets and waits for a new signal the next session.
📌 Visual Elements
Green line: ORB High
Red line: ORB Low
Blue line: Active Take Profit (if in trade)
Orange line: Active Stop Loss (if in trade)
Buy/Sell Labels: Signal markers below/above candles for clear entry visibility
⚙️ Customizable Inputs
Take Profit Multiplier (default 1.5× ORB range)
Stop Loss Multiplier (default 1.0× ORB range)
Session Start/End time for ORB definition
✅ Ideal For:
Traders who want clean, rule-based signals with no indicators
Quick intraday setups using price action only
Adaptation to almost any liquid market (just adjust session times)
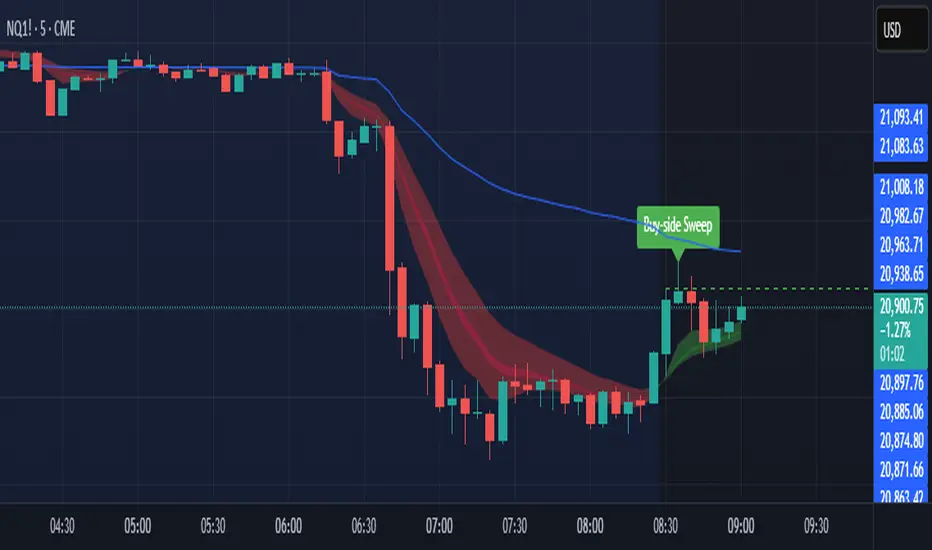
Sniper SweepsPurpose
Detect when price sweeps above recent highs (buy-side liquidity) or below recent lows (sell-side liquidity), but closes back inside the range. This is often interpreted as a stop-hunt or liquidity grab by institutional traders.
Core Concepts
Liquidity Sweep: When price briefly breaks a recent swing high/low (potentially triggering stop losses), but then closes back within the previous range.
Buy-side Sweep: Price breaks a previous high, but closes below it.
Sell-side Sweep: Price breaks a previous low, but closes above it.
Summary
This indicator is useful for:
Identifying potential stop-hunts or liquidity grabs.
Recognizing SMC trade setups around swept highs/lows.
Getting alerted when significant liquidity levels are manipulated.
9 EMA 75% HA Crossover + EMA ReversalThis script identifies potential trend reversal points using Heikin-Ashi candles and the 9-period Exponential Moving Average (EMA). A signal is generated only when:
The 9 EMA reverses direction after a consistent trend (up or down).
The EMA crosses into at least 75% of the Heikin-Ashi candle body.
The highlighted candle must align with the reversal:
Green candle for bullish reversal
Red candle for bearish reversal
This setup helps filter out weak signals by combining price structure, trend behavior, and candle color confirmation.
Smash + Proba + BFThis script is designed to automatically display various levels that can be useful for trading.
These levels must be entered in the script as parameters in the form of lists separated by semicolons (";").
There are three groups of levels:
Smash: Levels provided in the Smashelito newsletter
Proba: Probability levels (50% and 70%) of reaching certain price points, calculated using options data
BF: Option-related levels provided by Krechendo Connect / BlackFlag
Example :

Double Top/Bottom DetectorDouble Top/Bottom Detector Indicator Description
Overview
The Double Top/Bottom Detector is a technical analysis tool designed to automatically identify and label potential double top and double bottom patterns on price charts. By combining pivot point detection with configurable height tolerance and pullback depth criteria, this indicator helps traders visually spot possible trend reversal zones without manual drawing or guesswork.
Key Features
• Pivot Point Identification
The indicator uses a symmetric window approach to find true highs and lows. A pivot high is confirmed only when a bar’s high exceeds the highs of a specified number of bars both before and after it. Likewise, a pivot low is established when a bar’s low is the lowest in its surrounding window.
• Double Top and Double Bottom Detection
– Height Tolerance: Ensures that the two pivot points forming the pattern are within a user-defined percentage of each other.
– Pullback Depth: Measures the drop (for a double top) or the rise (for a double bottom) between the two pivot points and confirms that it meets a minimum percentage threshold.
• Automatic Drawing and Labeling
When a valid double top is detected, a red line connects the two pivot highs and a “Double Top” label is centered above the line. For a double bottom, a green line connects the two pivot lows and a “Double Bottom” label appears below the midpoint.
• Pivot Visualization for Debugging
Small red and green triangles mark every detected pivot high and pivot low on the chart, making it easy to verify and fine-tune settings.
Parameters
Height Tolerance (%) – The maximum allowable percentage difference between the two pivot heights (default 2.0).
Pullback Minimum (%) – The minimum required percentage pullback (for tops) or rebound (for bottoms) between the two pivots (default 5.0).
Pivot Lookback – The number of bars to look back and forward for validating pivot points (default 5).
Window Length – The number of bars over which to compute pullback extrema, equal to twice the pivot lookback plus one (default derived from pivot lookback).
Usage Instructions
1. Copy the Pine Script code into TradingView’s editor and select version 6.
2. Adjust the parameters based on the asset’s volatility and timeframe. A larger lookback window yields fewer but more reliable pivots; tighter height tolerance produces more precise pattern matches.
3. Observe the chart for red and green triangles marking pivot highs and lows. When two qualifying pivots occur, the indicator draws a connecting line and displays a descriptive label.
4. To extend the number of visible historical lines and labels, increase the max\_lines\_count and max\_labels\_count settings in the indicator declaration.
Customization Ideas
• Add volume or moving average filters to reduce false signals.
• Encapsulate pivot logic into reusable functions for cleaner code.
• Incorporate alert conditions to receive notifications when new double top or bottom patterns form.
This indicator is well suited for medium- to long-term analysis and can be combined with risk management rules to enhance decision making.
Rollover Candles 23:00-00:00 UTC+1This indicator highlights the Forex Market Rollover candles during which the spreads get very high and some 'fake price action' occurs. By marking them orange you always know you are dealing with a rollover candle and these wicks/candles usually get taken out later on because there are no orders in these candles.
Optimal settings: The rollover takes only 1 hour, so put the visibility of the indicator on the 1 hour time frame and below (or just the 1h).
Calendar TableThis script displays a calendar-style visual grid directly on the TradingView chart. Unlike fundamental calendars or event indicators, this tool does not mark earnings, news, or economic data. Instead, it provides a simple and clean visual calendar layout for better understanding of date structures across timeframes.
The purpose of this script is purely visual – helping traders and analysts recognize monthly, weekly, and daily boundaries in a calendar format. It’s especially useful for visually aligning price action with time cycles, month-start effects, or periodic strategies.
✅ Key Features
🗓️ Calendar Grid Overlay
Displays calendar-style lines or boxes across candles based on real date logic (year, month, day).
📦 Minimalist Design
Non-intrusive layout that doesn’t interfere with price action or indicators.
⏳ Timeframe-Aware
Adjusts the calendar structure to match the selected chart timeframe.
🎨 Custom Styling Options
Choose line colors, label sizes, and boundary highlights.
⚙️ How to Use
Add the script to your chart.Adjust the visual style and frequency in the settings .
⚠️ Notes
This script does not fetch news, earnings, or events.
It is purely a static calendar layout based on date/time.
No user-defined events, reminders, or alerts are included.
📄 Licensing
This script is Protected Script its only for educational and analytical use.

OHLC 0.5 @SplintsThis indicator provides a dynamic visualization of OHLC levels, allowing traders to analyze price action across multiple candles with enhanced clarity. It features customizable options for timeframe selection, candle count, and mid-level calculations (High/Low 50% and Open/Close 50%). The script utilizes gradient-based coloring for a clear distinction between levels and supports dynamic extension for better visibility.
Key Features:
Displays Open, High, Low, and Close levels with adjustable extension lengths
Supports mid-level calculations for enhanced trade decision-making
Gradient coloring for improved visual clarity across multiple candles
Configurable labels for quick reference to key price points
Efficient object management using arrays for optimized performance
Perfect for traders seeking structured insights into candle dynamics and session-based analysis.
Swing Highs and Lows Detector🔍 Swing Highs and Lows Detector
The Swing Highs and Lows Detector is a powerful tool for traders looking to identify meaningful structural shifts in price action, based on swing point logic and internal trend shifts.
📈 What It Does
This indicator automatically identifies and labels:
HH (Higher High) – Price broke above the previous swing high
LH (Lower High) – Price failed to break the previous high, signaling potential weakness
LL (Lower Low) – Price broke below the previous swing low
HL (Higher Low) – Price maintained a higher support level, indicating strength
The script distinguishes between bullish and bearish internal shifts and tracks the highest/lowest points between those shifts to determine the swing structure.
⚙️ How It Works
You can choose between two shift detection modes:
"Open": Compares closing price to the first open of the opposite streak
"High/Low": Uses the high of bearish or low of bullish candles
Once a shift is confirmed, the indicator scans the bars between shifts to find the most significant swing high or low
When a valid swing is detected, it’s labeled directly on the chart with color-coded markers
🛎️ Built-in Alerts
Set alerts for:
Higher High
Lower High
Lower Low
Higher Low
These alerts help you catch key structural shifts in real time — great for breakout traders, structure-based analysts, and smart money concepts (SMC) strategies.
✅ How to Use
Confirm Trend Strength or Reversals – Use HH/HL to confirm an uptrend, LL/LH to confirm a downtrend
Combine with Liquidity Sweeps or Zones – Ideal for SMC or Wyckoff-style setups
Entry/Exit Triggers – Use swing breaks to time entries or exits near key structural points

Failed 2s - The StratDescription:
This indicator detects and highlights "Failed 2" candlestick patterns from The Strat methodology — key price action setups signaling potential reversals or continuation points. It automatically identifies Failed 2 Down (Failed 2D) and Failed 2 Up (Failed 2U) signals by analyzing two consecutive bars, with special attention to price interaction at the 50% midpoint of the previous candle.
Visuals:
- Green upward triangles mark Failed 2 Down signals (bullish setups).
- Red downward triangles mark Failed 2 Up signals (bearish setups).
- Special signals that touch the 50% midpoint of the previous candle are emphasized but use the same shapes.
Alerts:
Built-in alert conditions let you receive notifications when these patterns occur, so you never miss a trade opportunity.
How to Use ALERTS in TradingView
- Paste this code into Pine Editor on TradingView.
- Click Add to Chart.
Set alerts:
- Click "Alerts" → "Condition" = your indicator name
- Choose the alert type (e.g. "Failed 2D Bar Alert")
- Set "Once per bar close"
- Customize the notification method (pop-up, app, email, etc.)
ATS LOGIC CHART EXPERT V5.0### **ATS Logic Chart Expert V5.0**
#### **Wyckoff-Inspired Automated Trend & Structure Analysis Tool**
---
### **🔹 Overview**
**ATS Logic Chart Expert V5.0** is an advanced Wyckoff-based charting indicator designed for automated trend analysis, support/resistance mapping, and breakout signal generation. It intelligently plots key price structure lines and identifies high-probability reversal signals using the Wyckoff accumulation/distribution model (LPS/LPSY), making it ideal for both swing traders and trend followers.
---
### **🔹 Key Features**
#### **1️⃣ Automated Price Structure Lines**
- **Smart detection of swing highs/lows** with auto-plotting of critical support/resistance
- **White Dashed Line (Resistance)** – Formed by prior downtrends, marks potential breakout zones
- **Red Dashed Line (Support)** – Derived from uptrends, signals breakdown risks
- **Up/Down Triangle Markers** – Highlight key pivot points for manual S/R refinement
#### **2️⃣ Wyckoff LPS/LPSY Signal Engine**
| **Signal** | **Trigger Condition** | **Market Implication** |
|------------|----------------------|-----------------------|
| **LPS (Last Point of Support)** | Break above white resistance (confirms accumulation) | Bullish trend initiation |
| **CVG LPS (Covered LPS)** | Retest & second breakout | Stronger bullish confirmation |
| **LPSY (Last Point of Supply)** | Breakdown below red support (confirms distribution) | Bearish trend initiation |
| **CVG LPSY (Covered LPSY)** | Pullback & second breakdown | Stronger bearish confirmation |
#### **3️⃣ Breakout Signals (BK1/SK1)**
- **BK1 (Breakout 1)** – First close above white resistance, early long opportunity
- **SK1 (Short Kill 1)** – First close below red support, early short opportunity
- **Optimized for momentum traders** to capture initial trend acceleration
---
### **🔹 Signal Logic Deep Dive**
#### **📈 Bullish Scenario (LPS / BK1)**
1. **Accumulation Phase**: Price consolidates near lows, forming a base
2. **Breakout**: Price breaches white resistance → triggers **LPS** or **BK1**
3. **Retest Reinforcement**: Successful retest & rebound → confirms **CVG LPS**
#### **📉 Bearish Scenario (LPSY / SK1)**
1. **Distribution Phase**: Price churns near highs, creating topping patterns
2. **Breakdown**: Price cracks red support → triggers **LPSY** or **SK1**
3. **Pullback Reinforcement**: Failed rebound → confirms **CVG LPSY**
---
### **🔹 Practical Applications**
✅ **Trend Trading**: Ride LPS/LPSY-confirmed trends
✅ **Reversal Trading**: Fade extremes with BK1/SK1 early alerts
✅ **S/R Trading**: Use auto-plotted lines for limit orders
---
### **🔹 Customization Tips**
- **Adjust sensitivity**: Modify swing point detection periods per asset volatility
- **Signal filters**: Combine with moving averages/volume for fewer false breaks
---
### **🔹 Conclusion**
**ATS Logic Chart Expert V5.0** delivers:
- **Hands-free structure mapping** (no manual drawing)
- **Institutional-grade reversal signals** (Wyckoff LPS/LPSY)
- **First-mover advantage** (BK1/SK1 early entries)
> ⚠️ **Risk Note**: Always use stop-losses. Backtest for optimal settings in ranging markets.
---
**Ideal For**:
• Wyckoff method practitioners
• Price action traders
• Breakout strategy enthusiasts

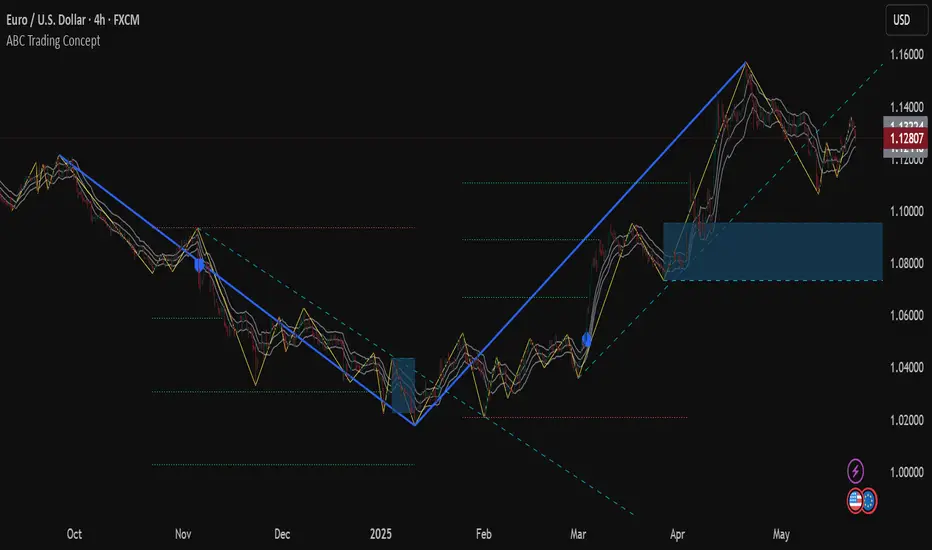
ABC Trading ConceptOverview
ABC Trading Concept is a wave- and trend-based market structure indicator that identifies shifts in price behavior by analyzing impulse and correction patterns. It introduces a unique calculation method—Price-MAD-ATR Bands—to detect wave formation, trend reversals, and potential trade zones with dynamic adaptability to volatility and trend strength.
🔧 Core Logic and Calculations
1. Price-MAD-ATR Bands
At the heart of the script is a proprietary channel system based on:
MAD (MA Difference): Difference between fast and slow moving averages.
ATR (Average True Range): Measures current market volatility.
The bands are plotted as:
Upper Band = Price + MAD × ATR
Lower Band = Price − MAD × ATR
A breakout beyond these bands signals the formation of a new wave (up or down).
2. Wave Formation (A and B Waves)
Standard Method: A new wave forms when price breaks through a Price-MAD-ATR Band.
Extreme Method: A wave also forms when price breaks the passive extremum of an existing wave.
Wave A may be generated by a correction breaking the Reversal Point.
Wave B can be configured to form in three modes, including breakouts of internal or boosted counter-corrections.
3. Trend Structure
A trend is built from waves and includes:
Direction, active/passive extremums
Impulses and Corrections (each tracked independently)
Reversal Point: Defined by a boosted correction breakout
G-Point: Set at the active extremum of Wave A
Vic Line: A trendline derived from previous correction extremums (optional)
When price breaks above the G-point, a new trend may be initiated.
4. Correction Boost Logic
A correction becomes boosted when price exceeds a configurable multiple of the correction’s range. Boosted corrections define key zones and enable the creation of Reversal Points and Wave A setups.
5. Vic Sperandeo Line
Optionally used to enhance trend structure confirmation. Drawn between extremums of previous corrections and may act as a secondary condition for forming Wave A.
6. SL/TP Level Calculation
At the start of a new trend, SL and TP levels are automatically plotted based on:
The extremums of Wave A or Wave B (selectable)
Configurable ratios (e.g., 1.382, 2.0, 2.618 for TP levels)
📊 Visual Elements on the Chart
Bands: Price-MAD-ATR Bands as adaptive upper/lower thresholds
Waves: Yellow zigzag lines
Trends: Blue (or purple for hard-type) trendlines with directional arrow
Reversal Point: Dashed horizontal line (starts from key correction breakout)
Correction Zone: Shaded rectangle from boosted correction range
Vic Line: Dashed support/resistance trendline
TP/SL Levels: Dotted horizontal levels, plotted at trend origin
⚙️ Inputs and Customization
You can adjust:
ATR and MA parameters
Band width multiplier
Boost strength threshold for corrections
SL/TP levels and logic (by Wave A or B)
Vic Line usage and visual styles for each element
Over 40 configurable settings are available to adapt the indicator to your strategy.
🧠 How to Use
Look for a new trend start when G-point is broken.
Use Wave A/B structure and Reversal Point for setup planning.
Correction Zones help identify re-entry areas or stop placement.
Follow TP/SL levels to manage exits with structural targets.
The Vic Line can act as dynamic support/resistance in context.
The indicator provides analytical insights—it does not generate automatic signals.
💡 What Makes It Unique
Unlike typical wave or Zigzag indicators, ABC Trading Concept introduces a volatility-adjusted wave logic using Price-MAD-ATR Bands. This method combines trend momentum (MA differential) with market volatility (ATR), offering a more flexible and noise-resistant structure recognition system. The integration of Wave A/B logic, dynamic reversal zones, and Vic Line validation makes it a comprehensive tool for structural traders.
⚠️ Disclaimer
This tool is for technical analysis and educational purposes. It does not guarantee profit or forecast market direction. Trading involves risk—use this script as part of a larger strategy with proper risk management.