Auto Trendlines [AlgoXcalibur]Effortlessly visualize trendlines.
This algorithm does more than just draw lines connecting structural swing points — it reveals dynamic support & resistance breakouts with clarity and precision while significantly reducing your workload compared to the hassle of manually drawing trendlines.
🧠 Algorithm Logic
This advanced Auto Trendlines indicator delivers clear market structure through an intelligent multi-fractal design, revealing useful swing structures in real time. For those seeking maximum awareness, the optional Micro Trendlines (Dotted) constantly monitors even the most recent and minor structural shifts — keeping you fully in tune with evolving market dynamics. A Break Detection Engine constantly monitors each trendline and provides instant visual feedback when structural integrity is lost: broken lines turn gray, stop extending, and remain visible to enhance clarity and situational awareness. The algorithm is carefully refined to prevent chart distortion commonly caused by forcing entire trendline structures into view — preserving a natural and accurate charting experience. To further ensure optimal readability, an integrated Clutter Control mechanism limits the number of visible trendlines — focusing attention only on the most relevant structures.
⚙️ User-Selectable Features
• Micro Trendlines (Dotted): Ultra-responsive short-term trendlines that react to even the smallest structural shifts — ideal for staying ahead of early trend changes.
• Broken Trendline Declutter: Enable to display only the most recent broken trendlines to simplify chart visuals and maintain clarity, or disable to analyze previous price action.
💡 Modern Innovation
Auto Trendline indicators are often inaccurate, clumsy, and rely on slow methods that fail to adapt. AlgoXcalibur’s Auto Trendline indicator takes a modern, refined approach — combining smart pivot logic for both speed and stability, dynamic break detection with clear visual cues, and displaying only the most relevant trendlines while prioritizing accuracy, preventing distortion, and reducing clutter — automatically.
🔐 To get access or learn more, visit the Author’s Instructions section.
Chart patterns

RSI OS/OB Background StripesThe "RSI OS/OB Background Stripes" indicator is a simple tool designed to help traders visualize overbought and oversold market conditions using the Relative Strength Index (RSI). It highlights these conditions by displaying colored background stripes directly on your chart, making it easy to spot potential trading opportunities.
How It Works:RSI Calculation: The indicator calculates the RSI, a popular momentum indicator that measures the speed and change of price movements, using a default period of 14 (customizable).
Overbought/Oversold Levels: It marks areas where the RSI is above a user-defined overbought level (default: 70) with red background stripes, and below an oversold level (default: 30) with green background stripes.
Visual Feedback: The colored stripes appear on the chart when the RSI enters overbought (red) or oversold (green) zones, helping you quickly identify market conditions.
Customization: You can adjust the RSI period, overbought/oversold levels, background colors, and transparency. You can also choose to show the RSI line in a separate panel or display RSI values on the chart for debugging.
Alerts: The indicator includes optional alerts that notify you when the RSI crosses into overbought or oversold territory.
Who It’s For: This indicator is perfect for beginner and intermediate traders who want a clear, visual way to track RSI-based overbought and oversold conditions without cluttering their charts.
Key Features:Easy-to-read background stripes for overbought (red) and oversold (green) conditions.
Fully customizable RSI settings, colors, and transparency.
Optional RSI plot and value display for deeper analysis.
Alerts to keep you informed of key RSI level crossings.
This indicator is a straightforward way to monitor market momentum and make informed trading decisions.

GeeksDoByte 15m & 30m ORB + Prev Day High/LowCME_MINI:NQ1!
How It Works
Opening Ranges
At 9:30 ET, the script begins tracking the high & low.
It uses two fixed sessions:
15 min from 09:30 to 09:45
30 min from 09:30 to 10:00
On the very first bar of each session it initializes the range, then continuously updates the high/low on each new intraday bar.
Dashed lines are drawn when the session opens and extended horizontally across subsequent bars.
Previous Day’s Levels
Independently, it fetches yesterday’s high and low via a daily security call.
These historic levels are plotted as simple horizontal lines for daily context.
How to Use
Breakout Entries
A close above the 15 min ORB high can signal an early breakout; a further push above the 30 min ORB high confirms extended momentum.
Conversely, breaks below the respective lows can indicate short setups.
Support & Resistance
Yesterday’s high/low often act as magnet levels. If price is near the previous high when the opening ranges break, you get a confluence zone worth watching.
Trade Management
Combine the two opening-range levels to tier your stops or scale in.
For example, you might place an initial stop below the 15 min low and a wider stop below the 30 min low.

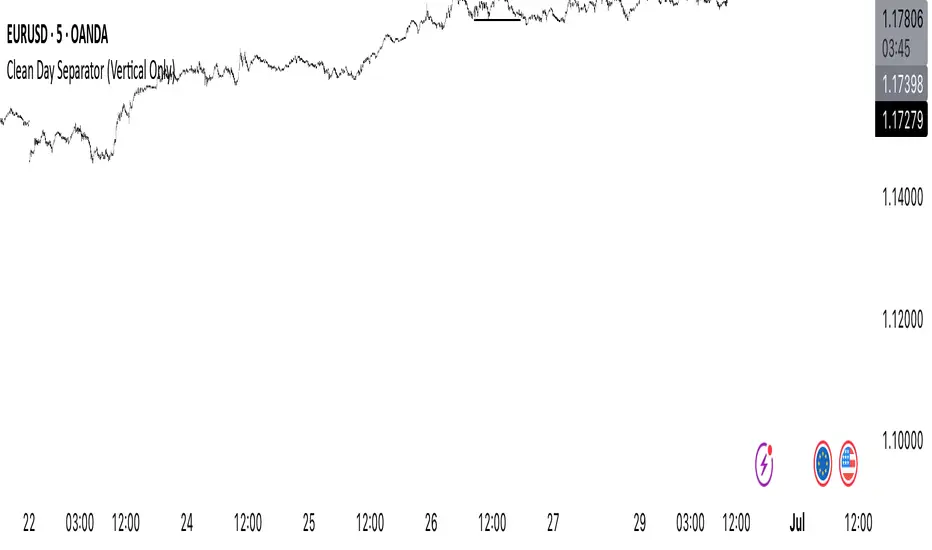
Clean Day Separator (Vertical Only)Clean Day Separator (Vertical Only) is a minimalist indicator for traders who value clarity and structure on their charts.
This tool draws:
✅ Vertical dashed lines at the start of each new day
✅ Optional day-of-week labels (Monday, Tuesday, etc.)
It’s designed specifically for clean chart lovers — no horizontal lines, no boxes, just what you need to mark time and keep your focus.
Perfect for:
Intraday traders who track market rhythm
Price action purists
Anyone who wants to reduce visual noise
Customizable settings:
Toggle day labels on/off
Choose line and text colors
Set label size to match your chart style
AlgoChadLin's BITCOIN H1 Breakout Strategy No.545Strategy Overview
AlgoChadLin's BITCOIN H1 Breakout Strategy No.545 is a sophisticated breakout trading system designed for Bitcoin on the H1 timeframe. It integrates multiple volatility and price action indicators to identify high-probability breakout opportunities, aiming to capitalize on significant market movements.
Auther: @algochadlin
Strategy Logic
Breakout Confirmation: Utilizes a combination of Average True Range (ATR) and Bollinger Bands to identify periods of low volatility followed by sharp price movements.
Long: Initiated when the price breaks above the previous hour's upper Bollinger Band, with ATR confirming increased volatility.
Short: Triggered when the price breaks below the previous hour's lower Bollinger Band, with ATR indicating heightened volatility.
Parameters
Price Entry Multiplier: Adjusts the entry price relative to the breakout level.
Exit After Bars: Specifies the number of bars to hold the position before exiting.
Profit Target (%): Defines the percentage gain at which to take profit.
Stop Loss Coefficient: Multiplier for ATR to calculate stop-loss distance.
Trailing Stop Coefficients: Defines the trailing stop parameters.
Biggest Range Period: Determines the lookback period for identifying the largest price range.
Setup
Timeframe: 1-Hour (H1)
Asset: Bitcoin, also suitable for ETH

Hourly Markers 09:00 - 20:00 Adjusted for UTC+2A line for every hour from 0900 to 2200
Description:
This TradingView Pine Script plots small red markers (downward arrows) at the top of the chart for every full hour between 09:00 AM and 08:00 PM (20:00) based on UTC+2 time. The markers appear precisely at the opening minute of each hour within the defined range, helping traders visually track key time intervals during the day.
Features:
✔ Displays markers from 09:00 to 20:00 local time (UTC+2 adjustment)
✔ Only plots markers at the first minute of each hour
✔ Uses clear, unobtrusive triangle-down symbols above the bars
✔ Works on any chart timeframe that captures hourly intervals
Use Case:
Ideal for traders who want a quick visual reference of hourly intervals during the main trading hours, especially when working with charts set to UTC or different time zones.

Macro+ ExtMacros+ (Time Sessions & Alerts)
Macros+ is a powerful and highly customizable tool designed to highlight specific time windows—often referred to as "macros"—directly on your chart. It is built for traders who operate on time-based strategies, such as those targeting specific liquidity periods like the ICT Silver Bullet or other institutional timeframes.
By visualizing these key sessions historically and in real-time, traders can better anticipate market volatility, identify potential trade setups, and maintain discipline. The script is clean, efficient, and built with flexibility in mind.
Key Features
This indicator goes beyond simple time boxes and includes several advanced features to fit your specific trading style:
1. Historical & Real-Time Display
The script is designed to plot all selected macro sessions across the entire historical data loaded on your chart, not just the current day. This allows for comprehensive backtesting and analysis of how price behaves during these specific time windows.
2. Fully Customizable Macro Sessions
You have full control over which time sessions you want to display. The indicator includes 14 pre-configured 20-minute sessions, which you can easily toggle on or off from the settings menu. This allows you to focus only on the timeframes that are relevant to your strategy.
3. Adjustable "Extended Macro" Time
Flexible Time Extension: Instead of a fixed session duration, you can now dynamically extend the start and end times of all macros.
Numerical Input: In the settings, under "Time Settings," you'll find an "Extend Minutes" input. This number lets you add minutes to both the beginning and the end of each session.
Example: A standard macro from 09:50 - 10:10 with an "Extend Minutes" value of 5 will be automatically adjusted to 09:45 - 10:15. Setting it to 0 will keep the default 20-minute sessions.
4. Multiple Display Styles
Adapt the indicator's appearance to your preference for a clean and readable chart. All styles are designed to span the full vertical height of the chart for maximum visibility.
Solid Line: Clear, solid vertical lines marking the start and end of a session.
Dashed Line: A more subtle, dashed-line alternative.
Dotted Line: The most subtle line style for a minimalist chart.
Background: Fills the entire session window with a semi-transparent color.
Outline: Draws a colored border around the session window without filling it.
5. Real-Time Alerts
Never miss the start of a key session again. You can enable an alert that will trigger once at the beginning of any active macro session. This is perfect for traders who may not be watching the charts constantly.
6. Timezone Correction
All times are calculated based on the timezone you select in the settings (default is "America/New_York"). This ensures the sessions are always plotted accurately according to the market you are trading (e.g., New York session times).
How to Use
Add to Chart: Add the "Macros+" indicator to your chart.
Open Settings:
General Settings: Choose your preferred Timezone, Display Style, and Color.
Active Macro Sessions: Check the boxes for the time sessions you wish to monitor.
Time Settings: Enter a value in Extend Minutes if you want to widen the time windows. A value of 5 will create 30-minute sessions.
Alert Settings: Enable the Alert On Macro Start option if you wish to receive alerts.
Create Alert: To activate the pop-up alert, click the clock icon on the TradingView right-hand panel, select "Macros+" in the "Condition" dropdown, choose "Sesi Makro Dimulai," and set it to trigger "Once Per Bar."
This tool was designed to be both powerful and user-friendly. I hope it becomes a valuable part of your trading toolkit. Happy trading!

Operator Levels by Trade InsiderOperator Levels by Trade Insider
Overview
Operator Levels by Trade Insider is a breakout trading strategy designed for intraday trading on the Nifty 50 index using a 5-minute timeframe. It identifies high-probability trade setups based on the first 5-minute candle’s price range of the day, generating target levels for long and short positions. The strategy uses a customizable Simple Moving Average (SMA) for trend filtering and a strict 1:1.5 risk-to-reward validation, making it ideal for intraday traders in the Indian equity market.
Key Features
Dynamic Target Levels: Plots two sets of target levels above and below the first 5-minute candle’s range, calculated using a proprietary volatility-based multiplier to project realistic price objectives.
Trend Filtering: Uses a user-adjustable SMA (default: 24 periods) to ensure entries align with the prevailing market trend, reducing false breakouts.
Risk-to-Reward Validation: Only executes trades with a minimum 1:1.5 risk-to-reward ratio, promoting disciplined risk management.
Clean Visualization: Displays target levels as dashed lines with color-coded labels for easy identification of trade exits (Target 1, Target 2, Stop-Loss).
Customizable Settings: Allows adjustment of SMA period, position size, and risk parameters to suit different trading styles and market conditions.
What Makes It Unique?
Unlike standard breakout strategies, Operator Levels employs a proprietary multiplier derived from volatility analysis to optimize target levels for the Nifty 50’s intraday movements. The adjustable SMA period and strict 1:1.5 risk-to-reward filter enhance entry precision, reducing noise compared to traditional range breakout systems. The strategy’s minimalist design ensures actionable signals without overwhelming the chart, tailored specifically for the fast-paced 5-minute timeframe.
How to Use
Setup: Apply on a 5-minute chart for the Nifty 50 index (e.g., NSE:NIFTY). Recommended for intraday trading.
Default Settings:
Position Size: 5% of equity per trade (adjustable via default_qty_value).
SMA Period: 24 (adjustable; e.g., set to 12 for faster signals or 50 for smoother trends).
Risk-to-Reward: 1:1.5 minimum for all trades.
Trading Process:
Long Entry: Triggered when price breaks above the first 5-minute candle’s high, is above the SMA, and meets the 1:1.5 risk-to-reward ratio.
Short Entry: Triggered when price breaks below the first 5-minute candle’s low, is below the SMA, and meets the 1:1.5 risk-to-reward ratio.
Exits: Close positions at Target 1, Target 2, or Stop-Loss, with alerts set via TradingView for real-time notifications.
Integration: Combine with volume analysis or support/resistance indicators (e.g., RSI, pivot points) for confirmation of breakouts.
Example: On a Nifty 50 5-minute chart, enter a long trade when price breaks above the first candle’s high and is above the 24-period SMA, targeting the first dashed blue line (Target 1) with a stop-loss at the first candle’s low.
Backtesting Results
Test Parameters:
Symbol: NSE:NIFTY, 5-minute timeframe
Period: 6 months (January 2025–June 2025)
Initial Capital: $10,000
Commission: 0.1% per trade
Slippage: 5 ticks
Risk per Trade: 5% of equity
Results:
Total Trades: 150
Win Rate: 62%
Average Risk-to-Reward: 1.5:1
Notes: Results are based on standard candles to ensure realistic performance. Backtest on your preferred timeframe and symbol to validate suitability.
Limitations
Trade Frequency: The 5-minute timeframe generates more trades than daily charts but may still require active market sessions (e.g., 9:15 AM–3:30 PM IST) for optimal results.
Market Conditions: Breakouts may underperform in low-volatility or ranging markets; use additional confirmation (e.g., volume spikes or Nifty 50 futures data) to filter signals.
Risk Management: While the 1:1.5 risk-to-reward ratio is conservative, traders should back test and adjust position sizing and SMA period to match their risk tolerance.

Open Range Breakout (ORB) with Alerts
🚀 ChartsAlgo – Open Range Breakout (ORB) with Alerts
The Open Range Breakout (ORB) Indicator by ChartsAlg is designed for intraday traders looking to capitalize on price movements after the market’s opening range. This tool is especially effective for futures (MNQ, MES) and high-volatility stocks or crypto where initial volatility sets the tone for the session.
This indicator identifies a user-defined opening range window, plots the high/low lines of that range, and visually alerts users when price breaks out above or below the range — with options to customize breakout repetitions, background fill, and alerts.
💡 What is an Open Range Breakout (ORB)?
The opening range represents the high and low established during the first few minutes of the trading session — usually 15 or 30 minutes. Many intraday strategies are based on the idea that breaking out of this initial range often signals strong momentum and trend continuation.
Traders often enter:
Long when price breaks above the range high.
Short when price breaks below the range low.
⚙️ How It Works
You define a session window (e.g., 09:30–09:45 EST).
The indicator tracks the high and low during this time.
Once the session ends, the high and low become your range breakout levels.
The indicator then:
Plots lines for visual clarity
Optionally fills background between the range
Triggers breakout signals if price crosses the levels
Provides alerts when breakouts occur
🛠️ Settings Breakdown
🔹 Session Settings
Range Session: Set your preferred window (e.g., 0930–0945). Can be premarket, first 30 mins, or any custom time.
Time zone: Use "America/New York" for EST (default) or change to "GMT+0" for international traders.
🔹 Breakout Settings
Bullish Breakout Signals: Number of allowed breakout alerts above the range.
Bearish Breakout Signals: Number of allowed breakout alerts below the range.
This prevents repeated alerts once breakout has been confirmed.
🔹 Display Settings
Show Background Fill: Fills area between high/low of the range for easier visual analysis.
Show Breakout Signals: Triangle markers plotted on the chart when breakouts happen.
Only Show Today’s Range: Keeps the chart clean by showing only the most current day’s range.
🔹 Color Settings
Range High/Low Line Colors: Choose any color for clarity.
Range Fill Color: Customize the highlight area for your chart style.
📊 Chart Features
Range High/Low Lines: Automatically plotted after range session ends.
Visual Fill Box: Optional background shading between the opening range.
Triangle Breakout Markers: Appear at the breakout candle.
Alerts: Can be used with TradingView’s alert system to notify you of breakouts in real-time.
🔔 Alerts
Two alert conditions are built in:
Bullish Breakout: Triggers when price breaks above the high of the range.
Bearish Breakout: Triggers when price breaks below the low of the range.
Example Alert Message:
📈 “Bullish Breakout above Open Range on AAPL!”
To activate:
Click “🔔 Alerts” on TradingView.
Set condition to this script.
Choose “ORB Breakout Up” or “ORB Breakout Down”.
Choose alert frequency and notification method.
⚠️ DISCLAIMER
ChartsAlgo tools are for informational and educational purposes only.
They are not financial advice or signals. Past performance does not guarantee future results. Use at your own risk and always implement solid risk management.
By using this indicator, you agree that you are solely responsible for any trades or decisions made based on the information provided.

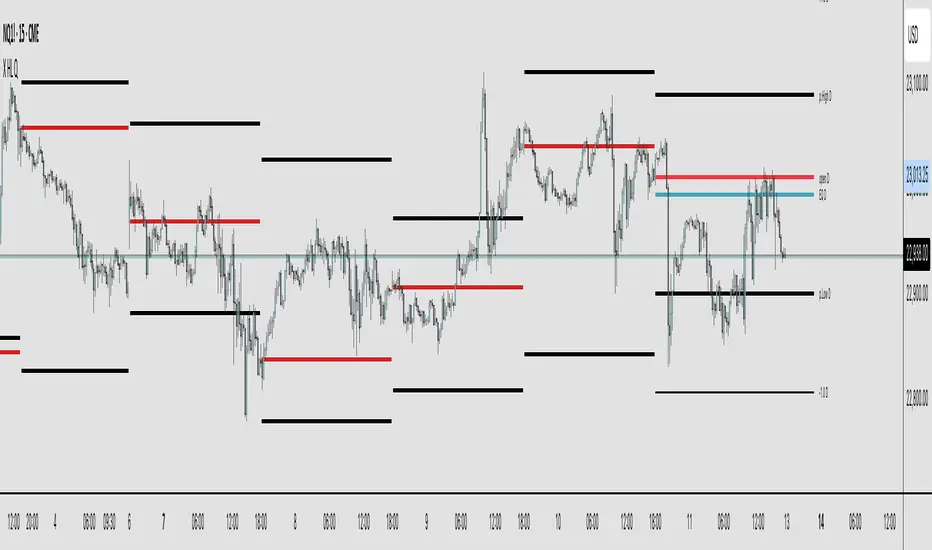
X HL QA market structure tool designed to frame price action within a defined context of prior session dynamics. It accomplishes this by anchoring a set of reference levels to the high, low, and open prices of a user-specified higher timeframe (e.g., 4H, 1D, etc.) and projecting those levels onto the current chart for ongoing analysis.
At its core, the indicator establishes a reference range—derived from the previous completed instance of the selected timeframe—and overlays this on the current timeframe. This range serves as a foundational structure for price interpretation in the current session.
Building upon this framework, the script constructs a set of symmetrical quadrants (or deviation zones) both inside and outside of the prior range. These include:
The midpoint (EQ) of the prior range
Levels at ±0.25x, ±0.75x, ±1.0x, ±1.5x, and ±2.0x the range height
These levels act as contextual zones that traders can use to interpret price behavior—whether it's consolidating within the prior range, approaching fair value (EQ), or expanding into directional continuation or reversal zones beyond the range.
The script operates in both real-time and historical contexts. On live bars, it dynamically updates the key levels to provide an evolving view of current price positioning. Simultaneously, it supports the display of historical levels for past sessions, enabling robust backtesting and comparative analysis of price behavior relative to previous quadrant structures.
Ultimately, this tool serves as a positional map, helping traders assess where price is trading relative to significant levels from the prior session, offering insights into potential support/resistance, overextension, or mean reversion scenarios.
Key Technical Features
Multi-Timeframe Support:
request.security() is used to pull data from a user-defined higher timeframe regardless of the current chart interval.
Visual Flexibility:
Toggle between "line" and "channel" mode.
Line color, width, and visibility are all user-controlled.
Anchoring Options:
Deviation levels can be calculated from either the previous period's open or its EQ (midpoint), giving flexibility depending on analytical preference.
Efficient Labeling:
Labels are only rendered on the last bar and are automatically cleared and redrawn to prevent duplication.
Label style, size, text color, and background color are all user-configurable.
Trading Application
This indicator is especially suited for:
1. Mean Reversion Strategies
When price moves beyond +1.0 or +1.5 deviations from the EQ or open, it may signal overextension and a potential snap back to the midpoint or range.
2. Breakout Confirmation
Sustained price action beyond ±1.0 levels may indicate trend strength or continuation beyond historical balance zones.
3. Contextual Range Awareness
EQ and Open provide structure from which traders can judge whether price is in a state of balance or imbalance.
Labels offer at-a-glance interpretation of key levels across any chosen timeframe.
4. Fractal and Multi-Session Analysis
Analysts can layer daily, weekly, and monthly versions of this indicator to observe confluence or divergence of higher timeframe structure.
Boomerang Trading Indicator# Boomerang News Trading Indicator
## Overview
The Boomerang Trading Indicator is designed to identify potential reversal opportunities following major economic news releases. This indicator analyzes the initial market reaction to news events and provides visual cues for potential counter-trend trading opportunities based on Fibonacci retracement levels.
## How It Works
### News Event Detection
- Automatically detects major news release times (NFP, CPI, FOMC, etc.)
- Analyzes the first significant price movement following news releases
- Requires minimum candle size threshold to filter out weak reactions
### First Move Analysis
The indicator employs multiple analytical methods to determine the initial market direction:
**Simple Analysis (High Confidence):**
- When the news candle has ≥70% body-to-total ratio, uses straightforward bullish/bearish classification
**Advanced Analysis (Complex Cases):**
- Volume-weighted direction analysis
- Momentum and wick pattern analysis
- Market structure and gap analysis
- Weighted voting system combining all methods
### Entry Signal Generation
Based on the "boomerang" concept where markets often reverse after initial news reactions:
**For Bullish First Moves (Price Up Initially):**
- Generates SHORT entry signals when price retraces to 1.25-1.5 Fibonacci levels
- Visual: Red triangles above price bars
**For Bearish First Moves (Price Down Initially):**
- Generates LONG entry signals when price retraces to -0.25 to -0.5 Fibonacci levels
- Visual: Green triangles below price bars
## Key Features
### Visual Elements
- **Fibonacci Levels**: Displays key retracement levels based on the initial reaction range
- **Entry Zones**: Clear visual marking of optimal entry areas
- **Direction Arrows**: Shows the initial market reaction direction
- **Target Levels**: Displays profit target zones at 50% and 100% retracement levels
### Information Panel
Real-time display showing:
- Current setup status
- First move direction and body percentage
- Recommended trade direction
- Key price levels (reaction high/low)
- Profit targets with historical success rates
### Alert System
- Pre-news warnings (customizable timing)
- News event notifications
- Setup activation alerts
- Entry signal notifications
### Success Tracking
- Visual "BOOM!" animations when targets are hit
- Target 1 (50% level): ~95% historical success rate
- Target 2 (Main target): ~80% historical success rate
## Configuration Options
### Time Settings
- News release hour and minute (customizable for different events)
- Pre-news alert timing
- Setup duration (default 60 bars after news)
### Fibonacci Levels
- Adjustable retracement percentages
- Customizable target levels
- Mid-level importance weighting
### Risk Management
- Minimum reaction candle size filter
- Maximum risk point setting
- Visual risk/reward display
### Display Options
- Toggle Fibonacci level visibility
- Toggle target level display
- Toggle animation effects
- Customizable alert preferences
## Applicable News Events
This indicator is designed for high-impact economic releases:
- Non-Farm Payrolls (NFP) - First Friday, 8:30 AM ET
- Consumer Price Index (CPI) - Monthly, 8:30 AM ET
- Producer Price Index (PPI) - Monthly, 8:30 AM ET
- Gross Domestic Product (GDP) - Quarterly, 8:30 AM ET
- FOMC Interest Rate Decisions - 8 times yearly, 2:00 PM ET
## Trading Strategy Framework
### Core Principle
Markets often overreact to news initially, then reverse toward more rational price levels. This "boomerang effect" creates short-term trading opportunities.
### Entry Strategy
1. Wait for significant initial reaction (>10 points minimum)
2. Identify the initial direction using multi-factor analysis
3. Trade opposite to the initial reaction when price reaches sweet spot zones
4. Use Fibonacci retracement levels as entry triggers
### Risk Management
- Always use appropriate position sizing
- Set stop losses beyond recent swing levels
- Consider market volatility and news importance
- Monitor for setup invalidation signals
## Important Notes
### Educational Purpose
This indicator is for educational and analytical purposes. Users should:
- Thoroughly test strategies in demo environments
- Understand the risks involved in news trading
- Consider market conditions and volatility
- Use proper risk management techniques
### Market Considerations
- High volatility during news events increases both opportunity and risk
- Spreads may widen significantly during news releases
- Different brokers may have varying execution conditions
- Economic calendar timing may vary between sources
### Limitations
- Past performance does not guarantee future results
- Market conditions can change, affecting strategy effectiveness
- News events may have unexpected outcomes affecting normal patterns
- Technical analysis should be combined with fundamental analysis
## Version Information
- Compatible with TradingView Pine Script v5
- Designed for 1-minute timeframe optimal performance
- Works on major forex pairs, indices, and commodities
- Regular updates based on market condition changes
---
**Disclaimer:** This indicator is provided for educational purposes only. Trading involves substantial risk and is not suitable for all investors. Past performance is not indicative of future results. Users should conduct their own research and consider their financial situation before making trading decisions.

unprofitable stratThe indicator is a comprehensive trend-following indicator for TradingView. It's designed to identify and trade in the direction of the market's primary trend while using a dynamic, volatility-based system for exits. It filters out counter-trend noise and provides a clear visual dashboard of market conditions.
Core Trading Strategy
The indicator's logic is based on a two-part confirmation system to ensure trades are only taken in favorable conditions.
Master Trend Filter: The indicator first determines the "master trend" by checking if the price is above or below a long-term (200-period) Exponential Moving Average (EMA). It will only look for BUY signals when the price is above this EMA (in a master bullish trend) and only look for SELL signals when the price is below it. This prevents fighting the main market current.
Entry Trigger: Once the master trend is confirmed, the indicator doesn't enter immediately. It waits for a secondary confirmation: a breakout above a recent swing high (for a BUY) or a breakdown below a recent swing low. This ensures that short-term momentum has aligned with the long-term trend before a signal is generated.
Dynamic Exit Strategy
Exits are not based on a fixed target. Instead, the indicator uses a professional-grade ATR-based Trailing Stop Loss.
This "smart" stop loss automatically trails behind a profitable trade. It moves up to lock in gains during a BUY trade but never moves down.
The distance of the stop from the price is determined by the Average True Range (ATR), meaning it gives the trade more room to breathe in volatile markets and tightens up to protect profits in calm markets.
An "EXIT" signal appears on the chart when the price finally pulls back and hits this trailing stop line.
Visual Features on the Chart
The indicator provides several visual aids to make the trading process clear and intuitive.
Custom-Plotted Candles: The indicator draws its own candlesticks that are colored based on the trade status:
Blue: An active BUY trade is in progress.
Purple: An active SELL trade is in progress.
Gray: The indicator is flat with no active trade.
Signal Labels: Clear "BUY", "SELL", and "EXIT" labels are plotted directly on the chart at the moment they occur.
Trailing Stop Line: A bright orange line appears and follows the price during a trade, showing you the exact level of your trailing stop loss.
Multi-Timeframe Table: An optional dashboard in the top-right corner displays the master trend status ("Bullish" or "Bearish") on the 1m, 5m, 15m, 1-hour, and 4-hour timeframes simultaneously.
Trend Background: An optional feature allows you to color the entire chart background light blue or purple to match the master trend direction.

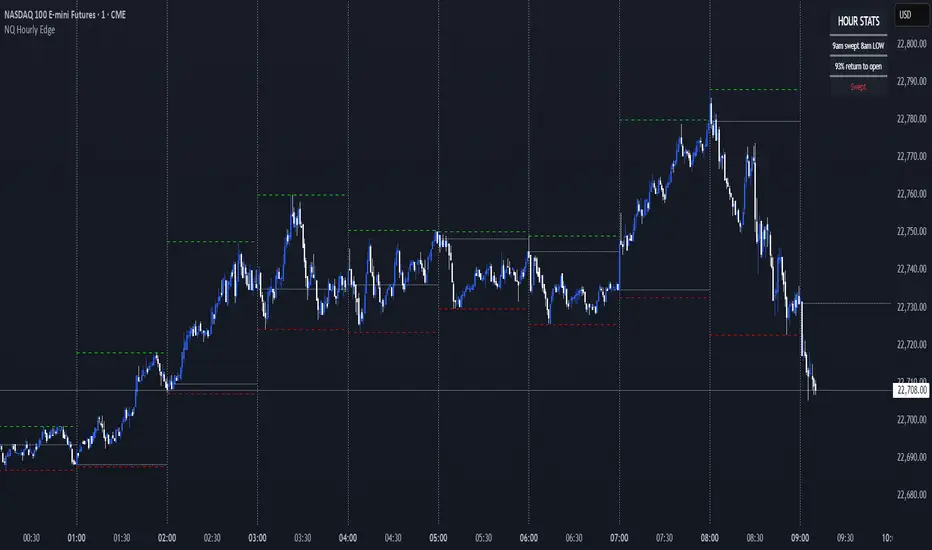
NQ Hourly Edge (By Scalpr)📊 Hourly Edge (Lorden) - Statistical Trading Edge Indicator
Transform your NQ1! trading with data-driven hourly analysis and high-probability setups based on extensive backtesting.
🎯 What This Indicator Does
The Hourly Edge indicator identifies high-probability "return to open" scenarios during the New York trading session (8am-4pm ET) specifically for NQ1! (Nasdaq futures). When the current hour opens inside the previous hour's range and then sweeps the previous high or low, statistical data shows strong probabilities of price returning to the hourly open.
📈 Key Features
Statistical Edge Detection
Real-time sweep detection with tick-by-tick accuracy
Probability percentages based on extensive NQ1! backtesting data
Color-coded probability levels: Green (75%+), Yellow (51-74%), Red (<50%)
Status tracking: Waiting → Swept → Returned
Visual Trading Tools
Hourly/Custom interval lines with full customization
High/Low tracking with optional current hour hiding
Opening price reference lines
Configurable line styles, colors, and widths
Smart Session Management
NY timezone awareness (8am-4pm ET focus)
"Waiting for 8am" display outside trading hours
20-minute segment analysis for refined probability calculations
🔧 Customization Options
Timeframe Flexibility
Multiple preset intervals: 4H, 1H, 30m, 15m, 10m, 5m
Custom timeframe input (hours + minutes)
Works on any chart timeframe
Display Controls
Show/hide any line type independently
Moveable info box (4 corner positions)
Adjustable text sizes
Historical line limit (1-500 bars)
Line Styling
Individual color settings for each line type
Style options: Solid, Dashed, Dotted
Width control: 1, 2, or 3 pixels
📊 How to Use
Add to NQ1! charts during NY session hours
Watch for sweep notifications in the info box
Check probability percentages for trade confidence
Monitor return status for entry/exit timing
Use alerts for high-probability setups (75%+ edge)
⚡ Best Practices
Optimal timeframes: 1m-15m for entries, 1H for context
Focus on 75%+ probability setups for highest edge
Wait for "moved away from open" confirmation before expecting returns
Combine with your existing NQ1! strategy for enhanced timing
🎯 Perfect For
NQ1! scalpers seeking high-probability entries
Nasdaq day traders wanting statistical edge confirmation
Futures strategy developers incorporating hourly analysis
Risk managers looking for data-driven NQ1! setups
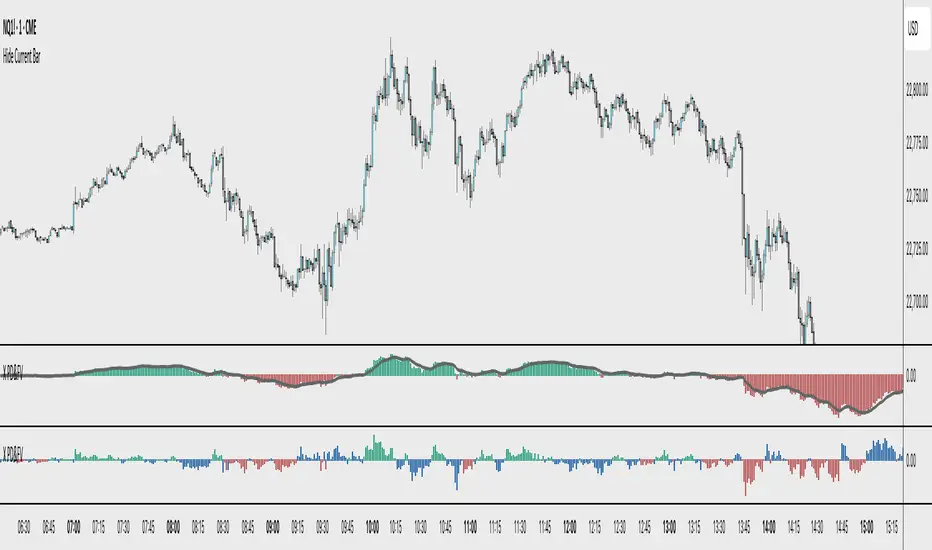
X PD&FVVisualizes the price's premium or discount relative to a moving average benchmark, highlighting mean-reversion and trend-continuation opportunities. While the underlying math is simple, the application is nuanced and can enhance decision-making in both trending and ranging market conditions.
Core Logic:
This tool calculates a custom **spread value**, defined as the distance between the current price and a chosen exponential moving average (EMA). Specifically:
When the current price is **above** the EMA, the spread is calculated as `low - EMA`.
When the price is **below** the EMA, the spread is calculated as `high - EMA`.
This approach creates a dynamic spread that reflects deviation from the EMA, with histogram bars:
Green when the spread is positive (suggesting a price premium),
Red when the spread is negative (suggesting a discount).
A secondary EMA (default 9-period) is applied to the spread itself, plotted as a smoother line over the histogram. This "EMA of spread" line can be interpreted as a moving reference level for detecting directional shifts in momentum.
Interpretation:
Zero Line = Fair Value: The horizontal zero axis represents equilibrium relative to the moving average. Movement toward or away from this line signals potential shifts in market bias.
Trend Following Use: In trending markets, traders can:
Buy when the spread dips below its EMA (discount within uptrend),
Sell when the spread rises above its EMA (premium within downtrend).
Mean Reversion Use: A return to the zero line (fair value) often acts as an **inflection point**, which traders can monitor for either:
Trend continuation (bounce away from zero), or
Reversal (cross through zero).
Customization:
EMA length (default 50) is adjustable to fit different timeframes or asset volatility.
OPR Asia-New-York [Elykia]This Pine Script indicator, called "OPR Asia-New-York ", displays time-based boxes corresponding to two specific trading periods known as OPR (Opening Price Range):
🎯 Purpose of the Indicator:
To visualize two key market time windows (morning and afternoon) as extended boxes, helping with technical analysis around opening ranges.
🕒 Two sessions displayed as boxes:
🔹 Morning OPR:
Default: from 09:00 to 09:15 (configurable)
The box extends until 10:30.
It captures the highest and lowest candle within this interval.
🔸 Afternoon OPR:
Default: from 15:30 to 15:45
The box extends until 17:30.
Follows the same logic as the morning session.
⚙️ Dashboard Options:
Enable or disable the morning or afternoon box individually
Select the timezone (e.g., GMT+2)
Customize all colors (morning/afternoon boxes, median line)
Set your own start/end/extension times for each session
📦 Each box includes:
A colored rectangle showing the price range (high/low)
A dotted median line between the high and low
The box and line extend until the end time defined
🧠 Usefulness for Traders:
Identify liquidity zones or consolidation areas
Trade setups like liquidity grabs, breakouts, or fakeouts around the OPR
Align with ICT methods or scalping strategies based on session behavior

Live Breakout Zones (No Repaint)The Live Breakout Zones indicator is a non-repainting, real-time breakout detection tool designed to help traders identify critical price breakouts as they happen — without lag and without repainting past signals.
This indicator scans recent price action to determine the highest high and lowest low over a user-defined lookback period. When price closes above the recent high or below the recent low, it immediately plots a breakout zone on the chart and provides a visual confirmation through labels and optional alerts.
🔍 Key Features:
✅ No Repainting – Signals are locked in as soon as a breakout happens; no future bar confirmation is needed.
⏱️ Minimal Lag – Reacts on breakout of recent range highs/lows without waiting for pivots or candle confirmation.
📦 Breakout Zones – Automatically draws colored rectangles showing the breakout level and zone width for clearer analysis.
🔔 Real-Time Alerts – Alerts for both bullish and bearish breakouts help you stay informed without watching the screen.
⚙️ Customizable – Adjustable lookback length, zone width, and color settings to match your strategy or chart style.
📈 Use Cases:
Identify key breakout moments for entry or retest zones.
Confirm breakout-based strategies in trending or consolidating markets.
Use zones for setting risk-reward areas, SL/TP levels, or re-entry planning.
⚙️ Settings:
Lookback Range (High/Low): Defines how many previous bars are checked for breakout levels.
Zone Width: Number of bars to extend the breakout box forward.
Bullish/Bearish Zone Color: Choose custom colors for breakout visualization.
🧠 Trading Tip:
Combine this tool with volume spikes, tail candles, or support/resistance for more reliable breakout setups.

IME's Community First Presented FVGsIME's Community First Presented FVGs v1.5 - Advanced Implementation
ORIGINALITY & INNOVATION
This indicator advances beyond basic Fair Value Gap detection by implementing a sophisticated 24-hour FVG lifecycle management system aligned with institutional trading patterns. While many FVG indicators simply detect gaps and extend them indefinitely, this implementation introduces temporal intelligence that mirrors how institutional algorithms actually manage these inefficiencies.
Key Innovations that set this apart:
- 24-Hour Lifecycle Management: FVGs extend dynamically until 16:59, then freeze until removal at 17:00 next day
- Institutional Day Alignment: Recognizes 18:00-16:59 trading cycles vs standard calendar days
- Multi-Session Detection: Simultaneous monitoring of Midnight, London, NY AM, and NY PM sessions
- Advanced Classification System: A.FVG detection with volume imbalance analysis vs classic FVG patterns
- Volatility Settlement Logic: Blocks contamination from opening mechanics (3:01+, 0:01+, 13:31+ rules)
- Visual Enhancement System: C.E. lines, contamination warnings, dark mode support with proper transparency handling
BASED ON ICT CONCEPTS
This indicator implements First Presented Fair Value Gap methodology taught by ICT (Inner Circle Trader). The original F.P. FVG concepts, timing rules, and session-based detection are credited to ICT's educational material. This implementation extends those foundational concepts with advanced lifecycle management and institutional alignment features.
ICT's Core F.P. FVG Rules Implemented:
- First clean FVG after session opening (avoids opening contamination)
- 3-candle pattern requirement for valid detection
- Session-specific timing windows and volatility settlement
- Consequent Encroachment level identification
IME's Advanced Enhancements:
- Automated lifecycle management with institutional day recognition
- Multi-session simultaneous monitoring with proper isolation
- Advanced visual system with transparency states for aged FVGs
- A.FVG classification with volume imbalance detection algorithms
HOW IT WORKS
Core Detection Engine
The indicator monitors four key institutional sessions using precise timing windows:
- Midnight Session: 00:01-00:30 (blocks 00:00 contamination)
- London Session: 03:01-03:30 (blocks 03:00 contamination)
- NY AM Session: 09:30-10:00 (configurable 9:30 detection)
- NY PM Session: 13:31-14:00 (blocks 13:30 contamination)
During each session window, the algorithm scans for the first valid FVG pattern using ICT's 3-candle rule while applying volatility settlement principles to avoid false signals from opening mechanics.
Advanced Classification System
Classic FVG Detection:
Standard 3-candle wick-to-wick gap where candle 1 and 3 don't overlap, creating an inefficiency that institutions must eventually fill.
A.FVG (Advanced FVG) Detection:
Enhanced pattern recognition that includes volume imbalance analysis (deadpool detection) to identify more significant institutional inefficiencies. A.FVGs incorporate both the basic gap plus additional price imbalances between candle bodies, creating larger, more significant levels.
24-Hour Lifecycle Management
Phase 1 - Dynamic Extension (Creation Day):
From detection until 16:59 of creation day, FVGs extend in real-time as new bars form, maintaining their relevance as potential support/resistance levels.
Phase 2 - Freeze Period (Next Day):
At 16:59, FVGs stop extending and "freeze" at their final size, remaining visible as reference levels but no longer growing. This prevents outdated levels from contaminating fresh analysis.
Phase 3 - Cleanup (17:00 Next Day):
Exactly 24+ hours after creation, FVGs are automatically removed to maintain chart clarity. This timing aligns with institutional trading cycle completion.
Institutional Day Logic
The algorithm recognizes that institutional trading days run from 18:00-16:59 (not midnight-midnight). This alignment ensures FVGs are managed according to institutional timeframes rather than arbitrary calendar boundaries.
Contamination Avoidance System
Volatility Settlement Principle:
Opening mechanics create artificial volatility that can produce false FVG signals. The indicator automatically blocks detection during exact session opening times (X:00) and requires settlement time (X:01+) before identifying clean institutional inefficiencies.
Special NY AM Handling:
Provides configurable 9:30 detection for advanced users who want to capture potential opening range FVGs, with clear visual warnings about contamination risk.
VISUAL SYSTEM
Color Intelligence
- Current Day FVGs: Full opacity with session-specific colors
- Previous Day FVGs: 70% transparency for historical reference
- Special Timing (9:30): Dedicated warning color with alert labels
- Dark Mode Support: Automatic text/line color adaptation
Enhanced Visual Elements
C.E. (Consequent Encroachment) Lines:
Automatically calculated 50% levels within each FVG, representing the most likely fill point based on institutional behavior patterns. These levels extend and freeze with their parent FVG.
Contamination Warnings:
Visual alerts when FVGs are detected during potentially contaminated timing, helping traders understand signal quality.
Session Identification:
Clear labeling system showing FVG type (FVG/A.FVG), session origin (NY AM, London, etc.), and creation date for easy reference.
HOW TO USE
Basic Setup
1. Session Selection: Enable/disable specific sessions based on your trading strategy
2. FVG Type: Choose between Classic FVGs or A.FVGs depending on your analysis preference
3. Visual Preferences: Adjust colors, text size, and enable dark mode if needed
Trading Applications
Intraday Reference Levels:
Use current day FVGs as potential support/resistance for price action analysis. The dynamic extension ensures levels remain relevant throughout the trading session.
Multi-Session Analysis:
Monitor how price interacts with FVGs from different sessions to understand institutional flow and market structure.
C.E. Level Trading:
Focus on the 50% consequent encroachment levels for high-probability entry points when price approaches FVG zones.
Historical Context:
Previous day FVGs (shown with transparency) provide context for understanding market structure evolution across multiple trading days.
Advanced Features
9:30 Special Detection:
For experienced traders, enable 9:30 FVG detection to capture opening range inefficiencies, but understand the contamination risks indicated by warning labels.
A.FVG vs Classic Toggle:
Switch between detection modes based on market conditions - A.FVGs for trending environments, Classic FVGs for ranging conditions.
Best Practices
- Use on 1-minute to 15-minute timeframes for optimal session detection
- Combine with other institutional concepts (order blocks, liquidity levels) for comprehensive analysis
- Pay attention to transparency states - current day FVGs are more actionable than previous day references
- Consider C.E. levels as primary targets rather than full FVG fills
TECHNICAL SPECIFICATIONS
Platform: Pine Script v6 for optimal performance and reliability
Timeframe Compatibility: All timeframes (optimized for 1M-15M)
Market Compatibility: 24-hour markets (Forex, Crypto, Futures)
Session Management: Automatic trading day detection with weekend handling
Memory Management: Intelligent capacity limits with automatic cleanup
Performance: Optimized algorithms for smooth real-time operation
CLOSED SOURCE JUSTIFICATION
This indicator is published as closed source to protect the proprietary algorithms that enable:
- Precise 24-hour lifecycle timing calculations with institutional day alignment
- Advanced A.FVG classification with sophisticated volume imbalance detection
- Complex multi-session coordination with contamination filtering
- Optimized memory management preventing performance degradation
- Specialized visual state management for transparency and extension logic
The combination of these advanced systems creates a unique implementation that goes far beyond basic FVG detection, warranting protection of the underlying computational methods while providing full transparency about functionality and usage.
PERFORMANCE CHARACTERISTICS
Real-Time Operation: Smooth performance with minimal resource usage
Accuracy: Precise session detection with timezone consistency
Reliability: Robust error handling and edge case management
Scalability: Supports multiple simultaneous FVGs without performance impact
This advanced implementation represents significant evolution beyond basic FVG indicators, providing institutional-grade analysis tools for serious traders while maintaining the clean visual presentation essential for effective technical analysis.
IMPORTANT DISCLAIMERS
Past performance does not guarantee future results. This indicator is an educational tool based on ICT's Fair Value Gap concepts and should be used as part of a comprehensive trading strategy. Users should understand the risks involved in trading and consider their risk tolerance before making trading decisions. The indicator identifies potential support/resistance levels but does not predict market direction with certainty.
2 days ago
Release Notes
IME's Community First Presented FVGs v1.5.2 - Critical Bug Fixes
Bug Fixes:
v1.5.1 - Fixed 9:30 Contamination Blocking:
Issue: When 9:30 detection toggle was OFF, script still detected 9:30 candles as F.P. FVGs
Fix: Added proper contamination blocking logic that prevents 9:30 middle candle detection when toggle is OFF
Result: Toggle OFF now correctly shows clean F.P. FVGs at 9:31+ (proper ICT volatility settlement)
v1.5.2 - Fixed A.FVG Box Calculation Accuracy:
Issue: A.FVG boxes incorrectly included ALL body levels even when no actual deadpool existed between specific candles
Fix: Implemented selective body level inclusion - only adds body prices where actual volume imbalances exist
Result: A.FVG boxes now accurately represent only areas with real institutional volume imbalances
Impact:
More Accurate Detection: 9:30 contamination properly blocked when disabled
Precise A.FVG Zones: Boxes only include levels with actual deadpools/volume imbalances
Institutional Accuracy: Both fixes align detection with true institutional trading principles
Technical Details:
Enhanced contamination blocking checks middle candle timing in normal mode
A.FVG calculation now selectively includes body levels based on individual deadpool existence
Maintains backward compatibility with all existing features and settings
These fixes ensure the indicator provides institutionally accurate FVG detection and sizing for professional trading analysis.

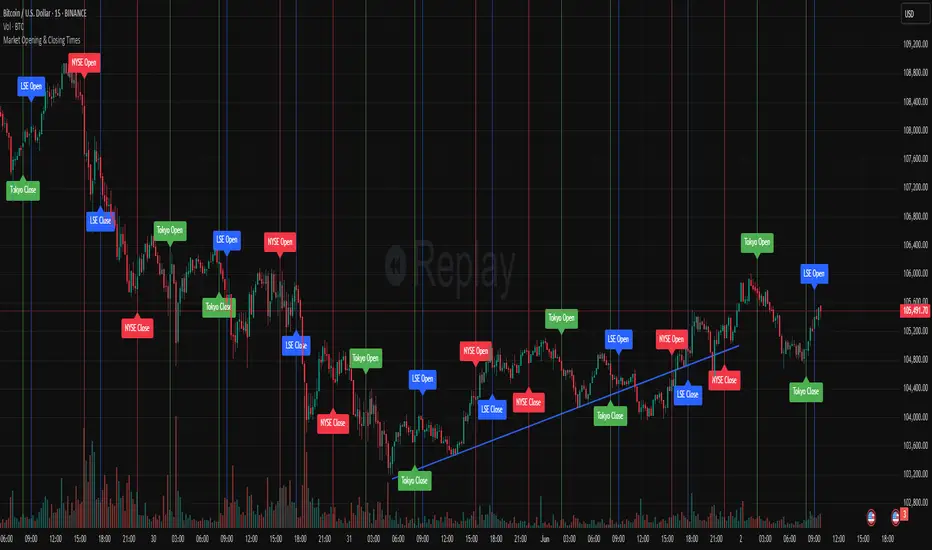
Market Opening & Closing TimesThis indicator highlights the opening and closing times of major global markets (NYSE, LSE, Tokyo) on any chart timeframe. Users can toggle the display of lines and labels, and customize colors per market.
Features:
Toggle each market’s Open/Close separately
Global toggles: Show/Hide all lines or labels
Customizable colors for NYSE, LSE, and Tokyo markers
Accurate event detection using timezone-aware timestamp checks within each bar
Multi-Confluence Swing Hunter V1# Multi-Confluence Swing Hunter V1 - Complete Description
Overview
The Multi-Confluence Swing Hunter V1 is a sophisticated low timeframe scalping strategy specifically optimized for MSTR (MicroStrategy) trading. This strategy employs a comprehensive point-based scoring system that combines optimized technical indicators, price action analysis, and reversal pattern recognition to generate precise trading signals on lower timeframes.
Performance Highlight:
In backtesting on MSTR 5-minute charts, this strategy has demonstrated over 200% profit performance, showcasing its effectiveness in capturing rapid price movements and volatility patterns unique to MicroStrategy's trading behavior.
The strategy's parameters have been fine-tuned for MSTR's unique volatility characteristics, though they can be optimized for other high-volatility instruments as well.
## Key Innovation & Originality
This strategy introduces a unique **dual scoring system** approach:
- **Entry Scoring**: Identifies swing bottoms using 13+ different technical criteria
- **Exit Scoring**: Identifies swing tops using inverse criteria for optimal exit timing
Unlike traditional strategies that rely on simple indicator crossovers, this system quantifies market conditions through a weighted scoring mechanism, providing objective, data-driven entry and exit decisions.
## Technical Foundation
### Optimized Indicator Parameters
The strategy utilizes extensively backtested parameters specifically optimized for MSTR's volatility patterns:
**MACD Configuration (3,10,3)**:
- Fast EMA: 3 periods (vs standard 12)
- Slow EMA: 10 periods (vs standard 26)
- Signal Line: 3 periods (vs standard 9)
- **Rationale**: These faster parameters provide earlier signal detection while maintaining reliability, particularly effective for MSTR's rapid price movements and high-frequency volatility
**RSI Configuration (21-period)**:
- Length: 21 periods (vs standard 14)
- Oversold: 30 level
- Extreme Oversold: 25 level
- **Rationale**: The 21-period RSI reduces false signals while still capturing oversold conditions effectively in MSTR's volatile environment
**Parameter Adaptability**: While optimized for MSTR, these parameters can be adjusted for other high-volatility instruments. Faster-moving stocks may benefit from even shorter MACD periods, while less volatile assets might require longer periods for optimal performance.
### Scoring System Methodology
**Entry Score Components (Minimum 13 points required)**:
1. **RSI Signals** (max 5 points):
- RSI < 30: +2 points
- RSI < 25: +2 points
- RSI turning up: +1 point
2. **MACD Signals** (max 8 points):
- MACD below zero: +1 point
- MACD turning up: +2 points
- MACD histogram improving: +2 points
- MACD bullish divergence: +3 points
3. **Price Action** (max 4 points):
- Long lower wick (>50%): +2 points
- Small body (<30%): +1 point
- Bullish close: +1 point
4. **Pattern Recognition** (max 8 points):
- RSI bullish divergence: +4 points
- Quick recovery pattern: +2 points
- Reversal confirmation: +4 points
**Exit Score Components (Minimum 13 points required)**:
Uses inverse criteria to identify swing tops with similar weighting system.
## Risk Management Features
### Position Sizing & Risk Control
- **Single Position Strategy**: 100% equity allocation per trade
- **No Overlapping Positions**: Ensures focused risk management
- **Configurable Risk/Reward**: Default 5:1 ratio optimized for volatile assets
### Stop Loss & Take Profit Logic
- **Dynamic Stop Loss**: Based on recent swing lows with configurable buffer
- **Risk-Based Take Profit**: Calculated using risk/reward ratio
- **Clean Exit Logic**: Prevents conflicting signals
## Default Settings Optimization
### Key Parameters (Optimized for MSTR/Bitcoin-style volatility):
- **Minimum Entry Score**: 13 (ensures high-conviction entries)
- **Minimum Exit Score**: 13 (prevents premature exits)
- **Risk/Reward Ratio**: 5.0 (accounts for volatility)
- **Lower Wick Threshold**: 50% (identifies true hammer patterns)
- **Divergence Lookback**: 8 bars (optimal for swing timeframes)
### Why These Defaults Work for MSTR:
1. **Higher Score Thresholds**: MSTR's volatility requires more confirmation
2. **5:1 Risk/Reward**: Compensates for wider stops needed in volatile markets
3. **Faster MACD**: Captures momentum shifts quickly in fast-moving stocks
4. **21-period RSI**: Reduces noise while maintaining sensitivity
## Visual Features
### Score Display System
- **Green Labels**: Entry scores ≥10 points (below bars)
- **Red Labels**: Exit scores ≥10 points (above bars)
- **Large Triangles**: Actual trade entries/exits
- **Small Triangles**: Reversal pattern confirmations
### Chart Cleanliness
- Indicators plotted in separate panes (MACD, RSI)
- TP/SL levels shown only during active positions
- Clear trade markers distinguish signals from actual trades
## Backtesting Specifications
### Realistic Trading Conditions
- **Commission**: 0.1% per trade
- **Slippage**: 3 points
- **Initial Capital**: $1,000
- **Account Type**: Cash (no margin)
### Sample Size Considerations
- Strategy designed for 100+ trade sample sizes
- Recommended timeframes: 4H, 1D for swing trading
- Optimal for trending/volatile markets
## Strategy Limitations & Considerations
### Market Conditions
- **Best Performance**: Trending markets with clear swings
- **Reduced Effectiveness**: Highly choppy, sideways markets
- **Volatility Dependency**: Optimized for moderate to high volatility assets
### Risk Warnings
- **High Allocation**: 100% position sizing increases risk
- **No Diversification**: Single position strategy
- **Backtesting Limitation**: Past performance doesn't guarantee future results
## Usage Guidelines
### Recommended Assets & Timeframes
- **Primary Target**: MSTR (MicroStrategy) - 5min to 15min timeframes
- **Secondary Targets**: High-volatility stocks (TSLA, NVDA, COIN, etc.)
- **Crypto Markets**: Bitcoin, Ethereum (with parameter adjustments)
- **Timeframe Optimization**: 1min-15min for scalping, 30min-1H for swing scalping
### Timeframe Recommendations
- **Primary Scalping**: 5-minute and 15-minute charts
- **Active Monitoring**: 1-minute for precise entries
- **Swing Scalping**: 30-minute to 1-hour timeframes
- **Avoid**: Sub-1-minute (excessive noise) and above 4-hour (reduces scalping opportunities)
## Technical Requirements
- **Pine Script Version**: v6
- **Overlay**: Yes (plots on price chart)
- **Additional Panes**: MACD and RSI indicators
- **Real-time Compatibility**: Confirmed bar signals only
## Customization Options
All parameters are fully customizable through inputs:
- Indicator lengths and levels
- Scoring thresholds
- Risk management settings
- Visual display preferences
- Date range filtering
## Conclusion
This scalping strategy represents a comprehensive approach to low timeframe trading that combines multiple technical analysis methods into a cohesive, quantified system specifically optimized for MSTR's unique volatility characteristics. The optimized parameters and scoring methodology provide a systematic way to identify high-probability scalping setups while managing risk effectively in fast-moving markets.
The strategy's strength lies in its objective, multi-criteria approach that removes emotional decision-making from scalping while maintaining the flexibility to adapt to different instruments through parameter optimization. While designed for MSTR, the underlying methodology can be fine-tuned for other high-volatility assets across various markets.
**Important Disclaimer**: This strategy is designed for experienced scalpers and is optimized for MSTR trading. The high-frequency nature of scalping involves significant risk. Past performance does not guarantee future results. Always conduct your own analysis, consider your risk tolerance, and be aware of commission/slippage costs that can significantly impact scalping profitability.

Volume Overbought/Oversold Zones📊 What You’ll See on the Chart
Red Background or Red Triangle ABOVE a Candle
🔺 Means: Overbought Volume
→ Volume on that bar is much higher than average (as defined by your settings).
→ Suggests strong activity, possible exhaustion in the trend or an emotional spike.
→ It’s a warning: consider watching for signs of reversal, especially if price is already stretched.
Green Background or Green Triangle BELOW a Candle
🔻 Means: Oversold Volume
→ Volume on that bar is much lower than normal.
→ Suggests the market may be losing momentum, or few sellers are left.
→ Could signal an upcoming reversal or recovery if confirmed by price action.
Orange Line Below the Candles (Volume Moving Average)
📈 Shows the "normal" average volume over the last X candles (default is 20).
→ Helps you visually compare each bar’s volume to the average.
Gray Columns (Actual Volume Bars)
📊 These are your regular volume bars — they rise and fall based on how active each candle is.
🔍 What This Indicator Does (In Simple Words)
This indicator looks at trading volume—which is how many shares/contracts were traded in a given period—and compares it to what's considered "normal" for recent history. When volume is unusually high or low, it highlights those moments on the chart.
It tells you:
• When volume is much higher than normal → market might be overheated or experiencing a buying/selling frenzy.
• When volume is much lower than normal → market might be quiet, potentially indicating lack of interest or indecision.
These conditions are marked visually, so you can instantly spot them.
💡 How It Helps You As a Trader
1. Spotting Exhaustion in Trends (Overbought Signals)
If a market is going up and suddenly volume spikes way above normal, it may mean:
• The move is getting crowded (lots of buyers are already in).
• A reversal or pullback could be near because smart money may be taking profits.
Trading idea: Wait for high-volume up bars, then look for price weakness to consider a short or exit.
2. Identifying Hidden Opportunities (Oversold Signals)
If price is falling but volume drops unusually low, it might mean:
• Panic is fading.
• Sellers are losing energy.
• A bounce or trend reversal could happen soon.
Trading idea: After a volume drop in a downtrend, watch for bullish price patterns or momentum shifts to consider a buy.
3. Confirming or Doubting Breakouts
Volume is critical for confirming breakouts:
• If price breaks a key level with strong volume, it's more likely to continue.
• A breakout without volume could be a fake-out.
This indicator highlights volume surges that can help you confirm such moves.
📈 How to Use It in Practice
• Combine it with candlestick patterns, support/resistance, or momentum indicators.
• Use the background colors or shapes as a visual cue to pause and analyze.
• Adjust the sensitivity to suit fast-moving markets (like crypto) or slow ones (like large-cap stocks).

Rejection Blocks (RJB) and Liquidity Grabs (SFPs)- Milana TradesThis indicator highlights Rejection Blocks (RJB) and Liquidity Grabs (SFPs)—two advanced price action concepts used by professional traders, especially those following ICT (Inner Circle Trader) strategies.
Rejection Block (RJB) is an advanced version of the traditional Order Block. It marks areas where price has been sharply rejected—often zones where smart money enters or exits positions. The logic is based on specific wick rejection criteria and candle structure, with mitigated RJBs marked or hidden automatically.
Liquidity Grab (SFP) detects key Swing Failure Patterns—where price takes out a previous high/low, grabs liquidity, and reverses. Optional volume validation is available for more accurate filtering, especially using LTF (lower timeframe) data.
Key Features:
Rejection Block (RJB)
1) Identifies both bullish and bearish rejection blocks.
2) Two logic types: “trapped wick” and “signal wick” configurations.
3) Auto-detection of mitigated RJBs and customizable visualization.
4)Adjustable color, transparency, box style, label text, and more.
5)Limit on max RJBs displayed to keep the chart clean.
Liquidity Grab (SFP)
1)Detects bullish and bearish SFPs (Swing Failure Patterns).
2)Optional volume validation with threshold control (based on LTF).
3)Dynamically adjusts lower timeframe resolution (auto/manual).
4)Visual confirmation lines, wick highlights, and labels.
5)SFP Dashboard table (optional) for LTF & validation display.
SFP Wick to RJB Zones
Converts confirmed SFPs into new RJB boxes.
Adds powerful confluence between rejection and liquidity.
🔔 Built-in Alerts
Alerts can be set up for both bullish and bearish Rejection Blocks, as well as confirmed SFPs.
Ideal for traders who want to be notified in real-time when price:
Forms a valid Rejection Block,
Prints a confirmed SFP (Swing Failure),
Enters or exits key liquidity zones.
Alerts are fully compatible with TradingView’s alert system.
⚙️ Settings Overview:
Rejection Blocks
Enable plotting, box limit, mitigated filtering, label customization.
Liquidity Grabs (SFPs)
Enable SFPs (bull/bear), pivot length, volume % threshold, LTF resolution.
Enable dashboard, wick display, and validation logic.
SFP-based RJB
Create RJB zones from confirmed SFP signals.
Independent box length and color settings.
Dashboard & Labels
Enable/disable visual labels and LTF info table.
Customize font size, color, and position.
Use Cases:
Identify smart money rejection zones before price reversals.
Use mitigated RJBs to anticipate failed retests or structure breaks.
Trade with confidence by combining RJB + SFP signals.
Set alerts to monitor setups without staring at charts 24/7.
Notes:
Compatible with any market (Forex, Crypto, Indices, Stocks).
Works on all timeframes.

Rapid HTF Price Action Dashboard V2.0Rapid HTF Price Action Dashboard V2.0
Overview
Stop the constant switching between timeframes. The Rapid HTF Price Action Dashboard is an all-in-one analysis suite designed to give you a crystal-clear view of the market's true intent by projecting critical higher-timeframe (HTF) data directly onto your trading chart.
This tool is more than just a pattern indicator; it's a complete dashboard that provides institutional-grade insights into price action. It helps you anticipate market moves by showing you where liquidity lies and how the bigger players are positioning themselves, all from the comfort of your lower-timeframe chart.
Key Features
Multi-Timeframe Dashboard: A clean, intuitive panel on the right of your chart displays the last two closed higher-timeframe candles (Candle A & B) and the live, developing one (Candle C).
Projected HTF Levels: Automatically draws and projects the previous HTF candle's high and low across your chart, acting as critical dynamic support and resistance levels.
Advanced Pattern Recognition: Identifies seven high-conviction candlestick patterns based on our proprietary filtering system, designed to eliminate noise and pinpoint only the most potent signals.
The Logic: Why Our Signals Are More Accurate
This indicator goes far beyond textbook definitions. We don't just look for shapes; we look for the story behind the price action. Each pattern is filtered through a rigorous set of conditions to ensure it represents true market conviction.
Hammers & Inverted Hammers: The Liquidity Grab
Classic Hammer/IH patterns are often misleading. Ours are different. We identify them as true liquidity grab signals, a core concept used in ICT (Inner Circle Trader) methodologies.
A Hammer (H) is only valid if its low wick has pierced below the low of the previous candle (low < low ). This signifies a "stop hunt" where liquidity was absorbed below a key level before buyers aggressively pushed the price up.
An Inverted Hammer (IH) is only valid if its high wick has pierced above the high of the previous candle (high > high ). This shows liquidity was taken above a prior high before sellers took control and suppressed the price.
Harami: Filtering for Conviction
A classic Harami (an inside bar) can often just be a weak doji, signaling indecision. We filter this noise out.
Our Harami signal (BeH, BuH) requires the inside candle to have a meaningful body (defaulting to 30% of its own range, but fully customizable).
Furthermore, we have enhanced the logic to ensure the body of the inside candle is strictly contained within the body of the previous candle, making it a more precise and reliable signal of consolidation before a potential expansion.
Power Engulfing: A Signal of Overwhelming Force
We don't flag just any engulfing candle. We look for true displacement and momentum.
Our Power Engulfing pattern (BE, BuE) requires the body of the current candle to completely engulf the body of the previous candle.
Crucially, it must also close decisively beyond the entire range (including the wick) of the previous candle. A Bullish Engulfing must close above the previous high, and a Bearish Engulfing must close below the previous low. This confirms overwhelming force has entered the market and a reversal is highly probable.
How to Use the Dashboard
Set Your Reference Timeframe (refTF): Choose the higher timeframe you want to analyze (e.g., "240" for 4-Hour).
Identify the Narrative: Use the projected High/Low lines as your key support and resistance zones. A primary strategy is to wait for price to interact with these levels.
Anticipate the Draw on Liquidity: Watch as price approaches the previous HTF high or low. The dashboard helps you predict the market's next move. For example, if price is trading below the previous HTF low, you can anticipate a potential sweep of that level.
Confirm with a Signal: When a signal like a Hammer (H) appears on the dashboard after sweeping the previous low, it provides high-conviction confirmation that liquidity has been taken and price is ready to reverse.

Closed Market / Back-Test Filter x 'Bull_Trap_9'Hello TradingView Traders!
This is a very valuable tool that I believe all traders will find useful.
This indicator / filter is '1 of 2'. I prefer it as a filter because it is not meant for live trade analysis. It is designed to make a trader aware of their individual trade sessions and to help aid in static chart candlestick back-testing.
Also, look for my indicator / filter, '2 of 2': 'Red Report Filter'
There are two functions to this filter.
Primary use: It allows a trader to set a session window: Open / Close.
During a trade session, like YM, I only trade 9:30 - 15:00. Without the filter, many times I have traded past my cutoff because I was focused on the chart and not the time.
With this filter on as close nears with an open trade and the filter starts to apply, I know I am at session close with no more trades upon exit. Otherwise, I know the session is done with no further trades.
It is also nice to have the filter on during the session open as a demarcation boundary.
Secondary use: It is used as a chart back-test tool.
When applied to a traders back-test chart, the trader can control their trade session envelopes for easier and more precise evaluation. The filter will allow only the candles per session that the trader wants to focus on and will filter all other non-session candles.
I can easily compare a whole week of 30m session data, concentrating solely on the filtered trade windows.
Please Note: The filter will be active as far back as the historic data prints.
Thanks for viewing!
