Day of Week and HTF Period SeparatorThis indicator displays vertical lines to separate each day of the week, along with optional 1H and 4H period separators. It also shows day-of-week labels (MON, TUE, etc.) at a specified hour for quick visual reference. Useful for intraday traders who want a clear view of daily and higher timeframe transitions.
Chart patterns

Chan Theory - Chanlun UltraChan Theory -Chanlun Ultra
Overview
This script is based on the core technical framework of Chan Theory, transforming complex market fluctuations into a multi-layered, quantifiable structural analysis system. Through real-time dynamic computation, it automatically parses key components in price movements such as fractals, pens, segments, and pivot zones. Integrated with momentum analysis and trading signal alerts, it provides traders with comprehensive market insights from micro to macro perspectives. The core distinction of Chan Theory from traditional technical indicators lies in its rigorous recursive logic and human-centric market philosophy. This script faithfully restores Chan Theory's essence of "using Zen to resolve market complexity," decomposing spiral price movements into an orderly trading decision system.
Technical Principles
This indicator implements the complete recognition process from candlesticks to fractals, pens, segments, and pivot zones using pure Pine Script under Chan Theory's framework. Core technical implementations include:
1. Candlestick Containment Processing
Employs specific algorithms to handle candlestick containment relationships, eliminating random noise:
In uptrends: Select the higher high and higher low values
In downtrends: Select the lower high and lower low values
Ensure complete elimination of containment through recursive processing
2. Fractal Identification System
Performs strict fractal judgment on processed candlesticks:
Top Fractal: The middle candlestick's high is higher than both adjacent candlesticks
Bottom Fractal: The middle candlestick's low is lower than both adjacent candlesticks
Validate fractal effectiveness via the filterOperateType function
3. Pen Construction Mechanism & Type Selection
Connects valid top/bottom fractals to form pen structures, offering four pen types:
Classic Pen: Traditional Chan Theory definition, strictly following classic rules
Optimized Pen: Enhanced algorithm for short-term volatility recognition
4K Pen: Builds pens based on fractals formed by at least 4 candlesticks (improves stability)
Strict Pen: Employs the most stringent validation conditions for reliability
4. Segment Partitioning Algorithm
Applies segment rules to pen sequences with three modes:
- Dynamic Real-time Progressive Correction: Adjusts forming segments continuously with new data
- Strict Mode: Fully complies with Chan Theory definitions
- Extension Mode: Flexible handling of trend developments
5. Pivot Zone Recognition Technology
Identifies pen-level and segment-level pivot zones
Calculates pivot zone price ranges and time durations
Analyzes pivot zone evolution characteristics
Supports display of pivot zones across different levels
Trading Signal System & Filters
Trading Signal Filtering System
This indicator provides comprehensive filtering functions:
Fractal Validity Filter: Verifies fractal patterns and post-fractal developments
Basic Fractal Filter: Eliminates non-compliant fractals through basic feature checks
Type I MACD Divergence Filter: Enhances Type I signal reliability via MACD divergence analysis
Type II Signal Filter: Custom conditions for Type II signals
-False Signal Trap Avoidance: Detects and bypasses deceptive price patterns
Chan Theory Trading Signal Principles
Type I Signals (Trend Reversals)
Principle: Forms when price makes new highs/lows with weakening internal momentum (divergence)
Identification: Compares structural features of adjacent same-direction pens
Application: Early trend reversal signals for swing trading
Type II Signals (Pullback Entries)
Principle: Occurs during retracements as sub-level reversal signals
Identification: Determined by pivot zone support/resistance and fractal combinations
Application: Optimal positions for pullback trades with controlled risk
Type III Signals (Breakout Confirmations)
Principle: Confirms pivot zone breakouts
Identification: Price breaks prior pivot zone boundaries with valid fractals
Application: Trend continuation signals for trend-following strategies
Indicator Features
Multi-Level Structural Analysis
Distinguishes structures across levels via level parameters
Higher-level trends guide lower-level operations
Implements cross-level collaborative logic
Displays sub-level pivot zones
Structural Visualization
Pens: Displayed per selected pen type
Segments: Rendered according to chosen segment mode
Pivot Zones: Color gradients indicate consolidation strength
Technical Implementation
Data Structure Design
Pen Object: Stores direction, timestamps, and price attributes
Segment Object: Manages segments and constituent pens
Pivot Object: Defines pivot zone ranges and characteristics
Grade Object: Organizes analysis results across levels
User Guide
Parameter Settings
Pen Type: Classic/Optimized/4K/Strict (adapt to analysis needs)
Segment Mode: Dynamic/Strict/Extension (match trading strategies)
Signal Filters: Enable/disable specific filters
Pivot Display: Toggle sub-level pivot zones
Divergence Settings: Configure types (regular/hidden) and display styles
Strategy Settings: Set trading rules linked to signals
Strategy Configuration
Follow Segments: Trade in alignment with segment direction
Signal Participation: Enable/disable Type I/II/III signals
Signal Conditions: Require signals to appear post-pivot zone formation
Prevent Early Entries:
Type I signals require ≥1 pivot zone or 5 pens
Type II Safety Control: Participate only if Type III signals are absent
Practical Recommendations
Select pen types/segment modes per market conditions
Adjust filters for different instruments and timeframes
Enhance accuracy through multi-level analysis
Confirm Type I signals with divergence indicators
Choose strategy parameters aligned with risk tolerance
Value Proposition
Systematizes Chan Theory into computable structures
Multiple pen/segment methods adapt to diverse markets
Advanced filtering significantly improves signal quality (historically validated)
Multi-level analysis provides holistic market insights
This tool is for technical analysis only. It does not constitute investment advice. Users must exercise independent judgment based on personal risk tolerance and objectives.
概述
本脚本基于缠论核心技术框架,将复杂的市场波动转化为多层次、可量化的结构分析系统。通过实时动态演算,自动解析价格走势中的分型、笔、线段、中枢等核心组件,并融合动量分析与交易信号预警功能,为交易者提供从微观到宏观的全方位市场透视。缠论区别于传统技术指标的核心在于其严格的递归逻辑与人性化市场哲学,本脚本忠实还原缠论"以禅破缠"的思想精髓,将螺旋缠绕的价格运动分解为有序的交易决策体系。
技术原理
本指标基于缠论技术分析框架,通过纯Pine Script实现了从K线到分型、笔、线段和中枢的完整识别流程。核心技术实现包括:
1. K线包含处理
采用特定算法处理K线包含关系,消除随机波动干扰:
- 上涨趋势中取高点高值、低点高值
- 下跌趋势中取高点低值、低点低值
- 通过递归处理确保包含关系完全消除
2. 分型识别系统
在处理后的K线基础上实现严格的分型判断:
- 顶分型:中间K线高点高于两侧K线
- 底分型:中间K线低点低于两侧K线
- 通过`filterOperateType`函数实现分型有效性验证
3. 笔的构建机制与类型选择
连接有效顶底分型形成笔结构,提供四种笔类型选择:
- **老笔**:传统缠论笔定义,严格遵循经典规则
- **新笔**:优化算法,增强对短期波动的识别能力
- **4K**:基于至少4根K线形成的分型构建笔,提高稳定性
- **严笔**:采用最严格的条件验证,确保形成的笔结构可靠
4. 线段划分算法
基于笔序列应用线段划分规则,支持三种线段模式:
- **当下延伸后修正**:实时计算当前形成中的线段,并随新数据更新修正
- **严格模式**:要求线段完全符合缠论定义,减少假信号
- **延伸模式**:更灵活地处理线段延伸情况,适合趋势分析
5. 中枢识别技术
- 实现笔中枢和线段中枢识别
- 计算中枢价格区间与时间范围
- 分析中枢演变特征
- 支持显示不同级别中枢功能
买卖点系统与过滤机制
买卖点过滤系统
本指标提供全面的买卖点过滤功能:
- **买卖点分型过滤**:检验分型形态有效性,验证分型后续发展
- **买卖点分型基础过滤**:针对分型基本特征进行验证,排除不合格分型
- **1买卖macd背驰过滤**:通过MACD判断背驰情况,提高一类买卖点可靠性
- **2买卖点过滤**:专门针对二类买卖点的过滤条件
- **防狼术**:避免陷阱式买卖点,提高交易安全性
缠论买卖点原理
1. **一类买卖点**
- 原理:基于趋势背驰原理,当价格创新高/低但内部结构力度减弱时形成
- 识别方法:通过比较相邻同向笔的结构特征判断力度变化
- 应用:提供趋势可能反转的早期信号,适合波段操作
2. **二类买卖点**
- 原理:发生在回调过程中,属于次级别转折信号
- 识别方法:通过中枢支撑位与分型组合判断
- 应用:回调买入或做空的较佳位置,风险相对可控
3. **三类买卖点**
- 原理:中枢突破确认信号
- 识别方法:价格突破前中枢边界并形成有效分型
- 应用:趋势延续的确认信号,适合追踪趋势
指标特点
多级别结构分析
本指标支持多级别联动分析:
- 通过级别参数区分不同级别结构
- 高级别趋势指导低级别操作
- 实现级别间的协同判断逻辑
- 支持显示次级别中枢功能
结构可视化
- 笔结构:根据选择的笔类型显示
- 线段结构:按照选定的线段模式呈现
- 中枢区域:颜色渐变标识不同强度
技术实现说明
数据结构设计
指标设计了完整的面向对象结构:
- Pen结构:存储笔的方向、时间、价格等属性
- Segment结构:管理线段及其组成笔
- Pivot结构:表示中枢范围和特性
- Grade结构:区分不同级别的分析结果
使用指南
参数设置
- 笔的类型:选择老笔、新笔、4K或严笔以适应不同分析需求
- 线段模式:根据交易策略选择合适的线段计算方式
- 买卖点过滤:根据需要启用不同的过滤机制
- 中枢显示:选择是否显示次级别中枢
- 背离设置:选择背离类型、显示方式和样式
- 策略设置:配置与买卖点相关的交易策略选项
策略应用配置
- 跟随线段:根据线段方向进行交易
- 买卖点参与设置:可选择性参与一类、二类和三类买卖点
- 买卖点条件限制:可设置买卖点需要在中枢形成后出现
- 防止过早进场:可要求一类买卖点至少出现一个中枢后或至少5笔后才参与
- 二类买卖点安全性控制:可选择仅在未出现三类买卖点的情况下参与
实际应用建议
- 结合市场环境选择合适的笔类型和线段模式
- 针对不同品种和时间周期调整过滤设置
- 通过多级别分析提高判断准确性
- 使用背离指标确认一类买卖点的有效性
- 根据策略风格选择适合的策略配置参数
技术特点与价值
本指标通过系统化实现缠论结构分析,提供了一种客观的技术分析工具。它的核心价值在于:
1. 将复杂的缠论理论系统化为可计算的结构
2. 提供多种笔、线段判断方法以适应不同市场环境
3. 完善的买卖点过滤系统大幅提高信号质量
4. 多级别联动分析提供全面市场视角
*本指标仅提供技术分析参考,不构成投资建议。用户应根据自身风险承受能力和投资目标进行判断。*

Umesh BC IST 3:30 AM Session Tracker + 4H Candles📌 IST 3:30 AM Session Tracker + 4H Candle Marker
This indicator is designed for traders who follow Indian Standard Time (IST) and want precise session tracking and 4H candle insights.
🔧 Features:
🕒 Daily Session Start at 3:30 AM IST
Automatically detects and marks the beginning of each new trading day based on 3:30 AM IST, not midnight.
Displays session Open, High, and Low lines.
Background shading for each session.
Customizable alert when a new day starts.
🟧 4H Candle Start Markers (IST Time)
Identifies every new 4-hour candle that starts at:
3:30, 7:30, 11:30, 3:30 PM, 7:30 PM, 11:30 PM IST
Adds a vertical line and label ("🟧 4H") above the candle.
Plots a dynamic line for the 4H candle's opening price.
Includes optional alert for new 4H candles.
🔔 Alerts Included:
"🕒 New IST Day Start": Triggers at 3:30 AM IST.
"🟧 New 4H Candle": Triggers at each 4H candle start (IST).
✅ Best for:
Intraday, swing, and institutional traders using IST-based analysis.
Those wanting more accurate daily sessions and clear candle structuring.

ICT SMC Liquidity Grabs and OBsICT SMC Liquidity Grabs + Order Blocks + Fibonacci OTE Levels
A High-Probability Entry Engine for Smart Money Concept Traders
This script combines three powerful Smart Money Concepts (SMC) into a single tool: Liquidity Grabs, Order Block Zones, and Fibonacci OTE Levels, allowing traders to identify institutional entry models with clean, rule-based visual signals.
It’s designed to simplify SMC trading by highlighting confluence zones where price is likely to reverse or continue — with clear visual zones, entry arrows, and take profit projections.
🔍 What This Script Does:
Detects Liquidity Grabs
Identifies when price sweeps above/below the highest high or lowest low within a user-defined lookback period and closes back inside.
Plots orange labels on the chart to signal potential liquidity events (LG-H / LG-L).
Plots Order Blocks After Liquidity Grabs
After a liquidity grab, the script looks for displacement candles (strong bullish or bearish moves) and draws highlighted OB zones extending several bars to the right.
These zones represent potential institutional footprints for price reversals.
Draws Fibonacci OTE Levels (Optimal Trade Entry)
Uses recent swing high and low pivots to automatically calculate OTE zones (default: 62% and 75% retracement levels).
Draws these retracement zones for both bullish and bearish setups.
Marks Valid OTE Entry Zones
Buy/Sell zones only trigger when:
A liquidity grab occurs,
Price enters the OTE zone,
And a strong confirming candle is present.
Plots green/red arrows for valid buy/sell OTE entries.
Auto-Draws Take Profit Zones
TP1 = Previous swing high/low
TP2 = Risk-based R-multiplied extension (e.g., 1.5R — customizable)
Alerts
Triggers alerts when valid buy or sell OTE setups are detected.
⚙️ Customization Features:
Toggle each feature: Liquidity Grabs, Order Blocks, Fibonacci OTE levels
Set Fibonacci retracement percentages (e.g., 0.62 / 0.75)
Adjust lookback window for liquidity detection
Customize the take-profit multiplier (R-based)
Full control over visuals: colors, labels, and lines
💡 How to Use:
Use this script to scan for high-confluence trade setups based on Smart Money principles.
Combine with session timing (e.g., New York open), major swing structure, or Kill Zone windows for maximum edge.
Look for arrows inside OB zones or OTE levels following liquidity sweeps for cleaner entries.
🔗 Works Best With:
✅ First FVG — Opening Range Fair Value Gap Detector: Identify early inefficiencies to set the narrative for the day.
✅ Liquidity Levels — Smart Swing Lows: Spot key structural lows that can fuel stop hunts and reversals.
✅ ICT Turtle Soup — Liquidity Reversal: Add a classic reversal pattern to your toolkit to catch fakeouts cleanly.
Together, these tools build a complete Smart Money ecosystem for entry precision, risk management, and price behavior forecasting.

ICT Turtle Soup (Liquidity Reversal)ICT Turtle Soup — Liquidity Reversal Detection
Trap the Trap: A Precision Reversal Strategy from the Inner Circle Trader Playbook
This indicator implements the Turtle Soup liquidity reversal setup — a widely used ICT (Inner Circle Trader) concept that targets false breakouts beyond recent swing highs or lows. These patterns typically occur when price grabs liquidity above or below a known level, then snaps back, trapping retail traders and creating a high-probability reversal scenario.
🔍 What This Script Does:
Detects Liquidity Sweeps Above/Below Key Swing Levels
Uses a customizable swing lookback to identify recent swing highs and lows.
Triggers a Bearish Turtle Soup when price runs above a previous swing high and closes back below.
Triggers a Bullish Turtle Soup when price sweeps below a prior swing low and closes back above.
Plots Clear Visual Signals
Reversal signals appear as 🐢🔻 (Bearish) or 🐢🔺 (Bullish) markers directly on your chart.
Optional labels can be enabled for enhanced journaling and review.
Real-Time Alerts
Receive alert notifications when a Turtle Soup setup is detected — ideal for scalpers or intraday traders watching for reversals around liquidity pools.
⚙️ Customization Options:
Set the swing lookback sensitivity (default: 5)
Enable or disable labels
Choose label font size
Customize colors for bullish and bearish signals
💡 How to Use:
Deploy on intraday timeframes (e.g. 5m–15m) for high-resolution liquidity analysis.
Watch for signals at key highs/lows, session extremes, or zones where liquidity is likely resting.
Combine with tools like FVGs, Order Blocks, and OTE zones for layered confirmation.
🔗 Combine With These Tools for a Complete SMC Edge:
✅ First FVG — Opening Range Fair Value Gap Detector
✅ ICT SMC Liquidity Grabs + OB + Fibonacci OTE Levels
✅ Liquidity Levels — Smart Swing Lows
Together, these tools form a high-precision Smart Money toolkit — helping traders map, anticipate, and act on institutional-level liquidity events with clarity and confidence.

ICT Turtle Soup (Liquidity Reversal)ICT Turtle Soup — Liquidity Reversal Detection
Classic Liquidity Trap Reversal Strategy for Smart Money Traders
This indicator implements the ICT Turtle Soup concept — a classic liquidity-based reversal pattern — which occurs when price runs above or below a recent swing level to grab liquidity, then sharply reverses. This pattern is commonly used in Smart Money Concepts (SMC) and Inner Circle Trader (ICT) strategies to anticipate false breakouts and high-probability reversals.
🔍 What This Script Does:
Identifies Swing Highs & Lows
Detects recent swing highs and lows using a customizable lookback period.
Tracks Liquidity Grabs
A bearish Turtle Soup setup is triggered when price breaks above a recent swing high but closes back below it.
A bullish Turtle Soup setup is triggered when price breaks below a recent swing low but closes back above it.
These conditions often signal liquidity traps, where price sweeps resting orders before reversing.
Plots Signals Directly on the Chart
Turtle Soup setups are marked with 🐢🔻 (bearish) and 🐢🔺 (bullish) labels.
Optional full-text labels can also be displayed for clarity and journaling.
Includes Alert Conditions
Alerts can be enabled to notify you of bullish or bearish Turtle Soup reversals in real-time.
⚙️ Customization Features:
Adjustable swing lookback period
Enable/disable Turtle Soup labels
Set label font size
Choose your preferred bullish/bearish signal colors
💡 How to Use:
Add this script to your chart (ideally on intraday timeframes such as 5m–15m).
Wait for a Turtle Soup signal near a key swing high/low or liquidity zone.
Combine with other confirmation tools (e.g., FVGs, Order Blocks, OTE) for stronger setups.
Use alerts to stay ahead of fast-moving reversals.
🧠 Why It Works:
Turtle Soup setups are rooted in liquidity theory — they exploit the market’s tendency to sweep obvious swing levels before reversing. These moves often trap retail traders and mark the beginning of Smart Money entries.
🔗 Best Used With:
Maximize the edge by combining this with other SMC tools:
✅ First FVG — Opening Range Fair Value Gap Detector
✅ ICT SMC Liquidity Grabs + OB + Fibonacci OTE Levels
✅ Liquidity Levels — Smart Swing Lows
Together, they create a complete ecosystem for identifying, confirming, and executing liquidity-driven trade setups with precision.

Liquidity Levels (Smart Swing Lows)Liquidity Levels — Smart Swing Low Detection
Efficient Liquidity Sweep Visualization for Smart Money Traders
This script automatically identifies and plots liquidity-rich swing lows based on pivot logic, filters them to remove redundant levels, and overlays daily highs/lows for added context — giving Smart Money Concept (SMC) traders a clean, actionable map of liquidity.
It’s designed to be minimal yet powerful: perfect for spotting potential liquidity grabs, mitigation zones, and sweep targets with zero chart clutter.
🔍 What This Script Does:
Detects Smart Swing Lows
Uses fixed pivot detection (left = 3, right = customizable) to identify structurally significant swing lows.
Filters out swing lows that are too close together using a percentage-based spacing threshold to reduce noise.
Mitigation Cleanup Logic
Tracks whether recent price action breaches past swing lows.
If breached, the swing level is automatically removed, keeping only relevant, unmitigated liquidity levels on your chart.
Plots Daily Highs and Lows
Each new trading day, horizontal rays mark the prior day’s high and low — useful for identifying resting liquidity and possible sweep zones.
Labeling and Style Customization
Optional labels for swing lows.
Full control over label size, color, and visibility to match any chart aesthetic.
Timeframe Filtering
Runs exclusively on 5m, 10m, and 15m charts to ensure optimal reliability and signal clarity.
⚙️ Customization Features:
Pivot sensitivity (Right side control)
Minimum distance between swing lows (in %)
Label visibility, size, and color
Line width and colors for both swing levels and daily highs/lows
Mitigation cleanup lookback length
💡 How to Use:
Add the script to a qualifying intraday chart (5–15m).
Use the swing low levels to monitor liquidity-rich zones.
Combine with your personal strategy to identify liquidity grabs, potential reversal zones, or entry points following a sweep.
Let the built-in cleanup logic remove any already-mitigated levels so you can focus on active targets.
🚀 What Makes It Unique:
This isn’t just another pivot plotter — it’s a smart, self-cleaning SMC tool designed for modern liquidity-based trading strategies.
A must-have for traders using concepts like liquidity grabs, mitigation blocks, or sweep-to-reverse trade models.
🔗 Best used in combination with:
✅ First FVG — Opening Range Fair Value Gap Detector: Pinpoint the day’s first imbalance zone for intraday setups.
✅ ICT SMC Liquidity Grabs + OB + Fibonacci OTE Levels: Confluence-based entries powered by liquidity logic, order blocks, and premium/discount zones.
Used together, these scripts form a complete Smart Money toolkit — helping you build high-probability setups with confidence, clarity, and clean charts.

ICT SMC Liquidity Grabs and OBsICT SMC Liquidity Grabs + OB + Fibonacci OTE Levels
Smart Money Concepts Trading Assistant
This script is built for traders who follow ICT (Inner Circle Trader) and Smart Money Concepts. It intelligently combines three critical components of SMC trading: Liquidity Grabs, Order Blocks, and Fibonacci-based Optimal Trade Entry (OTE) zones — giving traders visual cues for potential high-probability reversals and entry points.
🔍 What This Script Does:
Detects Liquidity Grabs
Identifies swing highs/lows where price sweeps liquidity, then immediately reverses.
Labels them with orange markers when price takes out previous highs/lows but closes back inside.
Draws Order Blocks
After a liquidity grab, the script looks for strong bullish or bearish candles and automatically highlights the OB zone.
These OB zones are visualized with transparent colored boxes extending several bars forward.
Plots Fibonacci OTE Levels
Uses recent swing high/low pivots to dynamically draw customizable OTE retracement levels (e.g., 62% and 75%) for both long and short setups.
Highlights Optimal Entry Zones
Marks valid OTE-based buy/sell opportunities only when:
Liquidity has been taken,
Price enters the OTE zone,
And a strong confirming candle appears.
Adds visual zones, trade labels, and optional alerts for each qualified entry.
Includes Take Profit Targets
Automatically calculates take-profit levels based on previous structure and risk-reward ratios.
TP1 is the previous swing, and TP2 is an extended R-multiple (customizable by user).
⚙️ Customization Options:
Toggle each feature (Liquidity Grabs, OBs, Fibonacci Levels)
Adjust Fibonacci levels (default: 62% and 75%)
Set lookback period for liquidity checks
Customize the R-multiple for TP2 levels
💡 How to Use:
Enable desired features from the input panel.
Watch for Buy/Sell OTE zones highlighted in green/red.
Confirm with liquidity sweep and OB support for stronger signals.
Use the automatically generated TP levels to manage risk.
🚀 What Makes It Unique:
Unlike other open-source mashups, this script synchronizes multiple SMC concepts into a single tool that:
Waits for high-confidence conditions (not just blind fib or OB detection)
Validates entries using multiple confluences
Visually marks actionable setups
Automates trade management zones
Whether you're trend-trading, scalping, or swing trading ICT-style, this tool offers a streamlined, smart-money-aligned workflow directly on your chart.

ENIGMA 369 ENIGMA 369 is a unique Pine Script indicator that combines two complementary trading systems: Break of Structure (BOS) Detection and Session-Based Sniper Signals.
Designed to help traders identify market structure shifts and potential intraday setups, it overlays on the chart to highlight key levels and momentum-driven opportunities. The indicator’s originality lies in its integration of pattern-based BOS analysis (inspired by Smart Money concepts) with time- and trend-filtered Sniper signals, creating a cohesive tool for both swing and intraday trading.
Unlike standalone breakout or scalping indicators, ENIGMA 369 uses:
BOS Logic: A specific two-candle pattern sequence to detect structural shifts, filtered by ATR for significance.
Sniper Logic: Momentum-based signals during high-volatility sessions, optionally aligned with EMA trends.
This synergy allows traders to assess market direction strategically (via BOS) and time entries tactically (via Sniper), all within one indicator.
What It Does
ENIGMA 369 performs two distinct functions:
Break of Structure (BOS) Detection:
Identifies potential support/resistance levels using BullBear (bullish candle followed by bearish) and BearBull (bearish followed by bullish) candle pairs.
Confirms breakouts when price sustains above (bullish) or below (bearish) these levels for a set number of bars.
Draws horizontal lines at confirmed breakout levels, which persist until price crosses a user-defined buffer zone.
Sniper Momentum Signals:
Detects buy/sell setups during user-specified trading sessions (e.g., London/US), based on candle momentum (close relative to midpoint, higher highs/lower lows).
Optionally filters signals with an EMA to align with the broader trend.
Plots lines at the candle’s high/low and 50% wick levels, serving as reference points for entries or stops, removed when price crosses them.
How It Works
ENIGMA 369 relies on price action, market timing, and trend context to generate signals. Here’s how each component operates:
BOS Logic:
Pattern Detection: Scans for two-candle patterns where the first candle is significant (size exceeds an ATR-based threshold) and the second opposes it. For example, a BullBear pair marks the first candle’s high as a potential resistance.
ATR Filter: Uses the Average True Range (default: 14 periods) to ensure the first candle’s range or body is substantial, reducing noise. Users can adjust the ATR multiplier (default: 0.5).
Confirmation: Requires price to close above/below the stored level for a user-defined number of bars (default: 1) to confirm a breakout.
Line Management: Plots green (bullish) or red (bearish) lines at confirmed levels, extending for a set number of bars (default: 10). Lines are deleted if price crosses a buffer (percentage of price or ATR-based, default: 0.1).
Visualization: Optionally highlights pattern candles with transparent green/red backgrounds.
Sniper Logic:
Momentum Signals: Identifies buy signals when a candle closes above its midpoint (high+low)/2 and has a lower low than the prior candle, indicating potential bullish momentum. Sell signals require a close below the midpoint and a higher high.
Session Filter: Limits signals to user-defined London/US session hours (default: 1-23 UTC, adjustable to specific hours like 7-11 UTC for London).
EMA Filter: Optionally uses a 50-period EMA (adjustable) to ensure buy signals occur in uptrends (rising EMA) and sell signals in downtrends (falling EMA).
Line Plotting: Draws blue lines for buy signals (at the low and 50% of the lower wick) and orange lines for sell signals (at the high and 50% of the upper wick). Lines extend right until price crosses them, managed via arrays for efficiency.
Dynamic Removal: Lines are automatically deleted when price breaches them, reflecting changing market conditions.
Why Combine BOS and Sniper?
The integration of BOS and Sniper logic is purposeful and synergistic:
BOS provides a strategic view by identifying structural shifts, helping traders understand the market’s directional bias (e.g., bullish after a confirmed high breakout).
Sniper offers tactical entry points within these trends, focusing on high-volatility sessions where momentum is likely to drive clear moves.
Together, they enable traders to align short-term trades with long-term structure, reducing the risk of trading against the trend. For example, a trader can wait for a bullish BOS confirmation before taking Sniper buy signals, enhancing setup reliability.
This combination is original because it merges Smart Money-inspired BOS detection with a session-based momentum system, a pairing not commonly found in single indicators. It avoids redundant mashups by ensuring each component serves a distinct yet complementary role.
How to Use It
Setup:
Apply ENIGMA 369 to a TradingView chart (Pine Script v5). The chart shown here uses a clean H1 candlestick setup to highlight BOS and Sniper outputs clearly.
Customize settings:
BOS:
ATR Period (default: 14), Min Candle Size (default: 0.5x ATR): Adjust for pattern sensitivity.
Confirmation Bars (default: 1): Set for faster/slower breakouts.
Buffer Type (Percentage/ATR), Buffer Zone Value (default: 0.1): Control line deletion.
Show Lines (default: true), Highlight Candle Pairs (default: false): Enable visuals.
Customize line colors (green/red) and width/length.
Sniper:
London/US Start/End Hours: Set to match your asset’s volatility (e.g., 7-11 UTC for London forex).
EMA Filter (default: true), EMA Period (default: 50): Enable for trend alignment.
Customize line styles (Solid/Dotted/Dashed) and colors (blue/orange) to distinguish from BOS.
Suggested timeframes: H1-H4 for BOS (swing trading), M5-M15 for Sniper (intraday).
Trading with BOS:
Monitor for green (bullish) or red (bearish) lines indicating confirmed breakouts.
Use lines as support/resistance:
Bullish BOS: Consider longs above the line, with stops below the line or buffer.
Bearish BOS: Consider shorts below the line, with stops above the line or buffer.
Line deletion signals a potential reversal or level invalidation.
Trading with Sniper:
Look for blue (buy) or orange (sell) lines during active sessions:
Buy: Enter long at the low or 50% wick line, with stops below the low and targets at resistance.
Sell: Enter short at the high or 50% wick line, with stops above the high and targets at support.
Use EMA filter to avoid counter-trend signals.
Lines disappear when crossed, indicating the setup’s completion or invalidation.
Alerts:
Set alerts for:
“Bullish/Bearish BOS Confirmed” for structural shifts.
“Sniper Buy/Sell Alert” for intraday setups.
Combine with volume, key levels, or news for confirmation.
Best Practices:
Use BOS to confirm trend direction before taking Sniper signals.
Test settings on your asset/timeframe via backtesting.
Apply stop-losses and risk-reward ratios (e.g., 1:2) for discipline.
The chart example shows BOS lines (green/red) and Sniper lines (blue/orange) on an H1 chart, ensuring clarity.
Underlying Concepts
Market Structure (BOS): Identifies turning points where supply/demand shifts, using two-candle patterns to mark significant levels, similar to order block concepts.
Momentum and Timing (Sniper): Targets entries during high-liquidity sessions, using candle midpoint and wick analysis to capture momentum-driven moves.
Trend Context: EMA ensures signals align with the market’s direction, reducing false positives.
Price Action: Both systems rely on raw price behavior, avoiding lagging oscillators for timely signals.
Limitations
BOS may lag in fast markets; reduce confirmation bars for scalping.
Sniper signals depend on session settings; ensure alignment with your asset’s volatility.
Multiple lines may clutter charts; adjust colors/styles for clarity.
Not a standalone system; combine with other analysis for best results.
Disclaimer
ENIGMA 369 is a tool to identify potential trading setups, not a guaranteed profit system. Past performance does not predict future results. Backtest thoroughly and use with proper risk management.
Conclusion
ENIGMA 369 offers a structured approach to trading by combining BOS’s structural insights with Sniper’s precise, session-based entries. Its unique integration makes it suitable for traders seeking to align strategic and tactical decisions. Customize it to your style, test it rigorously, and use it to enhance your market analysis.

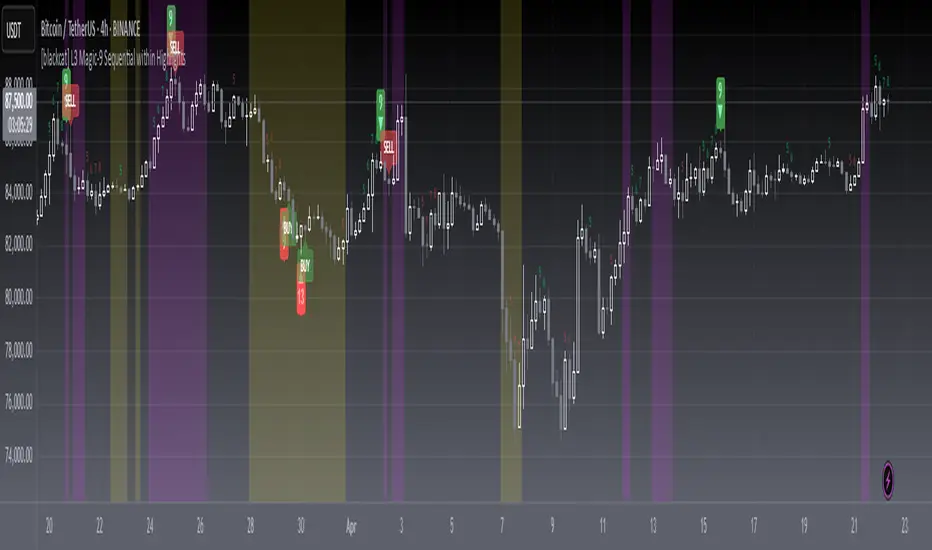
[blackcat] L3 Magic-9/13 with Reversal Points ConfirmationOVERVIEW
The L3 Magic-9/13 with Reversal Points Confirmation indicator is designed to help traders identify potential reversal points in the market using a sequential approach. This indicator adopts the "buy when fearful, sell when greedy" philosophy, focusing on capturing key reversal moments 📉↗️. It plots labels on the chart to indicate these reversal points and uses custom functions to filter occurrences based on specific conditions.
FEATURES
Identifies consecutive price movements to detect potential reversals.
Plots labels for various sequential patterns:
High Sequentials: 5, 6, 7, 8, 9, 12, 13
Low Sequentials: 5, 6, 7, 8, 9, 12, 13
Uses custom functions to count consecutive occurrences and filter conditions.
Provides visual confirmation of reversal points with colored labels 🏷️.
Allows customization of sequence lengths and lookback periods ⚙️.
HOW TO USE
Add the indicator to your TradingView chart by selecting it from the indicators list.
Observe the plotted labels indicating potential reversal zones:
Green labels for buy signals ('B').
Red labels for sell signals ('S').
Customize the sequence lengths and lookback periods as needed in the settings panel.
Combine this indicator with other tools for confirmation before making trading decisions.
LIMITATIONS
The indicator relies heavily on sequential patterns, which might not capture all market nuances.
False signals can occur in ranging or sideways markets 🌪️.
Users should always confirm signals with other forms of analysis.
NOTES
Ensure that you have sufficient historical data available for accurate calculations.
Test the indicator thoroughly on demo accounts before applying it to live trading 🔍.
Understand the concept of buying at bottoms and selling at tops before using this indicator.

[blackcat] L3 Magic-9 Sequential SetupOVERVIEW
The L3 Magic-9 Sequential Setup indicator is designed to identify potential reversal points in the market using a sequential pattern analysis. This script plots specific labels on the chart based on predefined conditions, helping traders spot key levels where price reversals might occur 📉↗️.
FEATURES
Identifies consecutive occurrences of price movements above or below certain thresholds.
Plots labeled markers on the chart for easy visualization:
Red Labels: Indicate potential sell signals (e.g., '5', '6', '7', etc.).
Green Labels: Indicate potential buy signals (e.g., '5', '6', '7', etc.)
Uses custom functions to filter and count occurrences over specified lookback periods ⚙️.
Changes bar colors based on detected signals for enhanced visual cues 🎨.
Supports extensive customization through input parameters for fine-tuning the setup.
HOW TO USE
Add the indicator to your TradingView chart by selecting it from the indicators list.
Observe the plotted labels ('5', '6', '7', etc.) indicating potential reversal zones.
Pay attention to bar color changes that confirm the identified patterns.
Combine this indicator with other tools for confirmation before making trading decisions.
LIMITATIONS
The indicator relies heavily on sequential patterns, which may not capture all market nuances.
False signals can occur in ranging or sideways markets 🌪️.
Users should always confirm signals with other forms of analysis.
NOTES
Ensure that you have sufficient historical data available for accurate calculations.
Test the indicator thoroughly on demo accounts before applying it to live trading 🔍.
Customize input parameters as needed to fit your trading strategy.

[blackcat] L3 Magic-9 Sequential within HighlightsOVERVIEW
The L3 Magic-9 Sequential within Highlights indicator is designed to identify potential buy and sell signals based on sequential price patterns. This script uses custom functions to detect consecutive occurrences of specific conditions and highlights these patterns on the chart with labels and background colors 📊🔍.
FEATURES
Detects sequential price patterns for both bullish and bearish movements:
High sequences: 5, 6, 7, 8, 9, 12, 13 bars.
Low sequences: 5, 6, 7, 8, 9, 12, 13 bars.
Plots characters ('5', '6', etc.) and shapes (arrows) on the chart to indicate detected sequences 🏷️↗️↘️.
Uses a customizable period for calculating averages of price differences.
Highlights overbought and oversold conditions using background colors 🎨.
Generates buy ('B') and sell ('S') labels based on filtered occurrences and index values.
HOW TO USE
Add the indicator to your TradingView chart by selecting it from the indicators list.
Observe the plotted characters and arrows indicating detected sequential patterns.
Monitor the background color changes to identify overbought and oversold conditions.
Look for generated buy ('B') and sell ('S') labels for potential trading opportunities.
Customize the period and thresholds in the settings panel as needed ⚙️.
LIMITATIONS
The indicator relies heavily on sequential price patterns, which might not capture all market nuances.
False signals can occur in ranging or sideways markets 🌪️.
Users should always confirm signals with other forms of analysis before making trading decisions.
NOTES
Ensure that you have sufficient historical data available for accurate calculations.
Test the indicator thoroughly on demo accounts before applying it to live trading 🔍.
Adjust the period and threshold inputs to fit your preferred trading strategy.
SP Line (Multi-Timeframe)SP Line (Multi-timeframe) Indicator Introduction
SP Line (Multi-timeframe) is a powerful technical analysis indicator designed to identify Swing Points across different timeframes. This indicator can display key support and resistance levels from up to six different timeframes simultaneously on a single chart, helping traders comprehensively understand market structure to develop more thorough trading strategies. By clearly marking high and low swings from different periods, traders can quickly identify key price levels across multiple timeframes, enhancing the accuracy of trading decisions.
Key Features
Multi-timeframe Analysis: Display swing points from up to six different timeframes simultaneously
Color Coding: Each timeframe uses a unique color for easy identification
Automatic Touch Detection: Automatically removes lines when price touches the swing point
Bullish/Bearish Distinction: Different colors for bullish (low) and bearish (high) swing points
Customizable Appearance: Adjustable line length, width, and style (solid, dashed, or dotted)
Timeframe Labels: Optional display of timeframe labels to identify the source of each line
Performance Optimization: Automatically limits the maximum number of lines per timeframe to ensure smooth chart operation
Use Cases
Multi-timeframe Support/Resistance Identification: View key price levels from all important timeframes at a glance
Trend Confirmation: Confirm market trend direction using swing points from multiple timeframes
High-probability Trading Zones: Identify high-probability trading areas when swing points from multiple timeframes cluster in specific regions
Trade Planning: Plan trading strategies in advance by determining potential entry points, stop losses, and targets
Market Structure Analysis: Assess overall market structure by observing the arrangement of highs and lows across different timeframes
Dynamic Support/Resistance: Track touched and untouched support/resistance levels to understand market dynamics
Configuration Options
Timeframe Settings (1-6):
Enable/Disable: Choose whether to display swing points for specific timeframes
Timeframe Selection: Choose from multiple timeframes ranging from 1-minute to monthly
Color Settings: Customize colors for bullish and bearish swing points for each timeframe
Line Settings:
Horizontal Line Length: Control how far lines extend to the right (1-400)
Line Width: Adjust the thickness of lines (1-5)
Line Style: Choose between solid, dashed, or dotted lines
Text Settings:
Show Timeframe Labels: Display the corresponding timeframe on each line
Label Size: Adjust label text size from Tiny to Huge
Basic Settings:
Maximum Lines Per Timeframe: Limit the maximum number of lines displayed per timeframe (10-100)
使用场景
多周期支撑/阻力识别: 一目了然地查看所有重要时间周期的关键价格水平
趋势确认: 使用多个时间周期的摆动点确认市场趋势方向
高概率交易区域: 当多个时间周期的摆动点聚集在特定区域时,识别高概率交易区域
交易计划制定: 提前规划交易策略,确定潜在的入场点、止损位和目标位
市场结构分析: 通过观察不同周期的高低点排列,判断市场整体结构
动态支撑阻力: 跟踪已被触及和尚未触及的支撑阻力位,了解市场动态变化

Bar Painting [iFarsheed]
Bar Painting
Overview:
The "Bar Painting " indicator is designed for traders who follow price action strategies inspired by Al Brooks.
This tool colors candles on your chart, making it easy to identify different candle types like trend bars, dojis, and pin bars without complex calculations. By simply observing the colors, you can quickly understand market dynamics.
Features:
Candle Coloring:
Bullish (up) and bearish (down) trend bars are highlighted in distinct colors for easy recognition.
Candles that do not fit these patterns appear in the default chart color, indicating they do not represent significant moves.
Visual Clarity:
The color coding provides a quick visual reference, allowing you to grasp market conditions at a glance.
No Calculations Required:
You don’t need to perform any calculations; just look at the colors to understand the strength of the market.
How to Use:
Customize Settings:
Adjust the colors of trend bars to ensure they contrast well with your chart background for improved visibility.
Use the settings to choose which candle types you want to highlight based on your trading preferences.
Analyze Candle Patterns:
Look at the colored candles to quickly identify trend bars, dojis, and pin bars that may signal potential market movements.
Informed Decision Making:
Use the highlighted candle patterns to assist in making trading decisions, such as identifying possible entry and exit points.
Important Note:
This coloring scheme is optimized for light mode charts. In dark mode, the colors may not display correctly.
To ensure proper color display, please set the visual order of the indicator to "Bring to Front."
Future Updates:
This indicator is an initial version, and more features will be added in the future.
If you have any suggestions or feedback, please feel free to share your thoughts in the comments section of the indicator.
Good luck with your trading!
-iFarsheed-

Bounty SeekerBounty Seeker - Advanced Market Structure & Order Block Detection
A sophisticated indicator that identifies high-probability reversal zones through the analysis of market structure, volume patterns, and institutional order blocks. This tool helps traders spot potential reversals and fake-outs with precision.
Core Components:
1. Pivot Detection System
• Smart pivot high/low identification
• Volume-enhanced confirmation
• RSI confluence validation
• Real-time market structure analysis
2. Order Block Detection
• Institutional buying/selling zones
• Historical support/resistance levels
• Smart volume threshold analysis
• Dynamic level adaptation
Signal Types:
1. Bull Pivots (White X)
• Strong volume confirmation
• RSI oversold conditions
• Price action validation
• Order block confluence
2. Bear Pivots (Purple X)
• Volume surge confirmation
• RSI overbought alignment
• Bearish price action
• Resistance zone validation
3. Fake Pivots (Orange X)
• Low volume warning signals
• Trap zone identification
• False breakout detection
• Risk management guide
Visual Elements:
• Dashed Lines: Order block zones
• White/Purple X's: Major pivot points
• Orange X's: Potential fake moves
• Dynamic support/resistance levels
Best Usage Practices:
• Most effective on 1H+ timeframes
• Focus on major market pairs
• Wait for complete signal formation
• Combine with trend direction
• Monitor volume confirmation
• Use proper position sizing
The indicator excels at:
1. Identifying potential reversal zones
2. Detecting institutional order blocks
3. Warning of potential fake moves
4. Providing clear entry/exit levels
5. Highlighting strong volume zones
Risk Management:
• Always wait for signal confirmation
• Use appropriate stop loss levels
• Consider multiple timeframe analysis
• Don't trade against major trends
• Monitor volume for validation
This indicator combines advanced market structure analysis with volume profiling to help traders identify high-probability trading opportunities while warning of potential traps and fake-outs.
Note: Past performance does not guarantee future results. Always use proper risk management techniques.

Head Hunter HHHead Hunter HH - Advanced Market Structure & Volume Analysis Indicator
This indicator combines volume analysis, price action, and VWAP to identify high-probability trading opportunities across multiple timeframes.
Key Features:
• Smart Volume Analysis: Detects institutional volume patterns using dynamic thresholds
• VWAP-Based Market Structure: Multiple standard deviation bands for precision entry/exit
• Daily Level Integration: Previous day's high, low, close, and current day's open
• Advanced Signal Classification: Regular, Super Strong, and Scalp signals
Signal Types:
1. Regular Signals (White/Purple Triangles)
• Volume-confirmed reversals
• Institutional price levels
• Technical momentum alignment
2. Super Strong Signals (Green/Red Diamonds)
• High-volume breakouts
• Strong momentum confirmation
• Multiple timeframe alignment
3. Scalp Signals (Green/Magenta Circles)
• Quick reversal opportunities
• VWAP deviation analysis
• Volume surge confirmation
Visual Components:
• VWAP with Standard Deviation Bands
• 50 MA (optional)
• Daily Reference Levels
• Color-coded signals based on strength
• Bar color changes on confirmed signals
Best Practices:
• Most effective on higher timeframes (1H+)
• Use with major pairs/instruments
• Combine signals with support/resistance
• Monitor volume confirmation
• Wait for candle close confirmation
This indicator helps identify institutional order flow and high-probability reversal zones by analyzing volume patterns, price action, and market structure, providing traders with multiple confirmation layers before entry.
Note: Results may vary based on market conditions and timeframe selection. Always use proper risk management.
Supertrend Hombrok BotSupertrend Hombrok Bot – Automated Trading Strategy for Dynamic Market Conditions
This trading strategy script has been developed to operate automatically based on detailed market conditions. It combines the popular Supertrend indicator, RSI (Relative Strength Index), Volume, and ATR (Average True Range) to determine the best entry and exit points while maintaining proper risk management.
Key Features:
Supertrend as the Base: Uses the Supertrend indicator to identify the market's trend direction, generating buy signals when the market is in an uptrend and sell signals when in a downtrend.
RSI Filter: The RSI is used to determine overbought and oversold conditions, helping to avoid entries in extreme market conditions. Entries are avoided when RSI > 70 (overbought) and RSI < 30 (oversold), reducing the risk of false movements.
Volume Filter: The strategy checks if the trading volume is above the average multiplied by a user-defined factor. This ensures that only significant movements, with higher liquidity, are considered.
Candle Body Size: The strategy filters only candles with a body large enough relative to the ATR (Average True Range), ensuring that the price movements on the chart have sufficient strength.
Risk Management: The bot is configured to operate with an adjustable Risk/Reward Ratio (R:R). This means that for each trade, both Take Profit (TP) and Stop Loss (SL) are adjusted based on the market's volatility as measured by the ATR.
Automatic Entries and Exits: The script automatically executes entries based on the specified conditions and exits with predefined Stop Loss and Take Profit levels, ensuring risk is controlled for each trade.
How It Works:
Buy Condition: Triggered when the market is in an uptrend (Supertrend), the volume is above the adjusted average, the candle body is strong enough, and the RSI is below the overbought level.
Sell Condition: Triggered when the market is in a downtrend (Supertrend), the volume is above the adjusted average, the candle body is strong enough, and the RSI is above the oversold level.
Alerts:
Buy and Sell Alerts are configured with detailed information, including Stop Loss and Take Profit values, allowing the user to receive notifications when trading conditions are met.
Capital Management:
The capital per trade can be adjusted based on account size and risk profile.
Important Note:
Always test before trading with real capital: While the strategy has been designed based on solid technical analysis methods, always perform tests in real-time market conditions with demo accounts before applying the bot in live trading.
Disclaimer: This script is a tool to assist in the trading process and does not guarantee profit. Past performance is not indicative of future results, and the trader is always responsible for their investment decisions.

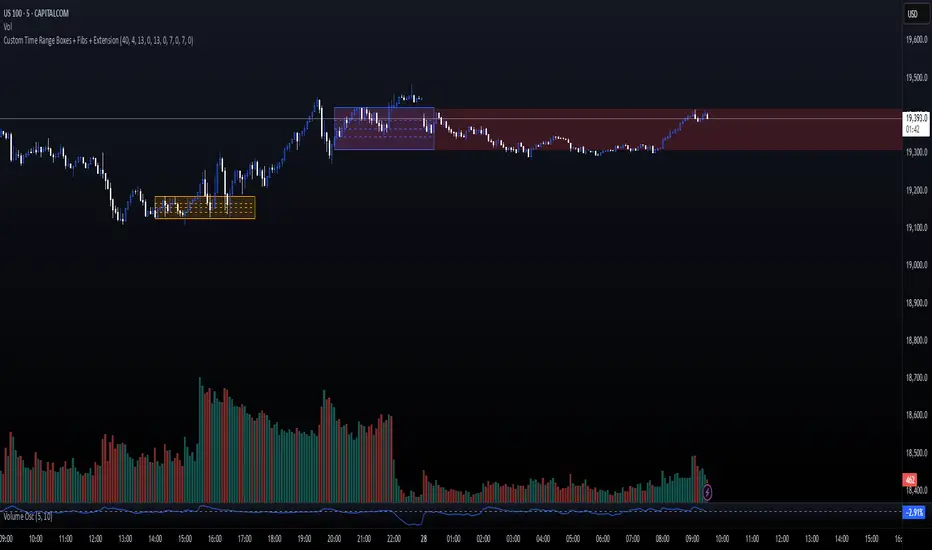
Custom Time Range Boxes + Fibs + ExtensionThis script draws two customizable time-range boxes per day, helping traders visualize key market sessions or activity windows. Each box is defined by start and end times that can be adjusted in the settings. You can also choose a custom color and extend the visual width of the box independently from the actual session time. Within each box, the indicator plots three Fibonacci levels: 0.3, 0.5, and 0.7. These levels are useful for identifying potential support, resistance, or retracement zones inside the session range. The script supports two separate time blocks, allowing you to track sessions like the New York Open and Power Hour simultaneously. All lines and boxes are drawn using bar_index for precision and control. The levels and box colors match for visual consistency. Perfect for intraday traders who want to track price behavior around key times. Clean, minimal, and performance-friendly — this tool adds clarity to your session-based strategy.
Master Simple IndicatorThe streamlined Pine Script, created by masterbtcltc, is a technical analysis indicator that overlays on a price chart to provide buy and sell signals based on a dynamic 120-day simple moving average (SMA). Here's how it works:
Dynamic Moving Average: Calculates a 120-day SMA (ma_dynamic) using closing prices to smooth out price fluctuations and identify trends.
Buy/Sell Signals:
Buy Signal: Triggered when the closing price crosses above the 120-day SMA (longSignal), indicating potential bullish momentum. A white triangle with "close" text appears below the bar.
Sell Signal: Triggered when the closing price crosses below the 120-day SMA (shortSignal), suggesting bearish momentum. A yellow triangle with "Short" text appears above the bar.
Alerts: Generates alerts for buy (Long Signal Alert) and sell (Short Signal Alert) signals, notifying users when the price crosses the SMA.
Visual Highlights:
Price vs. SMA: The area between the closing price and the 120-day SMA is filled with yellow if the price is above the SMA (bullish) or blue if below (bearish).
50-day vs. 120-day SMA: The area between the 50-day SMA and 120-day SMA is filled green when the 50-day SMA is above the 120-day SMA, indicating a stronger bullish trend.
Created by masterbtcltc, this indicator helps traders identify trend changes and potential entry/exit points based on price interactions with the 120-day SMA, with clear visual cues and alerts for decision-making.

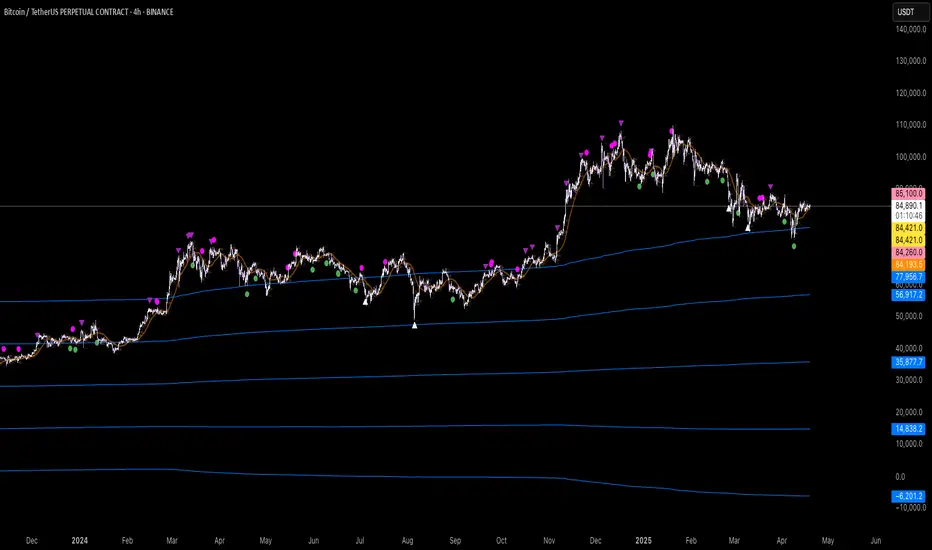
Master Litecoin Network Address Value Model BandThe Master Litecoin Network Address Value Model Band indicator compares Litecoin (LTC) and Bitcoin (BTC) network address activity to estimate LTC's value relative to BTC's price. It plots a band using new and total address ratios, adjusted by supply differences. Note: It excludes Litecoin's MWEB addresses, likely undervaluing the Litecoin network over time as MWEB adoption grows.

Master Litecoin Network Growth BandsThe "Master Litecoin Network Growth Bands" indicator (Pine Script v5) plots 26 horizontal bands on the Litecoin price chart (VANTAGE:LTCUSD) by dividing IntoTheBlock’s total Litecoin addresses by divisors (400 to 20,000,000). Each band (Band1 to Band26) is drawn with a white, thin line (linewidth=1), showing network growth relative to price to help identify support, resistance, or valuation levels. Note that this indicator does not include addresses on Litecoin’s MWEB (MimbleWimble Extension Blocks).

Master Litecoin Miner Sell PressureThe "Master Litecoin Miner Sell Pressure" indicator (Pine Script v5) tracks Litecoin miner selling pressure by comparing 14-day miner outflows to reserves, using IntoTheBlock data. It highlights high sell pressure with a blue background when the metric exceeds a 200-day Bollinger Band upper threshold, signaling potential bearish price pressure. Licensed under Mozilla Public License 2.0, adapted from © capriole_charles' Bitcoin indicator.
