SessionRangeLevels_v0.1SessionRangeLevels_v0.1
Overview:
SessionRangeLevels_v0.1 is a customizable Pine Script (v6) indicator designed to plot key price levels based on a user-defined trading session. It identifies the high and low of the session and calculates intermediate levels (75%, 50% "EQ", and 25%) within that range. These levels are projected forward as horizontal lines with accompanying labels, providing traders with dynamic support and resistance zones. The indicator supports extensive customization for session timing, time zones, line styles, colors, and more.
Key Features:
Session-Based Range Detection: Tracks the high and low prices during a specified session (e.g., 0600-0900) and updates them dynamically as the session progresses.
Customizable Levels: Displays High, 75%, EQ (50%), 25%, and Low levels, each with independent toggle options, styles (Solid, Dashed, Dotted), colors, and widths.
Session Anchor: Optional vertical line marking the session start, with customizable style, color, and width.
Projection Offset: Extends level lines forward by a user-defined number of bars (default: 24) for future price reference.
Labels: Toggleable labels for each level (e.g., "High," "75%," "EQ") with adjustable size (Tiny, Small, Normal, Large).
Time Zone Support: Aligns session timing to a selected time zone (e.g., America/New_York, UTC, Asia/Tokyo, etc.).
Alert Conditions: Triggers alerts when the price crosses any of the plotted levels (High, 75%, EQ, 25%, Low).
Inputs:
Session Time (HHMM-HHMM): Define the session range (e.g., "0600-0900" for 6:00 AM to 9:00 AM).
Time Zone: Choose from options like UTC, America/New_York, Europe/London, etc.
Anchor Settings: Toggle the session start line, adjust its style (default: Dotted), color (default: Black), and width (default: 1).
Level Settings:
High (Solid, Black, Width 2)
75% (Dotted, Blue, Width 1)
EQ/50% (Dotted, Orange, Width 1)
25% (Dotted, Blue, Width 1)
Low (Solid, Black, Width 2)
Each level includes options to show/hide, set style, color, width, and label visibility.
Projection Offset: Number of bars to extend lines (default: 24).
Label Size: Set label size (default: Small).
How It Works:
The indicator detects the start and end of the user-defined session based on the specified time and time zone.
During the session, it tracks the highest high and lowest low, updating the levels in real-time.
At the session start, it plots the High, Low, and intermediate levels (75%, 50%, 25%), projecting them forward.
Lines and labels dynamically adjust as new highs or lows occur within the session.
Alerts notify users when the price crosses any active level.
Usage:
Ideal for traders who focus on session-based strategies (e.g., London or New York open). Use it to identify key price zones, monitor breakouts, or set targets. Customize the appearance to suit your chart preferences and enable alerts for real-time trading signals.
Notes:
Ensure your chart’s timeframe aligns with your session duration for optimal results (e.g., 1-minute or 5-minute charts for short sessions).
The indicator overlays directly on the price chart for easy integration with other tools.
Chart patterns

Advanced ORB IndicatorAdvanced ORB (Opening Range Breakout) Indicator
Overview
The Advanced ORB Indicator is a sophisticated trading tool designed to capture high-probability breakout opportunities across multiple markets. By identifying the opening range of a trading session and detecting meaningful breakouts, this indicator helps traders enter trending moves with strong momentum while filtering out false signals.
Core Concept
The Opening Range Breakout strategy is based on the principle that the initial trading range of a session often defines key support and resistance levels. When price breaks convincingly beyond this range with proper confirmation, it frequently indicates the beginning of a directional move that can persist throughout the session.
Key Features
### Intelligent Market Detection
- Automatically identifies market type (US Stocks, Forex, Crypto, EU/Asia Stocks)
- Applies optimal default timings based on market characteristics
- Configurable time zones (Exchange, UTC, Local) for precise session timing
Customizable Session Settings
- Adjustable opening range duration (15-240 minutes)
- Flexible reset periods (Daily, Weekly, Monthly, or Never)
- Custom session start times to match specific market opens or pre-market periods
Advanced Signal Filtering
- Multi-factor confirmation system requiring strong candle bodies, proper wick ratios, and minimum breakout percentages
- Smart cooldown periods preventing clustered signals
- Retracement detection that resets signals after meaningful pullbacks
Quality Control Mechanisms
- Volume threshold filter for stronger conviction entries
- RSI-based filters to avoid overbought/oversold conditions
- Trend alignment validation using EMA and directional analysis
- Consecutive candle confirmation for higher reliability
Visual Clarity
- Clear high/low boundary visualization
- Comprehensive status panel showing current levels, trend status, and filter conditions
- Clean, non-repainting signal triangles at breakout points
Trading Applications
Stocks & ETFs
Perfect for capturing morning momentum after market open, especially effective on US equities where the first 30-60 minutes often set the tone for the day. Excellent for gap fills, trend continuations, and reversal confirmations.
Forex & Futures
Ideal for session-based strategies around London/New York opens, capturing institutional order flow as major players enter the market. Can be configured for H4/H1 longer-term breakouts in 24-hour markets.
Cryptocurrency
Powerful for identifying key breakout levels in volatile crypto markets, with adjustable parameters to filter out noise while catching significant moves. Especially effective during high-volume periods following consolidation.
Strategic Implementation
The indicator excels when used as part of a complete trading system. Consider these approaches:
1. Pure Momentum Strategy: Enter on signal, exit at fixed R:R or end of session
2. Trend Continuation: Only take signals in the direction of the higher timeframe trend
3. Support/Resistance Validation: Combine with key S/R levels for higher probability entries
4. Volume Profile Confirmation: Use in conjunction with volume profile to verify breakout significance
Optimization Tips
- Adjust Opening Range Duration based on market volatility (shorter for choppy markets, longer for trending)
- Increase filter requirements during uncertain market conditions
- Loosen filters during strong trending environments
- Use longer durations (120+ minutes) for swing trading setups
- Consider Weekly/Monthly reset periods for positional trading approaches
Performance Notes
The Advanced ORB Indicator is designed to produce fewer, higher-quality signals rather than frequent low-conviction entries. The multiple confirmation requirements mean you'll catch fewer false breakouts at the expense of occasionally later entries.
For best results, combine with proper risk management, position sizing, and an understanding of the broader market context.
*This indicator works on all timeframes but performs optimally on 1-minute to 15-minute charts for intraday trading and 1-hour to 4-hour charts for swing trading opportunities.*
// @version=5
indicator("Advanced ORB Indicator", overlay=true)
// ===================================================================
// SIGNAL REQUIREMENTS DOCUMENTATION
// ===================================================================
//
// BULL SIGNAL REQUIREMENTS:
// - ORB period must be completed (not in the opening range duration anymore)
// - Price must close above the ORB high (if waitForClose is enabled)
// - Candle must have a strong body (body to range ratio >= minBodyToRangeRatio)
// - Valid upper wick (upper wick to body ratio <= wickThreshold)
// - Bullish candle (close > open)
// - Consecutive candle confirmation (if enabled, requires multiple candles meeting criteria)
// - Volume filter (if enabled, volume > average volume * threshold)
// - RSI filter (if enabled, RSI must not be overbought)
// - EMA filter (if enabled, price must be above short EMA)
// - Trend filter (if enabled, must be in an uptrend)
// - Cooldown period satisfied (minimum bars between signals)
// - Not already signaled a bull breakout for this ORB (unless reset by retracement)
//
// BEAR SIGNAL REQUIREMENTS:
// - ORB period must be completed (not in the opening range duration anymore)
// - Price must close below the ORB low (if waitForClose is enabled)
// - Candle must have a strong body (body to range ratio >= minBodyToRangeRatio)
// - Valid lower wick (lower wick to body ratio <= wickThreshold)
// - Bearish candle (close < open)
// - Consecutive candle confirmation (if enabled, requires multiple candles meeting criteria)
// - Volume filter (if enabled, volume > average volume * threshold)
// - RSI filter (if enabled, RSI must not be oversold)
// - EMA filter (if enabled, price must be below short EMA)
// - Trend filter (if enabled, must be in a downtrend)
// - Cooldown period satisfied (minimum bars between signals)
// - Not already signaled a bear breakout for this ORB (unless reset by retracement)
//
// SIGNAL RESET CONDITIONS (for both bull and bear):
// - A significant price retracement happens (determined by retracePercent)
// - Cooldown period expires (minimum bars between signals)
// ===================================================================
// ===================================================================
// SETTINGS GUIDE - DETAILED EXPLANATION
// ===================================================================
//
// MARKET SETTINGS
// ---------------------------------------------------------------------
// Market Type: Select your market or use auto-detection
// - US Stocks: NYSE, NASDAQ, etc. (9:30 AM default open)
// - Forex: Currency pairs (uses midnight or London open)
// - Crypto: Digital currencies (uses midnight UTC)
// - EU Stocks: European exchanges (9:00 AM default)
// - Asia Stocks: Asian exchanges (9:00 AM default)
// - Custom: Manually set your preferred session time
//
// Auto-Detect Market Type: Automatically identifies the market from symbol
// - Enable for convenience when switching between different markets
// - Disable to manually set your preferred market type
//
// Use Market Default Timing: Applies optimal session start times for selected market
// - Enable to use proven default timings for the market
// - Disable to set custom session start times
//
// Time Zone: Sets the reference time zone for session calculations
// - Exchange: Uses the exchange's native time zone (recommended)
// - UTC: Uses Coordinated Universal Time
// - Local: Uses your local computer's time zone
//
// TIME SETTINGS
// ---------------------------------------------------------------------
// Session Start Hour/Minute: Sets when the opening range begins
// - Only active when "Use Market Default Timing" is disabled
// - US Stocks typically use 9:30 AM
// - For pre-market analysis, try 4:00 AM (US) or 8:00 AM (EU)
//
// Opening Range Duration: How long to measure the initial range (minutes)
// - 30-60 mins: Standard for daily ORB strategies
// - 15 mins: More responsive, good for volatile markets
// - 120 mins: More stable, fewer false signals
//
// Reset Period: When to calculate a new opening range
// - Daily: Most common, resets each trading day
// - Weekly: Weekly opening range breakout strategy
// - Monthly: Long-term support/resistance levels
// - Never: Continuous tracking without resetting
//
// SIGNAL QUALITY SETTINGS
// ---------------------------------------------------------------------
// Minimum Bars Between Signals: Prevents clustering of multiple signals
// - Higher values (8-10): Fewer signals, better quality
// - Lower values (3-5): More signals, requires more filtering
//
// Required Retracement % Before New Signal: How far price must pull back
// - Higher values (50-60%): Only signals after significant pullbacks
// - Lower values (20-30%): More signals, may include false breakouts
//
// Minimum Breakout % Required: Strength needed for valid breakout
// - Higher values (0.5-1.0%): Stronger confirmation, fewer false breakouts
// - Lower values (0.1-0.3%): More sensitive, good for low-volatility
//
// Minimum Body to Range Ratio %: Requires strong candles for signals
// - Higher values (70-80%): Only strong momentum candles trigger signals
// - Lower values (40-50%): More signals, includes weaker breakouts
//
// BREAKOUT SETTINGS
// ---------------------------------------------------------------------
// Max Wick to Body Ratio: Controls acceptable candle shape
// - Lower values (0.2-0.3): Only clean breakout candles
// - Higher values (0.5-0.6): More signals, includes wicks
//
// Use Close Price: Uses close instead of High/Low for breakouts
// - Enable for more reliable but delayed confirmation
// - Disable for earlier signals using High/Low prices
//
// Wait for Candle Close: Only signals after candle completes
// - Enable to avoid false breakouts (recommended)
// - Disable for earlier entry but higher risk
//
// FILTER SETTINGS
// ---------------------------------------------------------------------
// Filter Signals Based on Trend: Aligns signals with the overall trend
// - Enable to filter out counter-trend signals (recommended)
// - Disable for range-bound markets or counter-trend strategies
//
// Trend Detection Period: Lookback period for trend calculation
// - Longer periods (50-100): Identifies major trends
// - Shorter periods (20-30): More responsive to recent price action
//
// Trend Strength Threshold: How strong trend must be
// - Higher values (0.7-0.8): Only strong trends generate signals
// - Lower values (0.5-0.6): More signals in choppy markets
//
// Use Volume Filter: Requires above-average volume for signals
// - Enable for stocks and futures (recommended)
// - May disable for some forex pairs with unreliable volume data
//
// Volume Threshold: How much above average volume is required
// - Higher values (2.0-3.0x): Only significant volume spikes
// - Lower values (1.2-1.5x): More signals, less volume confirmation
//
// Use RSI Filter: Prevents signals in overbought/oversold conditions
// - Enable to avoid exhausted moves
// - Disable for strong trend following
//
// Use EMA Alignment Filter: Ensures price is in the right direction
// - Enable for trend confirmation (recommended)
// - Disable for early reversal signals
//
// Require Consecutive Candle Confirmation: Needs multiple confirming candles
// - Enable for higher quality signals
// - Disable for faster but riskier entries
//
// DISPLAY SETTINGS
// ---------------------------------------------------------------------
// Show Label with Values: Displays current ORB levels and status
// Show Range Boundaries: Displays high/low lines on chart
// High/Low Boundary Color: Customize appearance
//
// ===================================================================
// RECOMMENDED SETTINGS BY MARKET TYPE
// ===================================================================
//
// US STOCKS - STANDARD
// ---------------------------------------------------------------------
// - Market Type: US Stocks
// - Opening Range Duration: 30 minutes
// - Reset Period: Daily
// - Wait for Candle Close: Enabled
// - Use Volume Filter: Enabled (Volume Threshold: 1.5-2.0x)
// - Use Trend Filter: Enabled
// - Minimum Breakout %: 0.3-0.5%
//
// US STOCKS - EARNINGS/HIGH VOLATILITY
// ---------------------------------------------------------------------
// - Opening Range Duration: 60 minutes (more stable)
// - Minimum Breakout %: 0.7-1.0% (stronger moves required)
// - Minimum Bars Between Signals: 8-10 (avoid whipsaws)
// - Required Retracement %: 40-50% (deeper pullbacks)
// - Volume Threshold: 2.5-3.0x (higher volume confirmation)
//
// CRYPTO
// ---------------------------------------------------------------------
// - Market Type: Crypto
// - Opening Range Duration: 120 minutes (crypto needs longer)
// - Reset Period: Daily
// - Minimum Breakout %: 1.0-1.5% (higher volatility needs stronger breakouts)
// - Volume Threshold: 2.0-2.5x
// - Consider disabling RSI Filter (trending crypto often stays overbought/oversold)
//
// FOREX - MAJOR PAIRS
// ---------------------------------------------------------------------
// - Market Type: Forex
// - Session Start: Consider 8:00 AM (London open) or 5:00 PM (Asian open)
// - Opening Range Duration: 60-120 minutes
// - Min Body to Range Ratio: 50-60% (forex can have smaller bodies)
// - Consider disabling Volume Filter (unreliable on some platforms)
// - Trend Strength Threshold: 0.6-0.7 (forex tends to trend well)
//
// EU STOCKS
// ---------------------------------------------------------------------
// - Market Type: EU Stocks
// - Opening Range Duration: 60 minutes
// - Reset Period: Daily
// - Use EMA Alignment: Enabled
// - Use Volume Filter: Enabled
//
// SMALL CAP/VOLATILE STOCKS
// ---------------------------------------------------------------------
// - Opening Range Duration: 15-30 minutes (captures early moves)
// - Minimum Breakout %: 1.0-2.0% (needs stronger breakouts)
// - Volume Threshold: 3.0x (needs significant volume)
// - Max Wick to Body Ratio: 0.3 (cleaner breakouts)
// - Use Consecutive Candle Confirmation: Enabled (2-3 candles)
//
// LOW VOLATILITY ENVIRONMENT
// ---------------------------------------------------------------------
// - Opening Range Duration: 30-60 minutes
// - Minimum Breakout %: 0.2-0.3% (lower threshold for tight ranges)
// - Required Retracement %: 20-30% (smaller pullbacks)
// - Consider disabling Consecutive Candle Confirmation
//
// HIGH VOLATILITY ENVIRONMENT
// ---------------------------------------------------------------------
// - Opening Range Duration: 60-120 minutes (more stable)
// - Minimum Breakout %: 0.8-1.5% (stronger confirmation)
// - Required Retracement %: 50-60% (deeper pullbacks)
// - Minimum Bars Between Signals: 8-10 (avoid choppy signals)
// - Use Consecutive Candle Confirmation: Enabled (2-3 candles)
// ===================================================================

PARK Oscillator with BOS Percentage ChangePark Oscillator Pro - Smart Money Flow & Institutional Structure Analysis
Professional-Grade Market Structure Indicator
The Park Oscillator Pro is an advanced trading tool that reveals institutional order flow through:
🔹 Precision Market Structure Detection
Accurate Break of Structure (BOS) identification with volume confirmation
Clear Change of Character (CHoCH) markings for trend reversals
Dynamic polarity system for trend bias visualization
🔹 Post-BOS Performance Metrics (Unique Feature!)
Measures maximum price extension after BOS
Quantifies initial pullback strength (first 3 candles)
Auto-labels showing performance statistics
🔹 Smart Money Zones
Normalized oscillator (-100 to +100)
Premium/Discount areas for institutional levels
Adaptive moving average filter
🔹 Professional Divergence System
Regular & hidden divergences (bullish/bearish)
Customizable sensitivity filters
Visual trendlines connecting pivot points
Why Traders Love It:
✅ Institutional-grade market structure analysis
✅ Objective BOS/CHoCH detection (no repainting)
✅ Quantitative performance metrics for trade management
✅ Fully customizable visual alerts
Ideal For:
Institutional order flow traders
Market structure analysts
Price action traders looking for confluence
Those trading breakouts/breakdowns
"Not just signals - it quantifies the institutional footprint in your market."

Find Untapped LevelsYou can find your daily, weekly and monthly levels with this indicator. You still need to go through each time frame and draw them yourself
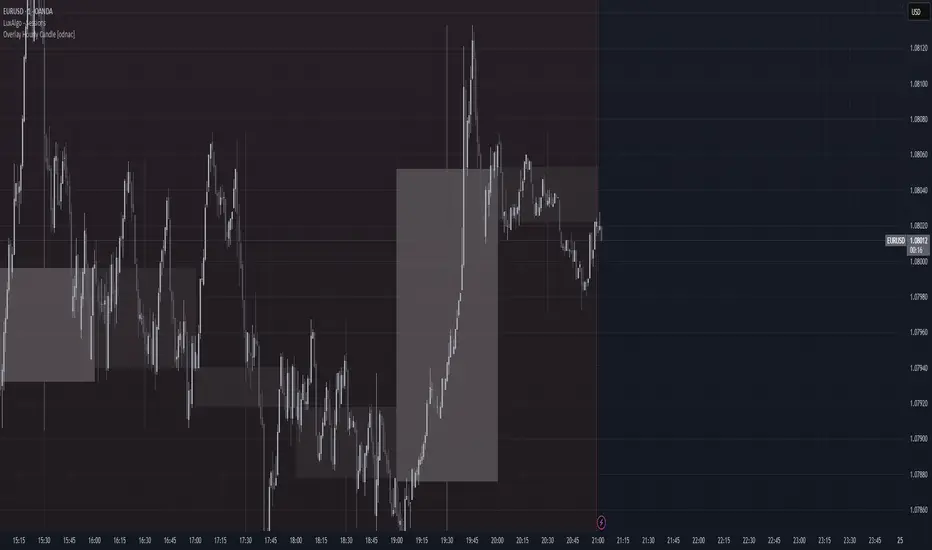
Overlay Hourly Candle [odnac] * This script overlays 1-hour candlestick representations on the chart.
* It captures the open, close, high, and low prices for each hourly period.
* The script dynamically updates as new hourly candles form and adjusts the
* box and wick positions accordingly.
*
* Features:
* - Draws an hourly candle with body and wicks.
* - Colors bullish candles in green and bearish candles in red.
* - Updates dynamically as new hourly candles form.
* - Uses TradingView's box and line functions to represent candle structures.
*
* Usage:
* - Add the script to your TradingView chart as an overlay.
* - Observe how the hourly candles appear distinctly on any timeframe.
alphaJohnny Dynamic RSI IndicatorAlphaJohnny Dynamic RSI Indicator (Dyn RSI)
The Dynamic RSI Indicator (Dyn RSI) is a custom Pine Script tool designed for TradingView that aggregates Relative Strength Index (RSI) signals from multiple timeframes to provide a comprehensive view of market momentum. It combines RSI data from Weekly, Daily, 4-hour, 1-hour, and 30-minute intervals, offering traders a flexible and customizable way to analyze trends across different periods.
Key Features:
Multi-Timeframe RSI Aggregation: Combines RSI signals from user-selected timeframes for a holistic momentum assessment.
Dynamic or Equal Weighting: Choose between correlation-based dynamic weights (adjusting based on each timeframe’s correlation with price changes) or equal weights for simplicity.
Smoothed Momentum Line: A visually intuitive line that reflects the strength of the aggregate signal, smoothed for clarity.
Color-Coded Signal Strength:
Dark Green: Strong buy signal
Light Green: Weak buy signal
Yellow: Neutral
Light Red: Weak sell signal
Dark Red: Strong sell signal
Visual Markers: Large green triangles at the bottom for strong buy signals and red triangles at the top for strong sell signals.
How to Use:
Apply to Chart: Add the indicator to your TradingView chart (it will appear in a separate pane).
Customize Settings: Adjust inputs like RSI period, signal thresholds, included timeframes, weighting method, and smoothing period to fit your trading style.
Interpret Signals:
Momentum Line: Watch for color changes to gauge market conditions.
Triangles: Green at the bottom for strong buy opportunities, red at the top for strong sell opportunities.
Notes:
The indicator is designed for a separate pane (overlay=false), with triangles positioned relative to the pane’s range.
Fine-tune thresholds and weights based on your strategy and the asset being analyzed.
The source code is open for modification to suit your needs.
This indicator is ideal for traders seeking a multi-timeframe perspective on RSI to identify potential trend reversals and momentum shifts.

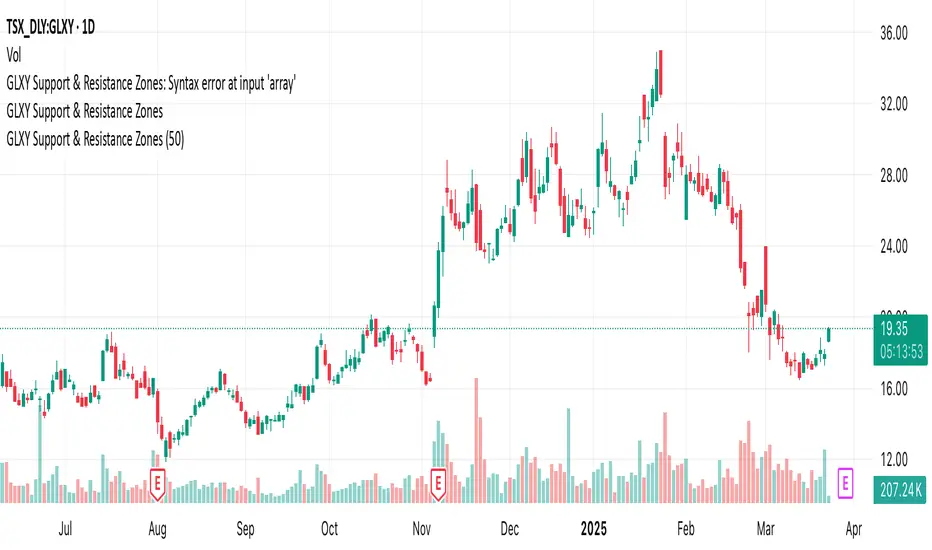
GLXY Support & Resistance ZonesHere’s a structured trading strategy for Galaxy Digital Holdings Ltd. (GLXY) based on a combination of technical analysis, market sentiment, and macro crypto market movement:
⸻
1. Timeframe
• Swing trading timeframe: 1-week to 1-month trades.
• Monitor daily and 4H charts for entries and exits.
⸻
2. Key Factors Driving GLXY
• Strongly correlated to Bitcoin and Ethereum price movement.
• Sensitive to regulatory news in Canada/US and institutional crypto adoption.
• Watch Galaxy’s quarterly earnings and treasury BTC/ETH position updates.
⸻
3. Entry Strategy
A) Technical Setup:
• Buy at major support zones:
• Key support levels: $7.00 CAD, $9.00 CAD (verify current chart levels).
• Enter long positions on bullish reversal candles at these supports.
• Breakout trades:
• Enter long positions on confirmed breakouts above significant resistance (watch volume and 1D close).
• Moving Average Confirmation:
• Only trade long if price is above the 50-day moving average and 50 MA is upward sloping.
B) Macro Confirmation:
• Only take aggressive long positions if BTC price is in an uptrend (above its own 50-day MA).
• Monitor ETH/BTC pair as additional confidence for alt sentiment.
⸻
4. Exit Strategy
• First partial profit target: Previous swing highs or Fibonacci extension levels (commonly 1.272 or 1.618).
• Trailing stop: Move stop-loss to entry when trade is +10%.
• Hard stop-loss: Below the last daily support (2-5% risk).
⸻
5. Diversification
• Do not exceed 5-7% of total portfolio per trade.
• Hedge exposure by monitoring crypto futures or crypto sentiment indexes (eg. Fear & Greed Index).
⸻
6. Optional Short Setup
• Only short if price breaks major support with strong volume, and BTC/ETH are in confirmed downtrends.
• Short target: next daily support zone.
⸻
7. News / Event-based Catalyst
• Enter small positions before major earnings or after big regulatory decisions if crypto sentiment is bullish.
⸻
8. Review
• Reassess the strategy every month based on BTC market structure.
• Track your trade results for GLXY separately to refine position sizing and entry criteria.
⸻
Original Gann Swing Chart Rules [AlgoFuego]🔵 Original Gann Swing Chart Rules
An advanced indicator built on W.D. Gann’s original rules, enhanced with innovative mechanical trend-following methods.
🔹 Description
This indicator functions by balancing short-term adaptability with long-term trend analysis.
The indicator incorporates Gann’s principles alongside mechanical trend-following techniques to offer a structured method for analyzing trends and detecting potential market reversals.
Golden Rule: Non-trend bars are excluded from analysis, and each new bar is compared with the previous trend bar, it highlights significant swing points with greater clarity.
🔸 The core concept behind the golden rule on which this indicator is built.
The person watching the tide coming, wanting to pinpoint the exact spot that signals the high tide, places a stick in the sand at the points where the incoming waves reach until the stick reaches a position where the waves no longer rise, and eventually recedes enough to show that the tide has shifted.
This method is effective for monitoring and identifying tides and floods in the stock market.
🔸Rule 1: The trend bar is everything.
→It is a bar that forms a new high, low, or both.
🔸Rule 2: The professional traders track new highs and lows.
🔸Rule 3: The hidden bar is nothing.
→It is a bar that does not form a new high, low, or both.
🔸Rule 4: The sea has a wavy nature, and the market as well.
🔸Rule 5: The slope is the immediate direction of the swing.
Downward slope
→The downslope is the descending slope of a swing, shows a decline, reflecting a bearish price trend.
Upward slope
→The upslope is the ascending slope of a swing, shows an incline, reflecting a bullish price trend.
🔸Rule 6: The start and end of the movement are the swing points.
→The lowest or highest price of the last bar in the direction of the slope represents the swing point after the slopes direction changes.
Valley
→It is the lowest price of the last bar in a downslope before the market turns to a upslope.
End=> Downward slope and Start=> Upward slope
Peak
→It is the highest price of the last bar in a upslope before the market turns to an downslope.
End=> Upward slope and Start=> Downward slope
🔸Rule 7: The Golden Rule: Ignore all no-trend bars and compare the new bar with the previous trend bar.
→Applying the golden rule in upward slope
→Applying the golden rule in downward slope
🔸 Related content: Personal words of W.D Gann from the book Wall Street Stock Selector.
→"This was only one month's reaction the same as March 1925. The market held in a dull narrow range for about 2 months while accumulation was taking place and in June the main trend turned up again."
→The beginning of the main trend and the formation of the Valley.
→The beginning of the main trend and the formation of the Peak.
🔸 Rule 8: The Closing Price of the Bar to Understand Movement Direction.
Sequence is important
→ Downward bar
→ Upward bar
🔸 Outside Bar Rules
→Explanation of rules and calculations.
🔸 How does a trend start?
Upward trend
Trend change from Downward to Upward.
Prices must take out the nearest 'Peak' and the Trend was previously Downward.
A breakout above the previous peak signals a bullish reversal.
→ Model 1 - Dropping Valley Reversal
The market forms a dropping valley, followed by a breakout above the previous peak.
→ Model 2 - Equal Valley Reversal
The market forms an equal valley, followed by a breakout above the previous peak.
→ Model 3 - Rising Valley Reversal
The market forms a rising valley, followed by a breakout above the previous peak.
Downward trend
Trend change from Upward to Downward.
Prices must take out the nearest ‘Valley' and the Trend was previously Upward.
A breakdown below the previous valley signals a bearish reversal.
→ Model 1 - Rising Peak Reversal
The market forms a rising peak, followed by a breakdown below the previous valley.
→ Model 2 - Equal Peak Reversal
The market forms an equal peak, followed by a breakdown below the previous valley.
→ Model 3 - Dropping Peak Reversal
The market forms a dropping peak, followed by a breakdown below the previous valley.
🔸 The fractal nature of markets
Rising wave
→ The rising wave is the entire bull market between turning points
High point : When the Main trend turns from upward to downward, the peak of the primary trend is formed.
Dropping wave
→ The Dropping wave is the entire bear market between turning points.
Low point : When the Main trend turns from downward to upward, the primary trend valley is formed.
Fractal nature application.
Everything in one picture.
🔹 Features
Strict adherence to the rules: Follows the Original Gann Swing Chart Rules to detect swing points.
Fractal analysis: Uses trend bars and fractal analysis to identify swing points.
Robust functionality: Engineered to handle complex market conditions with advanced logic.
Custom alerts: Alerts for peak/valley completion, main and primary trend reversals & continuations.
Golden rule application: Filters out non-trend bars by comparing only with the last trend bar.
Reversal & trend detection: Applies eight outside bar rules to detect trend reversals and continuations.
Dynamic customization: Fully customizable settings.
🔹 Settings overview
Fine-tune the indicator to match your unique trading strategy by adjusting trend settings, customizing alerts, and modifying visualization options.
1. Main trend settings
Hide/Show Main trend options: Instantly hide all main trend options (alerts remain separate).
Main trendline display & alerts: Toggle trendline visibility and set alerts for peaks and valleys.
Trendline customization: Adjust styles, colors, and slopes for upward/downward trends.
Peaks & Valleys markers: Show/hide points and customize their color and size.
Opposite Main trend turning points: Enable alerts and modify style, width, color, and offset.
Breakout/Breakdown points: Set alerts and customize their appearance.
2. Primary trend settings
Hide/Show primary trend options: Instantly hide all primary trend options (alerts remain separate).
Primary trendline display & alerts: Toggle trendline visibility and set alerts for peaks and valleys.
Trendline customization: Adjust styles, colors, and slopes for upward/downward trends.
Peaks & Valleys markers: Show/hide points and customize their color and size.
Opposite primary trend turning points: Enable alerts and modify style, width, color, and offset.
Breakout/Breakdown points: Set alerts and customize their appearance.
3. Additional options
Tooltips display: Control tooltip visibility for labels and languages.
Candle/Bar coloring: Customize candle and bar colors based on algorithm-selected trends.
🔸 Additional features
🔹Custom reading of bars.
The arrow represents the direction of the slope, the dot is the type of trend, and the line is the closing price.
🔹 Advanced Moving Average Activator
The Advanced Moving Average Activator, this setting calculates the average closing prices of trend bars only, which are the only bars considered by Gann.
The advantage of this method is that it helps avoid hidden bars that are not accounted for, making the difference more evident in a ranging market. The values are updated only when new highs or lows occur.
Additionally, you can set alerts when the price closes above or below the moving average.
🔹 Bar Counter
After a trend change, you can see exactly when the shift occurred and customize the type of trend you want to track.
For example, by conducting your own research on the assets you trade, based on historical data, you might discover valuable insights, such as the primary trend possibly lasting longer than 20 bars!
You can use these insights to refine your trading strategy and make more data-driven decisions.
🔹 How to use
Step 1: Configure the settings and choose your trading approach
Adjust the indicator settings to match your trading style and market conditions.
Effectively using the indicator starts with selecting your preferred trading style.
You can trade in alignment with the primary trend, capitalize on market reversals, or take advantage of breakouts.
Trading with the primary trend: Best for traders who prefer longer-term positions with higher stability.
Trading reversals: Ideal for those looking to enter at potential turning points but requires additional confirmation.
Trading breakouts: Suitable for traders targeting strong price movements after key level breakouts.
Adapting to market volatility: Monitor changing volatility and adjust your strategy accordingly for optimal results.
Step 2: Analyze the chart
Apply the indicator to your TradingView chart and interpret swing signals for informed decisions.
Carefully study the chart patterns to detect subtle signals.
Check if similar signals worked well in past market conditions.
Use multi-timeframe analysis for a broader perspective.
Step 3: Trade with the primary trend
Utilize trend direction to align trades with prevailing market movements.
Always trade in the direction of the primary trend.
Confirm the trend direction using multiple indicators or by relying on the primary trend as confirmation!.
Avoid trading against strong market momentum.
Step 4: Identify entry signals
Use indicator signals to identify ideal trade entry points.
Look for confirmation before entering a trade.
Wait for clear signals to avoid false entries.
Practice on a demo account to build confidence in your entry strategy.
Step 5: Apply risk management
Define stop-loss and take-profit levels to protect your capital effectively.
Set stop-loss orders at strategic levels to limit potential losses.
Risk only a small percentage of your capital per trade.
Adjust risk levels based on your overall portfolio performance.
Step 6: Confirm with trend analysis
Validate trends using additional indicators for a higher probability of success.
Use complementary tools to confirm trend direction.
Monitor trend changes to adjust your strategy promptly.
Keep an eye on volume indicators for added confirmation.
Step 7: Execute the trade
Enter trades based on confirmed signals and predefined strategy rules.
Ensure all your criteria are met before executing a trade.
Stay disciplined and stick to your strategy.
Review market conditions right before execution.
Step 8: Monitor the trade
Track trade performance and make adjustments as necessary.
Keep an eye on market conditions throughout the trade.
Be ready to adjust your strategy if unexpected events occur.
Use trailing stops to secure profits while allowing for gains.
Step 9: Implement exit strategy
Close trades strategically based on your pre-established exit plan.
Plan your exit strategy in advance and adhere to it.
Consider partial exits to secure profits along the way.
Avoid emotional decisions when closing trades.
Step 10: Review performance
Analyze past trades to continuously refine and improve your strategy.
Regularly review and document your trades for insights.
Identify patterns in both your successes and mistakes.
Update your strategy based on comprehensive performance reviews.
🔹 Disclosure
While this script is useful and provides insight into market tops, bottoms, and trend trading, it's critical to understand that past performance is not necessarily indicative of future results and there are many more factors that go into being a profitable trader.

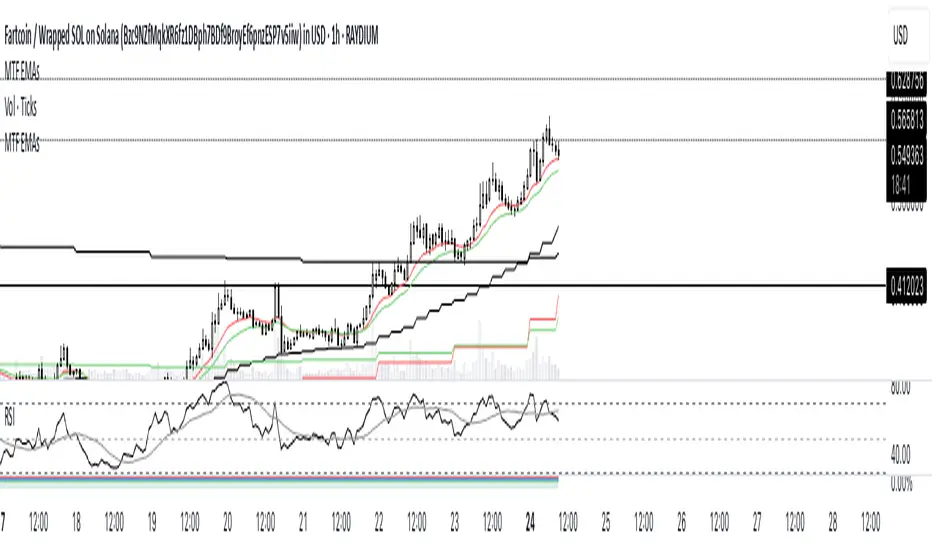
Multi-Timeframe EMAsThis TradingView indicator provides a comprehensive overview of price momentum by overlaying multiple Exponential Moving Averages (EMAs) from different timeframes onto a single chart. By combining 1-hour, 4-hour, and daily EMAs, you can observe short-term trends while simultaneously monitoring medium-term and long-term market dynamics. The 1-hour EMA 13 and EMA 21 help capture rapid price changes, which is useful for scalpers or intraday traders looking to identify sudden momentum shifts. Meanwhile, the 4-hour EMA 21 offers a more stable, intermediate perspective, filtering out some of the noise found in shorter intervals. Finally, the daily EMAs (13, 25, and 50) highlight prevailing market sentiment over a longer period, enabling traders to assess higher-level trends and gauge whether short-term signals align with overarching tendencies. By plotting all these EMAs together, it becomes easier to detect confluences or divergences across different time horizons, making it simpler to refine entries and exits based on multi-timeframe confirmation. This script is especially helpful for swing traders and position traders who wish to ensure that smaller timeframe strategies do not conflict with long-term market direction.
UntouchedIBOB [DTMM]UntouchedIBOB - Indicator for TradingView
What does this indicator do?
The UntouchedIBOB indicator helps you identify special candlestick patterns on your chart: Inside Bars (IB) and Outside Bars (OB). These patterns can provide important signals for your trading decisions.
The two most important patterns:
Outside Bar (OB) - A candle whose high is higher and low is lower than the previous candle. It completely "engulfs" the previous candle.
Inside Bar (IB) - A candle whose high is lower and low is higher than the previous candle. It moves completely "inside" the previous candle.
Tested and recommended by professionals:
We are the main provider of trading indicators for Oliver Klemm , one of the most renowned traders in Germany and the entire DACH region. Our indicators are used daily in real-money trading by successful professional traders and are continuously improved. You benefit from the same professional technology that is used and recommended by leading market experts.
Main features:
Colored candles: Inside and Outside Bars are displayed in different colors
Lines: Shows horizontal lines at the midpoints of IB/OB that remain active until the price breaks through them
Arrows: Optional arrows above/below the IB/OB for better visibility
Alerts: Can notify you when new Inside or Outside Bars form
Special feature:
The indicator not only shows where IB/OBs are located but also tracks which ones are still "untouched" - meaning the price has not broken through that level again. This can be particularly valuable as untouched IB/OB levels often represent important support and resistance areas.
Customization options:
Enable/disable lines, arrows, and areas
Adjust colors for all elements
Arrow size (tiny, small, normal, large)
Choose between solid or dashed lines
Alert functions for new Inside and Outs
ide Bars
Use this indicator to more easily identify important candlestick patterns and identify potential trend reversals or continuations early.
-----------------------------------------------------------------
UntouchedIBOB - Indikator für TradingView
Was macht dieser Indikator?
Der UntouchedIBOB-Indikator hilft Ihnen, spezielle Kerzenmuster im Chart zu erkennen: Inside Bars (IB) und Outside Bars (OB). Diese Muster können wichtige Signale für Ihre Trading-Entscheidungen sein.
Die zwei wichtigsten Muster:
Outside Bar (OB) - Eine Kerze, deren Hoch höher und deren Tief tiefer ist als die vorherige Kerze. Sie "umschließt" also die vorherige Kerze vollständig.
Inside Bar (IB) - Eine Kerze, deren Hoch niedriger und deren Tief höher ist als die vorherige Kerze. Sie bewegt sich also komplett "innerhalb" der vorherigen Kerze.
Von Profis getestet und empfohlen:
Wir sind der Hauptlieferant von Trading-Indikatoren für Oliver Klemm , einen der bekanntesten Trader Deutschlands und der gesamten DACH-Region. Unsere Indikatoren werden von erfolgreichen Profi-Tradern täglich im Echtgeld-Handel eingesetzt und kontinuierlich verbessert. Sie profitieren von der gleichen professionellen Technologie, die von führenden Marktexperten genutzt und empfohlen wird.
Hauptfunktionen:
Farbige Kerzen: Inside und Outside Bars werden in verschiedenen Farben dargestellt
Linien: Zeigt horizontale Linien an den Mittelpunkten der IB/OB, die aktiv bleiben bis der Preis sie durchbricht
Pfeile: Optionale Pfeile über/unter den IB/OB für bessere Sichtbarkeit
Alarme: Kann Sie benachrichtigen, wenn neue Inside oder Outside Bars entstehen
Besonderheit:
Der Indikator zeigt nicht nur an, wo sich IB/OBs befinden, sondern verfolgt auch, welche noch "unberührt" sind - das heißt, der Preis hat das Level noch nicht wieder durchbrochen. Dies kann besonders wertvoll sein, da unberührte IB/OB-Levels oft wichtige Unterstützungs- und Widerstandsbereiche darstellen.
Einstellungsmöglichkeiten:
Ein-/Ausschalten von Linien, Pfeilen und Bereichen
Anpassung der Farben für alle Elemente
Wahl zwischen durchgezogenen oder gestrichelten Linien
Alarmfunktionen für neue Inside und Outside Bars
Nutzen Sie diesen Indikator, um wichtige Kerzenmuster leichter zu erkennen und potenzielle Trendwechsel oder Fortsetzungen frühzeitig zu identifizieren.

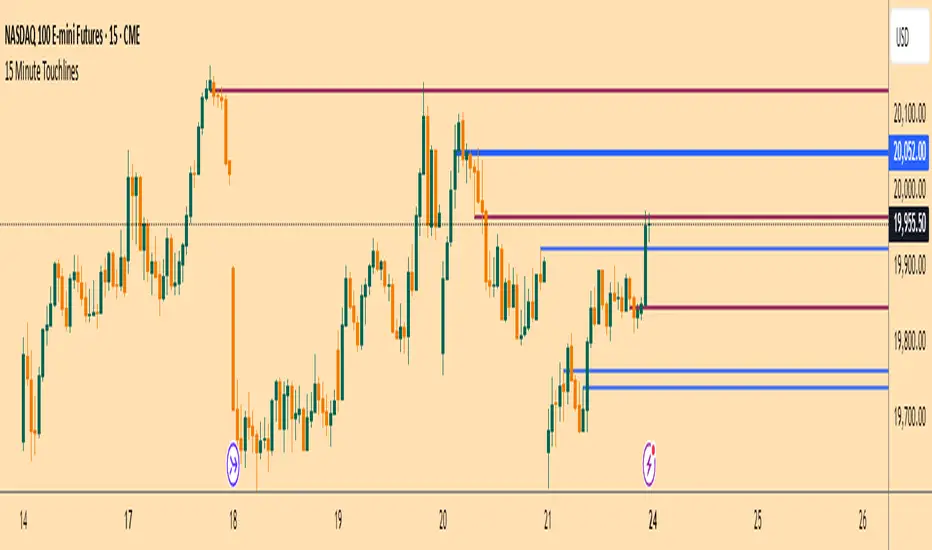
15 Minute TouchlinesThe 15 Minute Touchlines indicator is designed to identify potential breakout levels on a 15-minute timeframe, providing visual and alert-based signals for traders. This indicator overlays on the price chart and helps traders spot key levels where price may react, offering both buy and sell signals.
Key Features:
Breakout Levels:
The indicator calculates breakout levels based on recent price action, identifying potential support and resistance zones.
Up Deviation and Down Deviation parameters allow for customization of these levels.
Trend Filter:
An optional trend filter using a Simple Moving Average (SMA) can be enabled to filter out signals that do not align with the overall trend.
The trend filter helps in reducing false signals by ensuring that breakouts occur in the direction of the prevailing trend.
Visual Signals:
Lines: The indicator plots horizontal lines at identified breakout levels, which can be extended to the right.
Arrows: Optional arrows can be displayed to indicate buy or sell signals, enhancing visual clarity.
Colors: Customizable colors for buy and sell lines and arrows.
Touch Counts:
The indicator tracks the number of times price touches the plotted lines.
Users can set the number of touches required to remove a line or trigger an alert, providing flexibility in managing active levels.
Alerts:
Alerts can be configured to notify traders when price touches a line a specified number of times, aiding in timely decision-making.
Low Pass Bands:
The indicator incorporates low pass bands to smooth out price fluctuations, helping to identify more reliable breakout levels.
Customizable parameters for the low pass bands allow traders to fine-tune the indicator's sensitivity.
Input Parameters:
History Lines to Show: Number of historical lines to display.
Show Lines: Toggle to display or hide the breakout lines.
Touches to Remove Line: Number of touches required to remove a line.
Touch Number for Alert: Number of touches required to trigger an alert.
Buy/Sell Line Color: Custom colors for buy and sell lines.
Up/Down Deviation: Deviation factors for calculating breakout levels.
Extend Lines to Right: Option to extend lines to the right edge of the chart.
Line Thickness: Thickness of the plotted lines.
Use Trend SMA Filter: Toggle to enable or disable the trend filter.
Trend SMA Period: Period for the trend SMA filter.
Usage:
Identify Breakouts: Use the plotted lines and arrows to identify potential breakout levels and direction.
Trend Confirmation: Enable the trend filter to ensure that breakouts align with the overall trend.
Alert Management: Set up alerts to be notified of price interactions with key levels, aiding in active trading strategies.
The 15 Minute Touchlines indicator is a versatile tool for traders looking to capitalize on short-term price movements, offering a blend of visual signals and customizable alerts to enhance trading decisions.
ORB with Alerts - Current Day OnlyORB with Alerts - Current Day Only
This script plots the Opening Range Breakout (ORB) levels and provides alerts when price breaks above or below the range. It is designed for intraday trading and resets daily.
How It Works:
The ORB time in settings should be set to 15 minutes.
The Session Time should be set to 09:30 - 09:45.
The script marks the high and low of the ORB period and tracks price action for breakouts.
Alerts trigger when price crosses above the ORB high or below the ORB low.
This tool helps traders identify breakout opportunities based on early price action, aiding in momentum-based strategies
Standard Deviation (fadi)The Standard Deviation indicator uses standard deviation to map out price movements. Standard deviation measures how much prices stray from their average—small values mean steady trends, large ones mean wild swings. Drawing from up to 20 years of data, it plots key levels using customizable Fibonacci lines tied to that standard deviation, giving traders a snapshot of typical price behavior.
These levels align with a bell curve: about 68% of price moves stay within 1 standard deviation, 95% within roughly 2, and 99.7% within roughly 3. When prices break past the 1 StDev line, they’re outliers—only 32% of moves go that far. Prices often snap back to these lines or the average, though the reversal might not happen the same day.
How Traders Use It
If prices surge past the 1 StDev line, traders might wait for momentum to fade, then trade the pullback to that line or the average, setting a target and stop.
If prices dip below, they might buy, anticipating a bounce—sometimes a day or two later. It’s a tool to spot overstretched prices likely to revert and/or measure the odds of continuation.
Settings
Higher Timeframe: Sets the Higher Timeframe to calculate the Standard Deviation for
Show Levels for the Last X Days: Displays levels for the specified number of days.
Based on X Period: Number of days to calculate standard deviation (e.g., 20 years ≈ 5,040 days). Larger periods smooth out daily level changes.
Mirror Levels on the Other Side: Plots symmetric positive and negative levels around the average.
Fibonacci Levels Settings: Defines which levels and line styles to show. With mirroring, negative values aren’t needed.
Background Transparency: Turn on Background color derived from the level colors with the specified transparency
Overrides: Lets advanced users input custom standard deviations for specific tickers (e.g., NQ1! at 0.01296).

ICT Concepts [SB]ICT Market Structure Shift (MSS) Alert Indicator
This indicator identifies Market Structure Shifts (MSS) based on ICT concepts, helping traders spot key reversal or continuation points in price action.
Features:
✅ Detects bullish and bearish MSS using swing highs and swing lows.
✅ Customizable lookback period to fine-tune structure identification.
✅ Alerts for confirmed MSS when price breaks structure with momentum.
✅ Option to filter MSS by higher timeframe bias for confluence.
✅ Highlights liquidity sweeps before a shift to confirm smart money activity.
✅ Works on all timeframes and asset classes, including Forex, Stocks, Crypto, and Futures.
How It Works:
Bullish MSS: Occurs when price breaks above a recent swing high after taking out a previous swing low (liquidity grab).
Bearish MSS: Occurs when price breaks below a recent swing low after taking out a previous swing high.
Can be used standalone or combined with FVGs, Order Blocks, and Premium/Discount zones for high-probability setups.
Best Usage:
Scalping: 1m–5m timeframe for intraday reversals.
Intraday Trading: 15m–1H for session-based structure shifts.
Swing Trading: 4H–Daily for macro trend reversals.
Look for retest of MSS for entries after they fail as appears in chart highlighted by green horizontal lines or FVG to support after shifts.
Perfect for traders who use ICT, Smart Money Concepts (SMC), and Market Structure-based strategies.
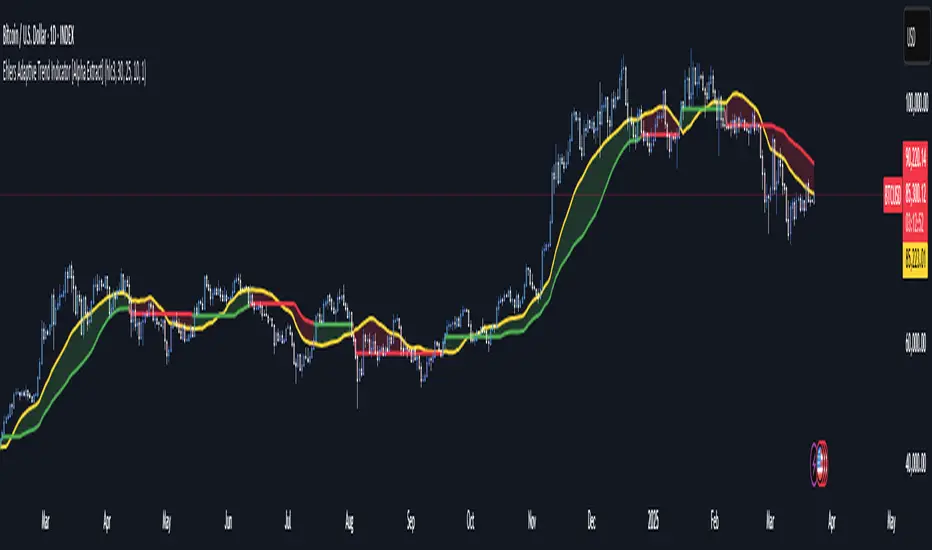
Ehlers Adaptive Trend Indicator [Alpha Extract]Ehlers Adaptive Trend Indicator
The Ehlers Adaptive Trend Indicator combines Ehlers' advanced digital signal processing techniques with dynamic volatility bands to identify robust trend conditions and potential reversals. This powerful tool helps traders visualize trend strength, adaptive support/resistance levels, and momentum shifts across various market conditions.
🔶 CALCULATION
The indicator employs a sophisticated adaptive algorithm that responds to changing market conditions:
• Ehlers Filter : Calculates a weighted average based on momentum differences to create an adaptive trend baseline.
• Dynamic Bands : Volatility-adjusted bands that expand and contract based on recent price action.
• Trend Level : A dynamic support/resistance level that adapts to the current trend direction.
• Smoothed Volatility : Market volatility measured and smoothed to provide reliable band width.
Formula:
• Ehlers Basis = Weighted average of price, with weights determined by momentum differences
• Volatility = Standard deviation of price over Ehlers Length period
• Smoothed Volatility = EMA of volatility over Smoothing Length
• Upper Band = Ehlers Basis + Smoothed Volatility × Sensitivity
• Lower Band = Ehlers Basis - Smoothed Volatility × Sensitivity
• Trend Level = Adaptive support in uptrends, resistance in downtrends
🔶 DETAILS
Visual Features :
• Ehlers Basis Line (Yellow): The core adaptive trend reference that serves as the primary trend indicator.
• Trend Level Line (Dynamic Color): Changes between green (bullish) and red (bearish) based on the current trend state.
• Fill Areas : Transparent green fill during bullish trends and transparent red fill during bearish trends for clear visual identification.
• Bar Coloring : Optional price bar coloring that reflects the current trend direction for enhanced visualization.
Interpretation :
• **Bullish Signal**: Price crosses above the upper band, triggering a trend change with the Trend Level becoming dynamic support.
• **Bearish Signal**: Price drops below the lower band, confirming a trend change with the Trend Level becoming dynamic resistance.
• **Trend Continuation**: Trend Level rises in bullish markets and falls in bearish markets, providing adaptive trailing support/resistance.
🔶 EXAMPLES
The chart demonstrates:
• Bullish Trend Identification : When price breaks above the upper band, the indicator shifts to bullish mode with green trend level and fill.
• Bearish Trend Identification : When price falls below the lower band, the indicator shifts to bearish mode with red trend level and fill.
• Trend Persistence : Trend Level adapts to market movement, rising during uptrends to provide dynamic support and falling during downtrends to act as resistance.
Example Snapshots :
• During a strong uptrend, the Trend Level continuously adjusts upward, keeping traders in the trend while filtering out minor retracements.
• During trend reversals, clear color changes and Trend Level shifts provide early warning of potential direction changes.
🔶 SETTINGS
Customization Options :
• Ehlers Length (p1) (Default: 30): Controls the primary adaptive calculation period, balancing responsiveness with stability.
• Momentum Length (p2) (Default: 25): Determines the lag for momentum calculations used in the adaptive weighting.
• Smoothing Length (Default: 10): Adjusts the volatility smoothing period—higher values provide more stable bands.
• Sensitivity (Default: 1.0): Multiplier for band width—higher values increase distance between bands, lower values tighten them.
• Visual Settings : Customizable colors for bullish and bearish trends, basis line, and optional bar coloring.
The Ehlers Adaptive Trend Indicator combines John Ehlers' digital signal processing expertise with modern volatility analysis to create a robust trend-following system that adapts to changing market conditions, helping traders stay on the right side of the market.
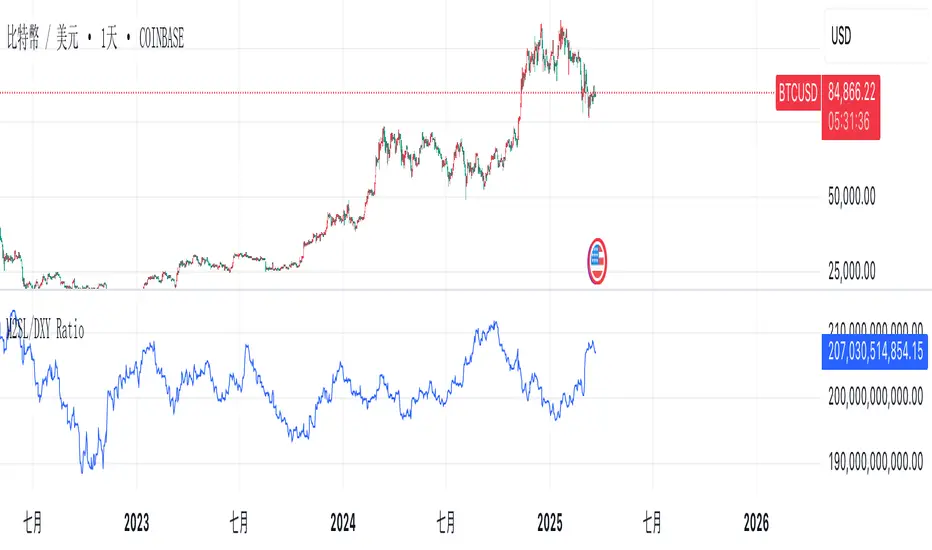
M2SL/DXY RatioThis is the ratio of M2 money supply (M2SL) to the U.S. dollar index (DXY), taking into account the impact of U.S. dollar strength and weakness on liquidity.
M2SL/DXY better represents the current impact of the United States on cryptocurrency prices.