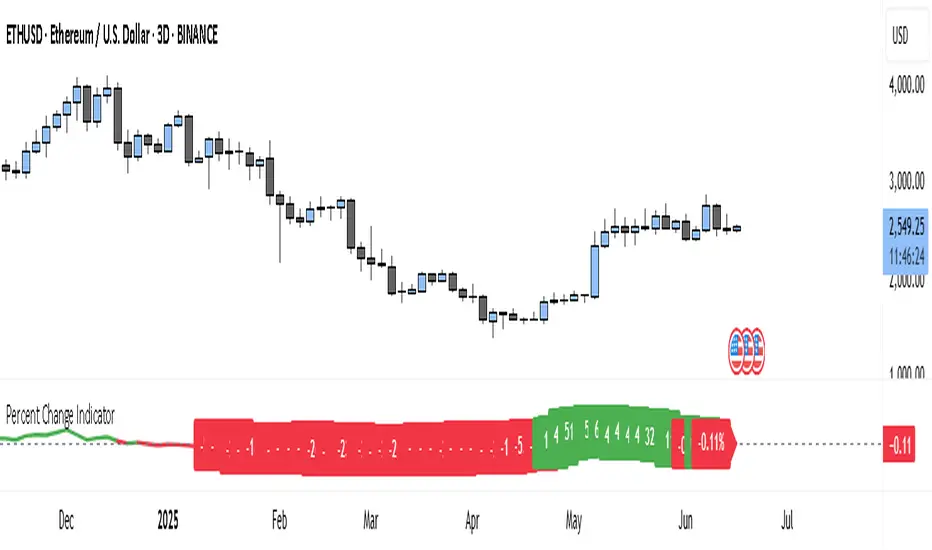
Percent Change IndicatorThe Percent Change Indicator helps you see how much the price of an asset has changed over a specific number of bars (or candles) on the chart. You get to decide how many bars to look back — for example, the last 10 candles. The indicator takes the current closing price and compares it to the closing price from 10 bars ago, then calculates the percentage difference between the two.
If the price has increased, the indicator shows a positive value and displays it in green. If the price has dropped, the value is negative and shown in red. A horizontal zero line helps you quickly see whether the market is gaining or losing value over the selected period.
On your chart, this indicator appears as a line that moves up or down with the price trend. It updates in real time and works on all timeframes — so whether you're trading on the 1-minute chart or analyzing the daily chart, it always tells you how much the price has changed over the number of bars you chose.
This tool is especially useful for spotting trends, measuring price momentum, or identifying when the market is starting to reverse direction.
Chart patterns
Sessions By petranThis indicator highlights the key trading sessions on the chart: Asian, Frankfurt, London, and New York. It helps traders visually track when each session begins and ends, making it easier to analyze price action, volume, and volatility during specific times of the day.
Key features:
Customizable session start and end times
Up to 4 major sessions highlighted
Best used on intraday timeframes (1-minute to 1-hour)
Clean, minimal design with adjustable colors and transparency
No repainting – reliable for both live trading and backtesting
Ideal for intraday traders and anyone who wants to better understand market dynamics during different trading sessions.

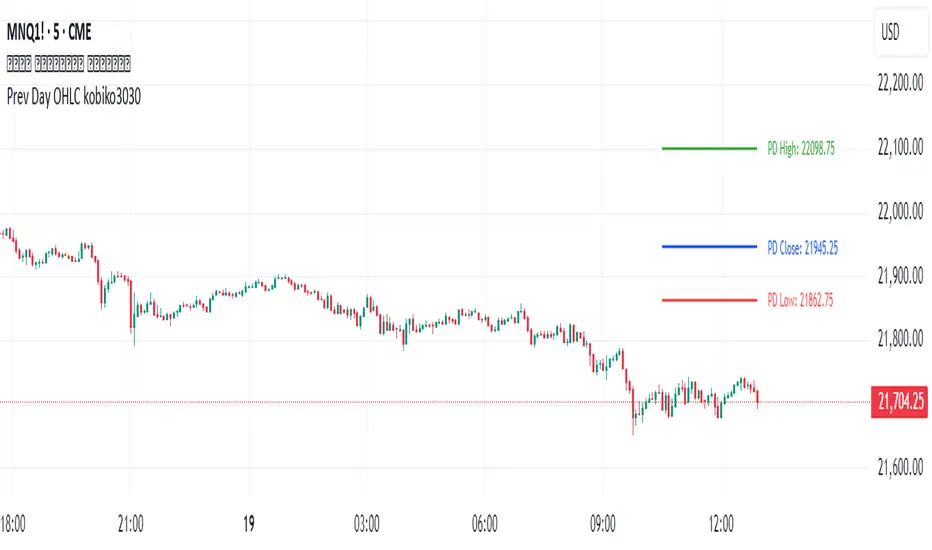
Previous Daily OHLCPrevious Daily OHLC Indicator
Overview:
This professional TradingView indicator displays the previous day's key price levels (Open, High, Low, Close, and 50% midpoint) as horizontal lines on your chart. These levels are essential for traders who use previous day data as support and resistance zones in their technical analysis.
What It Does
Displays Previous Day Levels: Automatically shows horizontal lines for yesterday's OHLC data
Real-Time Updates: Lines update dynamically each new trading day
Fully Customizable: Complete control over which levels to display and how they appear
Smart Line Management: Choose between showing lines for recent bars or across the entire chart
Professional Labels: Clear labels with optional price values for each level
Color Coded System: Distinct colors for each level type for instant recognition
Key Features
Five Important Price Levels
Previous Day Open: Yesterday's opening price - often acts as psychological level
Previous Day High: Yesterday's highest price - key resistance level for breakout trading
Previous Day Low: Yesterday's lowest price - important support level for breakdowns
Previous Day Close: Yesterday's closing price - significant reference point
50% Midpoint: Calculated midpoint between previous day's high and low - bias indicator
Metatron Lines (Highs & Lows Geometry)Metatron Lines
Hey TradingView community! 👋
I wanted to share something I've been working on that might help you see market structure from a different angle. This indicator connects pivot highs and lows using geometric patterns, creating what I call "Metatron Lines."
What it does (simply put):
- Finds significant highs and lows on your chart
- Draws lines connecting these points to reveal hidden geometric relationships
- Shows you the underlying structure that price tends to respect
Why I built this:
I noticed that markets often move in patterns that aren't immediately obvious. Sometimes the most important levels aren't the obvious support and resistance lines, but the intersections and angles created by connecting multiple pivot points. This tool helps visualize those relationships.
How it might help you:
- Pattern Recognition : Spot geometric formations that traditional analysis might miss
- Support/Resistance : See where multiple geometric lines converge to create strong levels
- Market Structure : Better understand how price flows and where it might find obstacles
- Confluence Areas : Identify zones where multiple geometric elements align
A few honest thoughts:
This isn't a magic bullet or a guaranteed profit maker (nothing is!). It's simply another lens through which to view price action. Some traders find geometric analysis helpful, others prefer different approaches - and that's perfectly fine.
I've tried to make it customizable so you can adjust it to fit your trading style and timeframe. The default settings work well for most instruments, but feel free to experiment.
Settings you can adjust:
- Pivot detection sensitivity
- Number of connection points
- Line colors and styles
- Which connections to show (highs, lows, or both)
I hope some of you find this useful! I'm always learning from this community, so if you have suggestions for improvements or different ways to use it, I'd love to hear them.
Trade safe and trust your process! 📈
---
This indicator is provided as-is for educational and analysis purposes. Please practice proper risk management and never risk more than you can afford to lose.

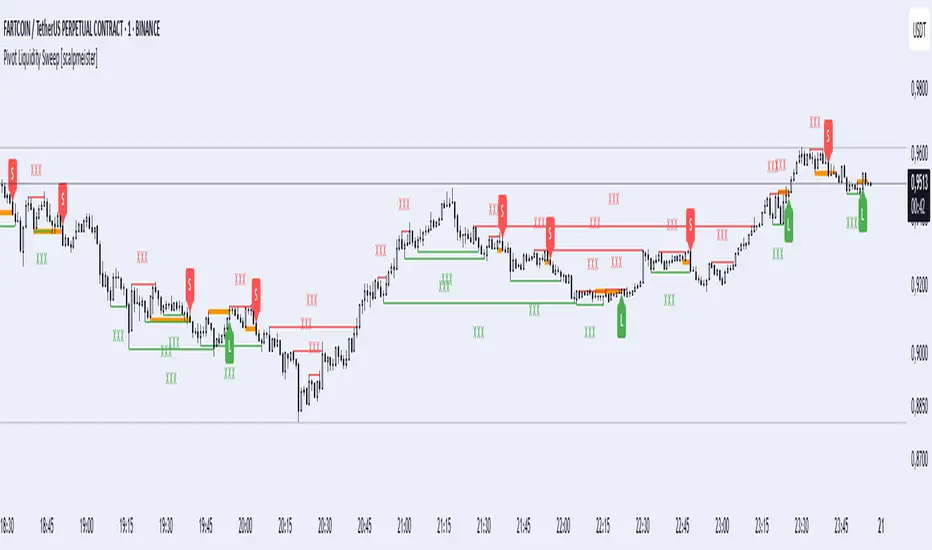
Pivot Liquidity Sweep [scalpmeister]📌 Pivot Liquidity Sweep
Scalp-oriented, liquidity sweep-based advanced signal and strategy indicator.
This indicator analyzes the price's sweeping of significant pivot levels and the subsequent breakouts to generate long/short signals based on different logics. It is sensitive to both classic sweep logic and strong reversal candles. Additionally, it visually marks liquidity gathering zones, offering excellent opportunities especially for scalp and intraday traders.
⚙️ Features and Strategy Types
🟢 Automatic Pivot Detection:
Pivot high/low levels are detected and stored based on the number of left and right bars.
🔴 Sweep Detection (Stop Hunt):
If the price violates a pivot level with a wick and closes inside, it is considered a sweep (liquidity cleaning). Strategies activate after this sweep.
🧠 5 Different Signal Styles:
SweepBreak:
It is expected that the extreme (high/low) level of the sweeping candle is broken with a close.
PivotBreak:
After the sweep, the first newly formed pivot in the trend direction is expected to break. (It is dynamically determined and drawn on the chart.)
StrongSweep:
It is sufficient if the candle following the sweep surpasses the previous candle with a single candle. No additional breakout is expected.
StrongCandle:
Strong momentum candles measured with a special RSI calculation are taken into account. It considers strong opposite-direction candles formed shortly after a pivot sweep.
ReversalCandleSweep:
Reversal candles that close in the opposite direction after a sweep (e.g., a red close on a sweep candle formed at the top or a green close at the bottom) are directly considered as signals.
📐 Technical Details:
Signals are triggered only once (triggered control).
Sweep lines (green/red), Long and Short lines (Orange)
Strong candles are filtered using an RSI-momentum-based measurement system (StrongCandle).
Sweep and breakout zones are dynamically invalidated. That is, if the zones are violated by the price, the signals and lines are automatically canceled.
🎯 Who Should Use It?
Professional traders working with liquidity zones
Scalp and intraday strategy practitioners
Those focused on stop hunts, sweeps, and reversal zones
🔔 Alert Support:
Sweep High / Low Alert
Long / Short Signal Alert
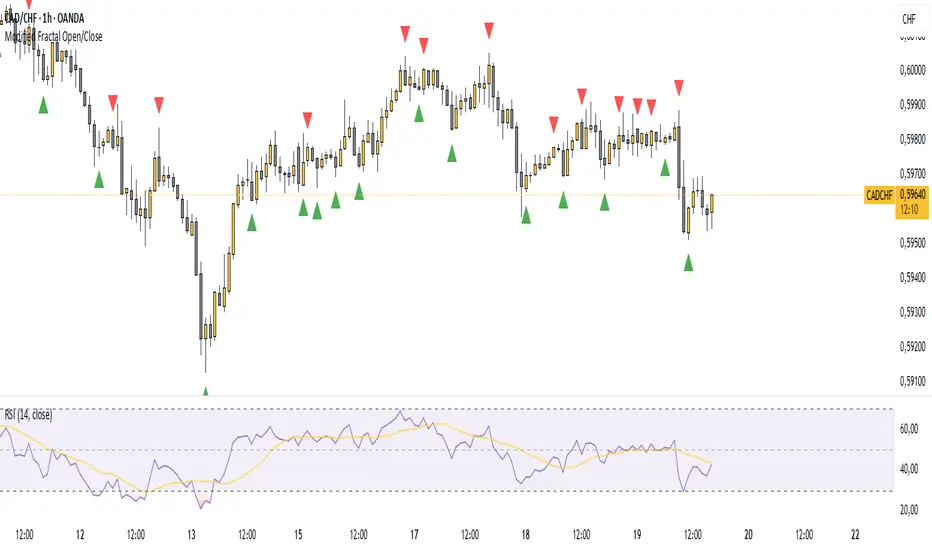
Modified Fractal Open/CloseModified Fractal (Open/Close Based) - Indicator
The Modified Fractal (Open/Close Based) indicator offers a new way to detect fractal patterns on your chart by analyzing the open and close prices instead of the traditional high and low values.
🧮 How it works:
The indicator evaluates a group of 5 consecutive candles.
The central candle (2 bars ago) is analyzed.
For a Bullish Fractal:
The open or close of the central candle must be lower than the open and close of the other 4 surrounding candles.
For a Bearish Fractal:
The open or close of the central candle must be higher than the open and close of the other 4 surrounding candles.
Once a valid pattern is detected, a visual symbol (triangle) is plotted directly on the chart and an alert can be triggered.
✅ Key Features:
Non-repainting signals (evaluated after candle close)
Fully mechanical detection logic
Easy-to-use visual signals
Alert conditions ready to be integrated into TradingView’s alert system
Suitable for multiple timeframes (can be used from M1 to Daily and beyond)
🎯 Use case:
This modified fractal approach can help traders:
Spot potential swing points
Identify possible reversals
Confirm price exhaustion zones
Support breakout or mean reversion strategies
⚠ Note:
This indicator does not provide trade signals by itself. It is recommended to be combined with additional tools, price action analysis, or risk management rules.
Mark specific candle (e.g. bar 20)This Pine Script indicator, "Mark specific candle (e.g. bar 20)" (short title "Mark candle"), is a simple yet powerful tool to visually highlight a particular candle on your chart.
What it does:
It marks a specific candle (e.g., the 20th, 10th, or any number you choose) counting backwards from the most recent candle on your chart. The marked candle will be colored in a subtle light grey and also feature a tiny, matching grey arrow pointing down from above it.
Why it's useful:
This indicator helps you quickly identify and track a consistent reference point in recent price action. It's great for strategies that depend on fixed look-back periods or for simply keeping an eye on a specific historical candle's position as new data comes in.
Key Features:
Adjustable Candle Number: Easily change which candle is marked (e.g., 20th, 10th, 5th) directly from the indicator settings using the "Candle Number to Mark (from end)" input.
Clear Visuals: Both the candle color and a small arrow provide a subtle, yet effective, visual cue.
How to use:
Simply add this script to your TradingView chart. Then, open the indicator's settings to set your desired candle number.

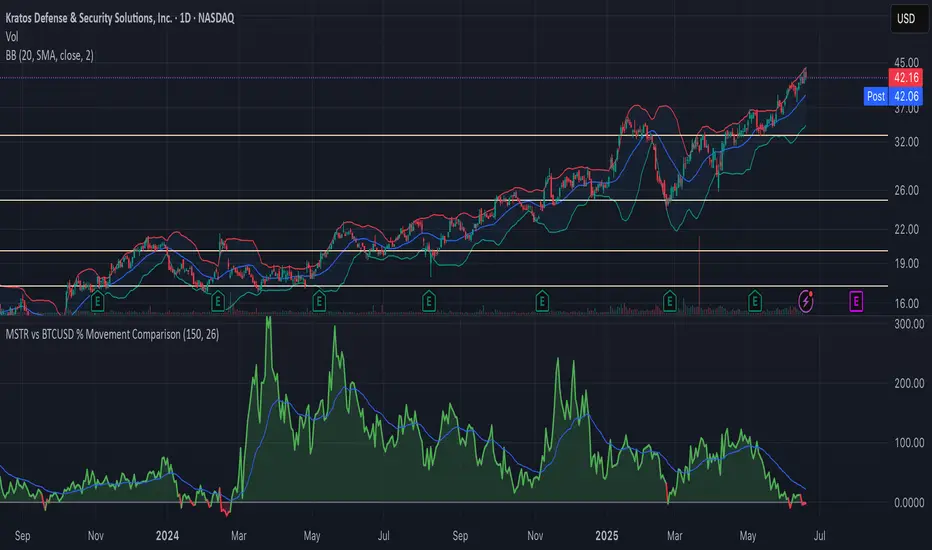
MSTR vs BTCUSD % Movement ComparisonThe indicator, in its current form, is a custom Pine Script (version 6) tool named "MSTR vs BTCUSD % Movement Comparison" that visually compares the percentage price movements of MicroStrategy (MSTR) and Bitcoin (BTCUSD) over a user-defined lookback period. It plots the difference in their percentage changes (diff_pct = mstr_pct - btcusd_pct) as a line, with a zero line for reference, and uses green/red coloring to indicate whether MSTR is outperforming (green, above zero) or underperforming (red, below zero) BTCUSD. The area between the difference line and zero line is filled with semi-transparent green or red for clarity. Additionally, an adjustable-period Exponential Moving Average (EMA) of the percentage difference smooths the trend, helping identify momentum shifts. The indicator is fixed to compare MSTR and BTCUSD, ensuring consistent output regardless of the chart’s active symbol (e.g., MSTR, MTPLF, or others).
Key Features:
Percentage Difference: Shows MSTR’s percentage change minus BTCUSD’s, highlighting relative performance.
Zero Line: A gray solid line at 0 for reference.
Color Coding: Green line/fill when MSTR outperforms, red when it underperforms.
Adjustable EMA: User-defined EMA period (default: 26) smooths the percentage difference.
Fixed Comparison: Always compares MSTR vs. BTCUSD, unaffected by the chart’s symbol.
User Inputs: Lookback period (default: 50 bars) and EMA period (default: 26) are customizable.
Example: On a 1-hour chart, if MSTR rises 4% and BTCUSD rises 1% over 50 bars, the difference line plots at +3 (green) with green fill, and the 26-period EMA might be at +2.2, indicating MSTR’s outperformance trend.
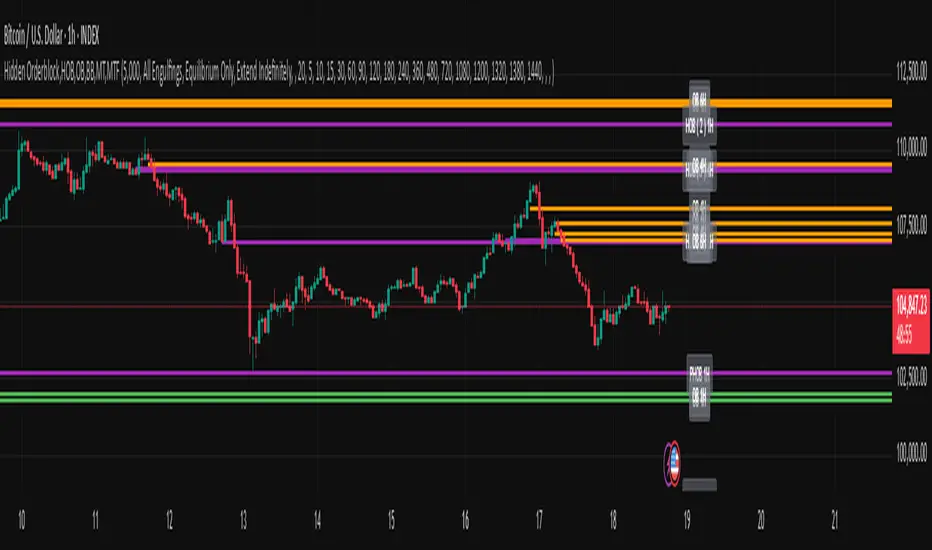
Hidden Orderblock,HOB,OB,BB,MT,MTF Hidden Order Block & Breaker Block (HOB/BB) Multi-Timeframe Analysis
A powerful tool for Smart Money traders and ICT-style practitioners seeking precision, confluence, and clean visual execution. This indicator identifies institutional price zones such as Hidden Order Blocks (HOB), Breaker Blocks (BB), Partial Hidden Order Blocks (PHOB), and traditional Order Blocks (OB)—all across multiple timeframes with minimal chart clutter.
✅ Key Features
1. Hidden Order Block (HOB) Detection
Identifies non-obvious order blocks often hidden within price action.
Requires the EQ (Equilibrium) of the block to pass through at least one Fair Value Gap (FVG).
Invalidation Rule: If price touches the EQ and then closes beyond it (depending on structure), the HOB is invalidated.
2. Breaker Block (BB) Detection
Highlights zones where price made a liquidity grab followed by a strong reversal.
Useful for anticipating support/resistance flips and high-probability reaction areas.
3. Partial Hidden Order Block (PHOB) Detection
A variation of HOBs where price only partially touches the EQ.
Often acts as an early warning zone for reversals or continuation.
Less strict than HOBs, but still institutionally relevant.
4. Traditional Order Block (OB) Detection
Identifies bullish/bearish OBs based on engulfing patterns and displacement.
Marks only the body of the engulfing candle, with the EQ line acting as a key validation/invalidation level.
Once the EQ is touched, the OB is considered invalidated.
5. Engulfing Filter Engine
Customizable logic for OB qualification.
“Easy Engulfing Mode” simplifies detection for newer traders or faster workflow.
Fine-tune aggressiveness and visual clarity with user-defined settings.
6. Multi-Timeframe (MTF) Visualization
Overlay OBs, HOBs, BBs, and PHOBs from higher timeframes (e.g., 4H, 1D) on lower timeframes (15m, 1H).
Enhances top-down confluence without switching charts.
Keeps the visual experience clean and intuitive.
7. Minimalist Visual Design
Only the zone boundaries and EQ lines are displayed.
No extra noise—perfect for both scalpers and swing traders.
Dynamic label positioning and styling for improved chart aesthetics.
8. Performance-Optimized Code
Lightweight, real-time rendering.
Designed for responsiveness—even on lower timeframes with dense historical data.
⚙️ How It Works (Simplified Logic)
Order Block Detection:
Scans for engulfing candles that show displacement.
Defines the OB as the body of the engulfing candle.
EQ line is marked and projected forward until invalidated.
Hidden Order Block Logic:
Starts from a traditional OB, but requires the EQ to pass through at least one FVG.
Upon a close beyond the EQ in the opposite direction, the HOB is invalidated.
PHOB Logic:
Similar to HOBs, but allows partial touches of the EQ before reacting.
Breaker Block Logic:
Identifies liquidity sweeps followed by impulsive moves.
Marks these zones as BBs for potential reaction areas.
📈 Use Cases
Detect institutional price zones with high precision.
Simplify decision-making with visual EQs and MTF overlays.
Integrate seamlessly into:
Smart Money Concepts (SMC)
ICT-style trading
Wyckoff methodology
Discretionary zone-to-zone strategies
🧠 Definitions Summary
OB (Order Block):
Engulfed candle body; EQ is the midpoint of the body. Invalid once EQ is touched.
HOB (Hidden Order Block):
Like OB, but EQ must pass through at least one FVG.
Invalidated when a candle touches EQ and closes beyond it.
PHOB (Partial Hidden Order Block):
Like HOB, but allows partial touch of the EQ to remain valid.
Data Monitoring TableThis is a visual data dashboard specifically designed for users engaged in quantitative trading and technical analysis. It is equipped with two data tables that can dynamically display key market technical indicators and cryptocurrency price fluctuation data, supporting customizable column configurations and trading mode filtering.
✅ Core Features:
Intuitive display of critical technical indicators, including the Relative Strength Index (RSI), K-line entity gain, upper/lower shadow ratio, trading volume level, and change rate.
Multi-timeframe tracking of price fluctuations for BTC/ETH/SOL/XRP/DOGE (1-day, 6-hour, 3-hour).
Selectable trading modes: "long-only", "short-only", or "both".
Customizable number of columns to adapt to analysis needs across different timeframes.
All data is visualized in tables with color-coded prompts for market conditions (overbought, oversold, high volatility, low volatility, etc.).
📈 Target Audience:
Investors seeking systematic access to technical data.
Quantitative strategy developers aiming to capture market structural changes.
Intermediate and beginner traders looking to enhance market intuition and decision-making.
New Feature:
We have added a trading volume monitoring grade setting feature. Users can set the monitoring grade by themselves. When the market trading volume reaches this grade, the system will trigger an alarm. The default setting is level 5. This setting is designed to filter out trades with small fluctuations, helping users to capture key trading signals more accurately and improve the efficiency of trading decisions.
中文介绍
这是一款专为量化交易和技术分析用户设计的可视化数据仪表盘。它配备两个数据表格,可动态展示关键市场技术指标与加密货币价格波动数据,支持自定义列配置和交易模式筛选。
✅ 核心功能:
直观展示相对强弱指标(RSI)、K 线实体涨幅、上下影线比例、成交量水平及变化率等关键技术指标。
多时间框架追踪 BTC/ETH/SOL/XRP/DOGE 价格波动(1 日、6 小时、3 小时)。
可选交易模式:“仅做多”“仅做空” 或 “多空双向”。
可自定义列数,适配不同时间框架的分析需求。
所有数据以表格可视化呈现,通过颜色标注提示市场状况(超买、超卖、高波动、低波动等)。
📈 目标用户:
寻求系统获取技术数据的投资者。
旨在捕捉市场结构变化的量化策略开发者。
希望提升市场洞察力和决策能力的初、中级交易者。
新增功能:
我们新增了成交量监控等级设置功能。用户可自行设定监控等级,当市场成交量达到该等级时,系统将触发警报。默认设置为 5 级,此设置旨在过滤掉小幅波动的交易,帮助用户更精准地捕捉关键交易信号,提升交易决策效率。

Unified Sentiment Candles Overlay (SMA)Unified Sentiment Candles (SMA) Indicator
The Unified Sentiment Candles (SMA) is a custom overlay indicator designed to provide a smoothed visualization of market sentiment by plotting synthetic candles based on the Simple Moving Average (SMA) of open, high, low, and close prices. It helps traders identify trend direction and potential reversals more clearly.
How to Use:
- Observe Candle Colors: Green candles indicate bullish sentiment (close ≥ open), while red candles suggest bearish sentiment (close < open).
- Trend Identification: Consistent green candles point to an uptrend, whereas consistent red candles may signal a downtrend.
- Support & Resistance Zones: The SMA-based candles smooth out short-term volatility, assisting in spotting key support and resistance levels.
- Entry & Exit Signals: Look for color changes or candle pattern formations within the synthetic candles to time entries and exits more effectively.
Settings:
SMA Length : Adjust this parameter to control the smoothing period. A shorter length makes the indicator more responsive, while a longer length smooths out more noise.
This indicator is best used in conjunction with other technical analysis tools to confirm signals and improve trading accuracy.
This script is open-source and licensed under the Mozilla Public License 2.0. Use and modify it at your own discretion.

Greer Free Cash Flow Yield✅ Title
Greer Free Cash Flow Yield (FCF%) — Long-Term Value Signal
📝 Description
The Greer Free Cash Flow Yield indicator is part of the Greer Financial Toolkit, designed to help long-term investors identify fundamentally strong and potentially undervalued companies.
📊 What It Does
Calculates Free Cash Flow Per Share (FY) from official financial reports
Divides by the current stock price to produce Free Cash Flow Yield %
Tracks a static average across all available financial years
Color-codes the yield line:
🟩 Green when above average (stronger value signal)
🟥 Red when below average (weaker value signal)
💼 Why It Matters
FCF Yield is a powerful metric that reveals how efficiently a company turns revenue into usable cash. This can be a better long-term value indicator than earnings yield or P/E ratios, especially in capital-intensive industries.
✅ Best used in combination with:
📘 Greer Value (fundamental growth score)
🟢 Greer BuyZone (technical buy zone detection)
🔍 Designed for:
Fundamental investors
Value screeners
Dividend and FCF-focused strategies
📌 This tool is for informational and educational use only. Always do your own research before investing.

5DMA Optional HMA Entry📈 5DMA Optional HMA Entry Signal – Precision-Based Momentum Trigger
Category: Trend-Following / Reversal Timing / Entry Optimization
🔍 Overview:
The 5DMA Optional HMA Entry indicator is a refined price-action entry tool built for traders who rely on clean trend alignment and precise timing. This script identifies breakout-style entry points when price gains upward momentum relative to short-term moving averages — specifically the 5-day Simple Moving Average (5DMA) and an optional Hull Moving Average (HMA).
Whether you're swing trading stocks, scalping ETFs like UVXY or VXX, or looking for pullback recovery entries, this tool helps time your long entries with clarity and flexibility.
⚙️ Core Logic:
Primary Condition (Always On):
🔹 Close must be above the 5DMA – ensuring upward short-term momentum is confirmed.
Optional Condition (Toggled by User):
🔹 Close above the HMA – adds slope-responsive trend filtering for smoother setups. Enable or disable via checkbox.
Bonus Entry Filter (Optional):
🔹 Green Candle Wick Breakout – optional pattern logic that detects bullish momentum when the high pierces above both MAs, with a green body.
Reset Mechanism:
🔁 Signal resets only after price closes back below all active MAs (5DMA and HMA if enabled), reducing noise and avoiding repeated signals during chop.
🧠 Why This Works:
This indicator captures the kind of setups that professional traders look for:
Momentum crossovers without chasing late.
Mean reversion snapbacks that align with fresh bullish moves.
Avoids premature entries by requiring clear structure above moving averages.
Optional HMA filter allows adaptability: turn it off during choppy markets or range conditions, and on during trending environments.
🔔 Features:
✅ Adjustable HMA Length
✅ Enable/Disable HMA Filter
✅ Optional Green Wick Breakout Detection
✅ Visual “Buy” label plotted below qualifying bars
✅ Real-time Alert Conditions for automated trading or manual alerts
🎯 Use Cases:
VIX-based ETFs (e.g., UVXY, VXX): Catch early breakouts aligned with volatility spikes.
Growth Stocks: Time pullback entries during bullish runs.
Futures/Indices: Combine with macro levels for intraday scalps or swing setups.
Overlay on Trend Filters: Combine with RSI, MACD, or VWAP for confirmation.
🛠️ Recommended Settings:
For smooth setups in volatile names, use:
HMA Length: 20
Keep green wick filter ON
For fast momentum trades, disable the HMA filter to act on 5DMA alone.
⭐ Final Thoughts:
This script is built to serve both systematic traders and discretionary scalpers who want actionable signals without noise or lag. The toggleable HMA feature lets you adjust sensitivity depending on market conditions — a key edge in adapting to volatility cycles.
Perfect for those who value clean, non-repainting entries rooted in logical structure.

cd_cisd_market_CxHi Traders,
Overview:
Many traders follow market structure to identify the market direction and seek trade opportunities in line with the trend.
However, markings derived from user-defined inputs can create different structures, depending on personal choices. For instance, choosing a pivot distance of 3 instead of 2 alters the structure, even though the chart remains the same. Ideally, the structure should remain consistent.
"Change in State Delivery" ( CISD ) is a widely accepted concept among traders and is considered a significant indicator of market direction based on the gain/loss of CISD levels.
In this indicator, CISD is selected as the primary criterion for marking market structure, eliminating the influence of user-dependent variations.
Here is a summary of the key logic and rules applied:
• When the price forms a new high/low, that level is only considered a pivot if a CISD has occurred.
• A bullish CISD is always followed by a bearish CISD, and vice versa.
• Pivot points form the internal structure.
• The internal structure is used to interpret the swing structure.
• Probabilities are derived from internal structure patterns.
________________________________________
Details:
How is CISD determined?
As is commonly known:
• When price makes a new high, the opening level of the first candle in the consecutive bullish candle sequence is marked.
• When price makes a new low, the opening of the first candle in the consecutive bearish sequence is marked.
• If there’s only one candle in the sequence, its opening level is used.
In a bullish market, losing a bearish CISD level (i.e., a close below it) or in a bearish market, gaining a bullish CISD level (i.e., a close above it) is interpreted as a potential shift in buyer-seller dominance and a possible market reversal.
________________________________________
How are internal (pivot) levels determined?
• When price closes below a bearish CISD level, the highest candle's high becomes a pivot high (PH).
• When price closes above a bullish CISD level, the lowest candle's low becomes a pivot low (PL).
• If the new PH is above the previous PH, it’s labeled as HH (Higher High); otherwise, LH (Lower High).
• If the new PL is below the previous PL, it’s labeled as LL (Lower Low); otherwise, HL (Higher Low).
________________________________________
Internal Market Structure:
• A series of HHs indicates a bullish internal structure.
• A series of LLs indicates a bearish internal structure.
________________________________________
Swing (Main) Market Structure:
Using internal pivots and previous swing levels, the main market structure is derived.
• A new swing high (SH) requires the price to move above the previous SH.
• A new swing low (SL) requires the price to move below the previous SL.
________________________________________
Probability Calculation:
Pivot levels forming the internal structure are coded as five-element sequences.
There are 64 possible combinations of such sequences made from consecutive PH and PL values.
Each pattern’s frequency from its starting candle is tracked.
To make it more understandable:
For example, after the four-sequence “HH, LL, LH,HL”, either HH or LH might follow.
The table shows the statistical likelihood of both possible outcomes for the most recent four-element sequence on the chart.
________________________________________
How reliable is it?
To assess reliability, results are calculated from the beginning using:
Success Rate (Suc. Rt) = Number of Correct Predictions / Total Predictions
This value is added to the table for reference.
It’s important to note that no statistical outcome guarantees certainty—every result offers a different interpretation. What truly matters is to avoid getting stopped out 😊.
________________________________________
Menu Options:
Show/hide preferences and color selections can be customized via the indicator menu.
________________________________________
What’s Coming in Future Versions?
Features such as FVG (Fair Value Gaps) between swing levels, volume imbalances, order blocks / mitigation blocks, Fibonacci levels, and relevant trade suggestions will be added.
________________________________________
This is a BETA version that I believe will help simplify your market reading. I’d be happy to hear your feedback and suggestions.
Cheerful Trading!

Wyckoff Entry Times @jqrmThis indicator visually marks two custom time zones on your TradingView chart by drawing vertical lines at the start and end of each zone. The first time zone spans from 9:27 AM to 9:33 AM, highlighted in red, and the second spans from 9:50 AM to 10:10 AM, highlighted in blue. You can enable or disable each zone's lines using the indicator inputs. This helps to quickly spot important intraday sessions or time ranges on your chart.

PineConnector [Extension] | FractalystWhat is the PineConnector Extension?
The PineConnector Extension is a sophisticated bridge indicator designed to seamlessly connect Quantify trading signals with PineConnector's automated execution system.
This extension transforms manual signal monitoring into fully automated trading by interpreting Quantify's signal outputs and converting them into executable PineConnector commands.
Unlike standalone trading indicators, this extension serves as a communication layer between your signal generation (Quantify indicator) and trade execution (PineConnector), enabling hands-free trading across multiple timeframes and instruments.
How does the signal processing work?
The extension processes four distinct signal types from Quantify indicators:
Signal Values:
1 = Buy/Long signal - Opens bullish positions
-1 = Sell/Short signal - Opens bearish positions
0.5 = Close Long - Closes all long positions
-0.5 = Close Short - Closes all short positions
The script continuously monitors the "Signal Source" input, which should be connected to any Quantify indicator's output. When a signal is detected, the extension automatically generates the corresponding PineConnector command with your configured parameters.
What are the available order types and how do they work?
The extension supports three order execution modes:
Market Orders:
- Execute immediately at current market price
- Highest execution probability
- Subject to slippage during volatile conditions
Limit Orders:
- Execute only when price reaches a more favorable level
- Buy limits placed below current price
- Sell limits placed above current price
- Dynamic pip offset calculated using ATR-based volatility
Stop Orders:
- Execute when price breaks beyond specified levels
- Buy stops placed above current price
- Sell stops placed below current price
- Useful for breakout strategies
Dynamic Pricing Calculation:
The extension calculates optimal entry prices using volatility-adjusted pip offsets:
priceVolatility = ta.atr(14) / close * 100
volatilityFactor = math.min(math.max(priceVolatility / 0.1, 0.5), 2.0)
pipsOffset = 10 * volatilityFactor
How does the risk management system work?
Risk Percentage:
The extension uses percentage-based position sizing where you specify the risk per trade (0.1% to 10.0%). This value is passed to PineConnector, which calculates the exact position size based on:
- Account balance
- Stop loss distance
- Instrument specifications
- Broker settings
Stop Loss Integration:
- The "Stop Source" input connects to external stop loss levels from Quantify or other indicators. - This ensures:
- Consistent risk-reward ratios
- Dynamic stop placement based on market structure
- Automatic position sizing calculations
Multi-Asset Compatibility:
The extension automatically detects instrument types and adjusts pip calculations:
Forex: mintick * 10
Crypto: mintick * 10
Other assets: mintick * 1
What does the information display table show?
The real-time status table provides essential configuration monitoring:
Status Indicators:
- License: Shows PineConnector license ID status (Blue = Set, Red = Missing)
- Security: Displays secret key status (Blue = Set, Orange = Disabled)
- Comment: Shows trade comment or timeframe if empty
- Symbol: Current trading symbol (manual override or chart symbol)
- Order Type: Active execution mode (Market/Limit/Stop)
- Risk: Risk percentage with color coding (Blue ≤1%, Orange >1%)
- Signal: Connection status (Blue = Connected, Red = Not Set)
- Stop: Stop loss source status (Blue = Connected, Red = Not Set)
Color Coding System:
Blue: Optimal/Connected
Orange: Warning/Moderate risk
Red: Error/Not configured
How do I connect this to my Quantify indicator?
Step-by-Step Connection:
Add the PineConnector Extension to your chart containing Quantify indicator
Configure Signal Source:
In the extension settings, locate "Signal Source"
Click the dropdown and select your Quantify indicator's signal output
The extension will automatically detect custom sources vs. default price data
Configure Stop Source:
Connect "Stop Source" to your Quantify indicator's stop loss output
This enables dynamic position sizing based on stop distance
Verify Connection:
Check the information table for "Signal" and "Stop" status
Blue indicates successful connection
Red indicates default price data (not connected)
Compatible Quantify Indicators:
- Quantify Trading Model
- Any indicator outputting standardized signals (1, -1, 0.5, -0.5)
What PineConnector setup is required?
Prerequisites:
- Active PineConnector License - Required for all functionality
- MetaTrader 4/5 or supported broker platform
- PineConnector EA installed and configured
- TradingView Pro/Pro+/Premium for alert functionality
Configuration Steps:
- License ID: Enter your PineConnector license ID in the extension
- Secret Key: Optional security layer for command verification
- Symbol Mapping: Ensure symbol names match between TradingView and broker
- Alert Setup: Create TradingView alerts using this indicator
- Webhook Configuration: Point alerts to your PineConnector webhook URL
Security Features:
- Optional secret key encryption
- Symbol-specific commands
- Debug mode for testing and validation
What makes this extension unique?
Seamless Integration:
- Unlike manual signal copying, this extension provides:
- Zero-latency signal translation
- Automated parameter passing
- Consistent execution across timeframes
- No human intervention required
Dynamic Adaptability:
Volatility-adjusted pricing for limit/stop orders
Automatic symbol detection and conversion
Multi-asset pip calculations
Intelligent timeframe formatting
Professional Risk Management:
- Percentage-based position sizing
- External stop loss integration
- Multi-order type support
- Real-time status monitoring
Robust Architecture:
- Error-resistant signal processing
- Comprehensive input validation
- Debug and testing capabilities
- Security features for live trading
Installation and Setup Guide
Quick Start:
- Add "PineConnector | Fractalyst" to your chart
- Configure your PineConnector license ID
- Connect Signal Source to your Quantify indicator
- Connect Stop Source to your stop loss indicator
- Set your preferred risk percentage
- Choose order type (Market recommended for beginners)
- Create TradingView alert using this indicator
- Ensure PineConnector EA is running on your trading platform
Advanced Configuration:
- Custom symbol mapping for cross-platform trading
- Secret key implementation for enhanced security
- Comment customization for trade tracking
- Debug mode for strategy validation
Legal Disclaimers and Risk Acknowledgments
Trading Risk Disclosure
This PineConnector Extension is provided for informational, educational, and automation purposes only and should not be construed as financial, investment, or trading advice. The extension facilitates automated trading connections but does not guarantee profitable outcomes, successful trade execution, or positive investment returns.
Automated trading systems carry substantial risks including but not limited to total capital loss, system failures, connectivity issues, and adverse market conditions. The extension's performance depends on multiple third-party services including PineConnector, MetaTrader platforms, TradingView infrastructure, and broker execution quality, any of which may experience downtime, technical failures, or service interruptions that could affect trading performance.
System Dependency Acknowledgment
The extension requires continuous operation of multiple interconnected systems: TradingView charts and alerts, PineConnector services and Expert Advisors, MetaTrader platforms, broker connectivity, and stable internet connections. Any interruption or malfunction in these systems may result in missed signals, failed executions, or unexpected trading behavior.
Users acknowledge that neither the seller nor the creator of this extension has control over these third-party services and cannot guarantee their availability, accuracy, or performance. Market conditions, broker execution policies, slippage, and technical factors may significantly affect actual trading results compared to theoretical or backtested performance.
Liability Limitation
By utilizing this extension, users acknowledge and agree that they assume full responsibility and liability for all trading decisions, financial outcomes, and potential losses resulting from the use of this automated trading system. Neither the seller nor the creator shall be liable for any unfavorable outcomes, financial losses, missed opportunities, or damages resulting from the development, use, malfunction, or performance of this extension.
Past performance of connected indicators, strategies, or the extension itself does not guarantee future results. Trading outcomes depend on numerous factors including market conditions, economic events, broker execution quality, network connectivity, and proper system configuration, all of which are beyond the control of the extension creator.
User Responsibility Statement
Users are solely responsible for understanding the risks associated with automated trading, properly configuring all system components, maintaining adequate capitalization and risk management, and regularly monitoring system performance. Users should thoroughly test the extension in demo environments before live deployment and should never risk more capital than they can afford to lose.
This extension is designed to automate signal execution but does not replace the need for proper risk management, market understanding, and trading discipline. Users should maintain active oversight of their automated trading systems and be prepared to intervene manually when necessary.

[Mustang Algo] Channel Strategy# Mustang Algo Channel Strategy - Universal Market Sentiment Oscillator
## 🎯 ORIGINAL CONCEPT
This strategy employs a unique market sentiment oscillator that works on ALL financial assets. It uses Bitcoin supply dynamics combined with stablecoin market capitalization as a macro sentiment indicator to generate universal timing signals across stocks, forex, commodities, indices, and cryptocurrencies.
## 🌐 UNIVERSAL APPLICATION
- **Any Asset Class:** Stocks, Forex, Commodities, Indices, Crypto, Bonds
- **Market-Wide Timing:** BTC/Stablecoin ratio serves as a global risk sentiment gauge
- **Cross-Market Signals:** Trade any instrument using macro liquidity conditions
- **Ecosystem Approach:** One oscillator for all financial markets
## 🧮 METHODOLOGY
**Core Calculation:** BTC Supply / (Combined Stablecoin Market Cap / BTC Price)
- **Data Sources:** DAI + USDT + USDC market capitalizations
- **Signal Generation:** RSI(14) applied to the ratio, double-smoothed with WMA
- **Timing Logic:** Crossover signals filtered by overbought/oversold zones
- **Multi-Timeframe:** Configurable timeframe analysis (default: Daily)
## 📈 TRADING STRATEGY
**LONG Entries:** Bullish crossover when market sentiment is oversold (<48)
**SHORT Entries:** Bearish crossover when market sentiment is overbought (>55)
**Universal Timing:** These macro signals apply to trading any financial instrument
## ⚙️ FLEXIBLE RISK MANAGEMENT
**Three SL/TP Calculation Modes:**
- **Percentage Mode:** Traditional % based (4% SL, 12% TP default)
- **Ticks Mode:** Precise tick-based calculation (50/150 ticks default)
- **Pips Mode:** Forex-style pip calculation (50/150 pips default)
**Realistic Parameters:**
- Commission: 0.1% (adjustable for different asset classes)
- Slippage: 2 ticks
- Position sizing: 10% of equity (conservative)
- No pyramiding (single position management)
## 📊 KEY ADVANTAGES
✅ **Universal Application:** One strategy for all asset classes
✅ **Macro Foundation:** Based on global liquidity and risk sentiment
✅ **False Signal Filtering:** Overbought/oversold zones reduce noise
✅ **Flexible Risk Management:** Multiple SL/TP calculation methods
✅ **No Lookahead Bias:** Clean backtesting with realistic results
✅ **Cross-Market Correlation:** Captures broad market risk cycles
## 🎛️ CONFIGURATION GUIDE
1. **Asset Selection:** Apply to stocks, forex, commodities, indices, crypto
2. **Timeframe Setup:** Daily recommended for swing trading
3. **Sentiment Bounds:** Adjust 48/55 levels based on market volatility
4. **Risk Management:** Choose appropriate SL/TP mode for your asset class
5. **Direction Filter:** Select Long Only, Short Only, or Both
## 📋 BACKTESTING STANDARDS
**Compliant with TradingView Guidelines:**
- ✅ Realistic commission structure (0.1% default)
- ✅ Appropriate slippage modeling (2 ticks)
- ✅ Conservative position sizing (10% equity)
- ✅ Sustainable risk ratios (1:3 SL/TP)
- ✅ No lookahead bias (proper historical simulation)
- ✅ Sufficient sample size potential (100+ trades possible)
## 🔬 ORIGINAL RESEARCH
This strategy introduces a revolutionary approach to financial markets by treating the BTC/Stablecoin ratio as a global risk sentiment gauge. Unlike traditional indicators that analyze individual asset price action, this oscillator captures macro liquidity flows that affect ALL financial markets - from stocks to forex to commodities.
## 🎯 MARKET APPLICATIONS
**Stocks & Indices:** Risk-on/risk-off sentiment timing
**Forex:** Global liquidity flow analysis for major pairs
**Commodities:** Risk appetite for inflation hedges
**Bonds:** Flight-to-safety vs. risk-seeking behavior
**Crypto:** Native application with direct correlation
## ⚠️ RISK DISCLOSURE
- Designed for intermediate to long-term trading across all timeframes
- Market sentiment can remain extreme longer than expected
- Always use appropriate position sizing for your specific asset class
- Adjust commission and slippage settings for different markets
- Past performance does not guarantee future results
## 🚀 INNOVATION SUMMARY
**What makes this strategy unique:**
- First to use BTC/Stablecoin ratio as universal market sentiment indicator
- Applies macro-economic principles to technical analysis across all assets
- Single oscillator provides timing signals for entire financial ecosystem
- Bridges traditional finance with digital asset insights
- Combines fundamental liquidity analysis with technical precision

SEJKING - TimingSEJKING - Timing Indicator: Professional Session-Based Trading Tool
The SEJKING - Timing indicator is a sophisticated trading tool designed for intraday traders who focus on key market sessions. It provides visual cues for Asian, London, and New York trading sessions, highlights important price levels, and delivers volatility metrics - all in one comprehensive package.
Key Features:
Session Visualization:
Color-coded boxes for Asian (purple), London (gray), and New York (gray) sessions
Automatic Daylight Saving Time adjustments (2022-2025)
Customizable colors and visibility for each session
Volatility Measurement:
Real-time pip count calculations for each session
Visual labels showing range volatility (A=Asian, L=London, N=New York)
Critical Price Levels:
Daily Levels:
Previous day's high/low as black dashed lines (HOPD/LOPD)
Lines extend until 5 AM EST the following day
"HOPD" (High of Previous Day) and "LOPD" (Low of Previous Day) labels
Weekly Levels:
Previous week's high/low as orange dashed lines
Lines extend until following Wednesday at 5 AM EST
"WH" (Weekly High) and "WL" (Weekly Low) labels at line ends
Smart Timeframe Handling:
Auto-hides elements on higher timeframes (15-30 minute setting)
Special handling for Asian session on higher timeframes
Key Reference Lines:
Yesterday's high, low, and close
Weekly high and low levels
Option to display only on most recent bar
Benefits for Traders:
Session Awareness: Visually track active market sessions to align with peak volatility periods
Key Level Identification: Quickly spot crucial support/resistance from daily and weekly levels
Volatility Gauge: Measure session range strength through pip counts
Time-Based Analysis: Extended lines help identify which levels remain relevant throughout the trading day
DST-Proof: Automatically adjusts for global daylight saving time changes
Ideal For:
Forex traders focusing on London/NY sessions
Asian session specialists
Price action traders using previous day/week levels
Volatility-based strategies
Intraday traders needing session awareness
Input Options:
Toggle visibility for each trading session
Customize Asian session colors
Set maximum timeframe for box visibility (15-30 mins)
Choose to display key levels only on recent bars
How It Works:
The indicator automatically calculates session timings based on UTC-7 (US Mountain Time), with intelligent DST adjustments. At the start of each Asian session, it plots new daily and weekly levels, extending them to their respective expiration times (5 AM EST next day for daily, next Wednesday for weekly). Session boxes show the price range during each market open, with pip counts displayed at session close.
Trading Applications:
Use HOPD/LOPD as breakout or reversal levels
Trade bounces off weekly levels (WH/WL)
Identify low-volatility sessions for range trading
Spot high-volatility sessions for breakout strategies
Combine session boxes with key levels for confluence
Note: Optimized for Forex but works on all instruments. Asian session hours automatically adjust for non-Forex assets.

SMT DivergenceSMT Divergence Indicator
This powerful indicator identifies high-probability reversal points by detecting SMT (Smart Money Technique) divergences between two correlated assets. It spots subtle shifts in market momentum, revealing when one asset fails to confirm the price action of another—often signaling an impending trend change.
Key Features:
Inter-Market Divergence Detection: Automatically compares the price action of the main symbol with a second user-defined asset.
Identifies Key Reversals: Pinpoints both bullish and bearish SMT divergences, highlighting hidden strength in downtrends and underlying weakness in uptrends.
Customizable Pivot Detection: Allows fine-tuning of the pivot length to adjust sensitivity for different market conditions and timeframes.
Flexible Display Modes: Choose between clean 'Lines' connecting the diverging pivots or precise 'Labels' marking the exact high/low points.
Full Visual Customization: Complete control over the colors and line thickness for seamless integration with your existing chart layout.
Built-in Alerts: Stay notified of every potential opportunity with alerts for both bullish and bearish signals.
Settings:
Core Parameters:
Comparison Symbol: Select the second asset to compare against for divergence analysis (e.g., NQ1! if you are charting ES1!).
Pivot Length: Defines the number of bars to the left and right required to confirm a pivot high or low.
Visual Settings:
Display Style: Choose to visualize divergences as 'Lines' or 'Labels'.
Bearish/Bullish Color: Set custom colors for bearish and bullish divergence indicators.
Line Width: Adjust the thickness of the divergence lines for optimal visibility.
Perfect for traders who utilize inter-market analysis to confirm trade ideas. The SMT Divergence indicator provides a crucial edge by exposing non-confirmations between related assets, allowing for earlier and more confident entries into potential market reversals.

Big Move Follow-Through Tracker🚀 What This Indicator Does
Ever wondered if that sudden 5% pump in your favorite crypto will continue or just fade away? This powerful indicator automatically tracks every significant price move and tells you exactly what happened next - momentum continuation or mean reversion.
🎯 Key Features
📊 Smart Move Detection
Automatically identifies "big moves" based on your custom threshold (default 3%)
Uses ATR filtering to ensure moves are truly significant, not just normal volatility
Works on ANY timeframe and ANY crypto pair
🔍 Follow-Through Analysis
Tracks each big move for your specified number of bars (default 5)
Classifies outcomes as either Follow-Through (momentum continues) or Mean Reversion (price reverses)
Uses intelligent 2% thresholds to avoid noise and focus on meaningful moves
📈 Real-Time Statistics Dashboard
Live statistics table showing historical performance
Separate analysis for UP moves vs DOWN moves (crypto often behaves differently!)
Percentage breakdowns of follow-through vs reversion rates
Track total moves detected vs analyzed over time
🎨 Visual Clarity
Clear arrow signals when big moves are detected
Background highlighting during significant moves
Customizable display options - show/hide signals and stats as needed
🛠️ How to Use
Add to any crypto chart (works on BTC, ETH, altcoins, etc.)
Adjust the move threshold (3% for major coins, higher for smaller caps)
Set analysis timeframe (how many bars to track each move)
Watch the statistics build over time to understand your asset's behavior
💡 Trading Applications
For Momentum Traders:
High follow-through rates? → Consider riding the momentum
Trade in direction of big moves when statistics support it
For Mean Reversion Traders:
High reversion rates? → Look for fade opportunities
Counter-trade big moves when they historically reverse
For Risk Management:
Understand typical behavior after significant moves
Size positions based on historical follow-through probabilities
📋 Customizable Settings
Big Move Threshold: Adjust sensitivity (0.5% - 10%)
Analysis Period: How long to track each move (3-20 bars)
Display Options: Toggle signals and statistics table
Alert System: Get notified when big moves occur
🎲 What Makes This Different
Unlike simple momentum indicators, this tool:
✅ Quantifies actual outcomes with real statistics
✅ Adapts to each asset's unique volatility profile
✅ Separates up and down move behavior
✅ Provides actionable probability data
📊 Perfect For
Crypto day traders looking for edge identification
Swing traders wanting to understand momentum vs reversion tendencies
Risk managers needing probability-based position sizing
Strategy developers building data-driven trading systems
⚡ Quick Setup Tips
For Major Cryptos (BTC, ETH): Use 2-4% threshold
For Altcoins: Use 4-8% threshold
For Scalping: Use lower timeframes with 1-2% threshold
For Swing Trading: Use higher timeframes with 5%+ threshold

The Butterfly [theUltimator5]This is a technical analysis tool designed to automatically detect and visualize Butterfly harmonic patterns based on recent market pivot structures. This indicator uses a unique plotting and detection algorithm to find and display valid Butterfly patterns on the chart.
The indicator works in real-time and historically by identifying major swing highs and lows (pivots) based on a user-defined ZigZag length. It then evaluates whether the most recent price structure conforms to the ideal proportions of a bullish or bearish Butterfly pattern. If the ratios between price legs XA, AB, BC, and projected CD meet defined tolerances, the pattern is plotted on the chart along with a projected D point for potential reversal.
Key Features:
Automatic Pivot Detection: The script analyzes recent price action to construct a ZigZag pattern, identifying swing points as potential X, A, B, and C coordinates.
Butterfly Pattern Validation: The pattern is validated against traditional Fibonacci ratios:
--AB should be approximately 78.6% of XA.
--BC must lie between 38.2% and 88.6% of AB.
--CD is projected as a multiple of BC, with user control over the ratio (e.g., 1.618–2.24).
Bullish and Bearish Recognition: The pattern logic detects both bullish and bearish Butterflies, automatically adjusting plotting direction and color themes.
Custom Ratio Tolerance: Users can define how strictly the AB/XA and BC/AB legs must adhere to ideal ratios, using a percentage-based tolerance slider.
Fallback Detection Logic: If a new pattern is not identified in recent bars, the script performs a backward search on the last four pivots to find the most recent valid pattern.
Force Mode: A toggle allows users to force the drawing of a Butterfly pattern on the most recent pivot structure, regardless of whether the ideal Fibonacci rules are satisfied.
Dynamic Visualization:
--Clear labeling of X, A, B, C, and D points.
--Colored connecting lines and filled triangles to visualize structure.
--Optional table displaying key Fibonacci ratios and how close each leg is to ideal values.
Inputs:
Length: Controls the sensitivity of the ZigZag pivots. Smaller values result in more frequent pivots.
Tolerance (%): Adjustable threshold for acceptable deviation in AB/XA and BC/AB ratios.
CD Length Multiplier: Projects point D by multiplying the BC leg using a value between 1.618 and 2.24.
Force New Pattern: Overrides validation checks to display a Butterfly structure on recent pivots regardless of ratio accuracy.
Show Table: Enables a table showing calculated ratios and deviations from the ideal.

TreeCandlePattern-FusimetriaA Powerful 3-Candle Reversal Pattern Inspired by Smart Money Principles
How to Use the Indicator Effectively
This pattern works exceptionally well across higher timeframes (H4, Daily, Weekly) where institutional traders operate, often appearing at key turning points in the market.
Key Settings
Best Timeframes: H1 for intraday trades, H4/Daily for swing positions
Customisation Options: Adjust arrow colours (green for bullish, red for bearish) and size for better visibility
Alerts: Set notifications for when new signals appear to catch reversals early
The indicator automatically marks:
🔺 Bullish reversals (when price breaks under previous lows then surges back up)
🔻 Bearish reversals (when price spikes above prior highs then collapses)
The Trading Philosophy Behind the Pattern
This setup is remarkably similar to the classic "Power of Three" reversal structure, where:
The First Candle shows the final push of the current trend (either greed in an uptrend or fear in a downtrend)
The Second Candle traps retail traders by creating false breakouts (where smart money accumulates or distributes)
The Third Candle confirms the reversal by closing beyond the extreme of the second candle
Why This Works Like Smart Money Trading
Institutional traders often use these false breakouts to enter positions against the crowd
The third candle's close beyond the extreme shows absorption of liquidity (stops being taken out before reversal)
Works particularly well near key support/resistance levels where banks and hedge funds place their orders
Advanced Confirmation Techniques
To filter out false signals and trade like the professionals:
Volume Analysis
Look for higher volume on the second candle (shows strong institutional interest)
The third candle should ideally have lower volume as retail traders get trapped
Price Action Context
Works best after strong trends (not in ranging markets)
Combine with Fibonacci levels (61.8% retracements often see reversals)
Watch for wick rejections on the third candle (shows failure of breakout)
Example: Bitcoin (BTC/USDT) Daily Chart
!
After a long uptrend, price makes a false breakout above resistance (second candle)
The next candle closes below the second candle's low, confirming reversal
This was followed by a 30% drop as smart money exited longs
When to Enter & Exit Trades
✅ Entry: At the open of the fourth candle after confirmation
✅ Stop Loss: Just beyond the extreme of the second candle
✅ Take Profit: At nearest support/resistance level or using 1:2 risk-reward
⚠️ Avoid This Pattern In:
Choppy, sideways markets
During major news events when price action becomes erratic

S&P Power Hour Liquidity Sweep StrategyThis indicator is designed for intraday traders who want to take advantage of liquidity grabs, break of structure (BOS), and optimal entry points during the most volatile hours of the trading day: the NYSE Power Hours (09:30–10:30 AM and 02:30–04:00 PM EST).
Key Features:
Power Hour Detection:
Automatically identifies the two most liquid hours of the trading session.
Liquidity Sweep Detection:
Highlights when price sweeps a recent swing high or low — a common trap before reversals.
Break of Structure (BOS):
Confirms trend shift after a liquidity sweep with smart money-style BOS markers.
Fair Value Gap (FVG) Highlighting: (Optional)
Spot institutional imbalances between candles to fine-tune trade entries.
How It Works:
Wait for price to sweep a swing high or low during the power hours.
Look for a break of structure (BOS) in the opposite direction.
Enter on the next candle or FVG retest.
The indicator will plot a yellow circle for entry, a red line for stop, and a green line for the target (based on your RR setting).
Customizable Inputs:
Swing sensitivity (lookback bars)
Risk-to-reward ratio
Optional FVG visibility
Best Used With:
Higher timeframe bias (15m/1H)
Order blocks or volume analysis
Avoiding major news events
Whether you're a scalper or precision-based intraday trader, this tool helps you spot high-probability reversal setups with clean visuals and clear confirmations.
