Essential DataThis script is used to create an "on chart" visual table checklist that ensures trading happens within my defined parameters. Thresholds are adjustable, and color indicators are adjustable as well. The table can be placed at any corner of the chart, and has two different sizes.
I use this to let me know quickly when I pull up a ticker if the parameters match what I am looking for to trade. Green means go, and red is no!
This was my first script, and it was made with the help of ChatGPT. I am not a coder, so use with caution.
Chart patterns

Unified Signals + BB Expansion Filtercan be universal use for different futures product but yet to fine tune for individual use

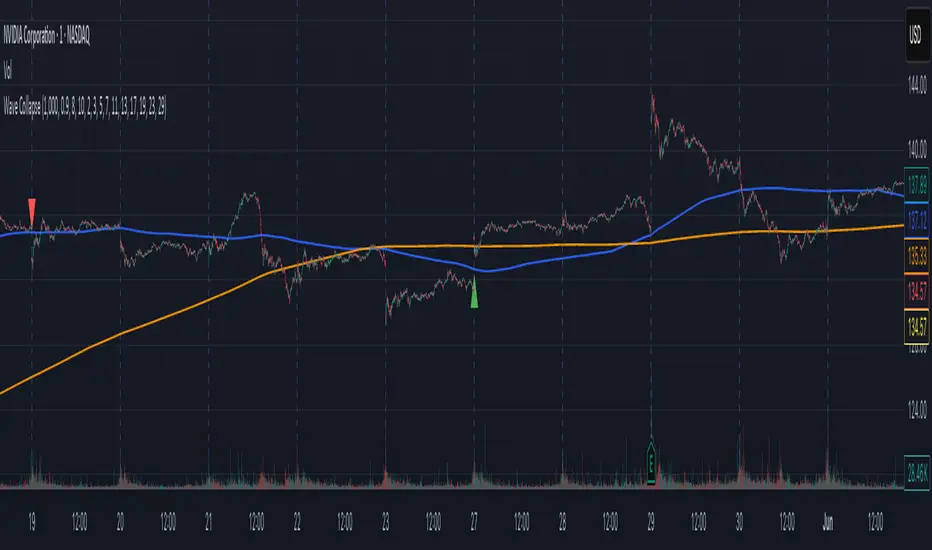
Wave Collapse Simulation - Confirmation of New TrendThis Pine Script, titled "Wave Collapse Simulation - Confirmation of New Trend," is an advanced indicator designed to identify high-conviction trend changes. It operates on the principle of a "wave collapse," a metaphor for a moment when market uncertainty resolves into a new, confirmed direction. It identifies these moments by combining signals from market structure, trend-following moving averages, and a spike in volatility. The indicator plots its signals directly on the price chart
The core idea is that a stable trend (making higher highs and higher lows, or vice-versa) will eventually fail. This script pinpoints the exact moment this failure is confirmed by a significant price move that breaks key levels, signaling the start of a new trend.
Key Components
1. Multi-Length Pivot Analysis
Instead of relying on a single lookback period, the script analyzes market structure using up to ten different pivot lengths (e.g., 2, 3, 5, 7, 11...).
Structural Failure: It constantly monitors these pivots to see if the market fails to make a new higher high in an uptrend (higherHighsFailed) or a new lower low in a downtrend (lowerLowsFailed). A failure in this pattern is the first sign that the prevailing trend is weakening.
2. Trend Context and Volatility Trigger
The script uses two additional components to validate a potential trend change:
Long-Term Trend: Two slow-moving averages (999 and 3000 periods) are used to establish the dominant, long-term trend direction. A signal can only occur if it aligns with a break of this established trend.
Volatility Spike: It uses the Average True Range (ATR) to detect a sudden, powerful price movement. A "collapse" is only considered valid if the price moves more than a specified multiple of the ATR, ensuring the signal is backed by significant market force and not just noise.
3. The "Collapse" Event
This is the central logic of the indicator. A bullish or bearish collapse is a high-probability signal triggered only when three specific conditions are met simultaneously:
Bullish Collapse (New Uptrend):
Structure: The market has failed to make new lower lows.
Trend Break: The price breaks above the short-term moving average during a long-term downtrend.
Volatility: The move is accompanied by a significant volatility spike.
Bearish Collapse (New Downtrend):
Structure: The market has failed to make new higher highs.
Trend Break: The price breaks below the short-term moving average during a long-term uptrend.
Volatility: The move is accompanied by a significant volatility spike.
4. Gaussian Probability Simulation
The script includes a Gaussian (normal distribution) function to model market certainty.
Sigma (σ): This variable represents the standard deviation, or "uncertainty." After a collapse event, sigma is reset to a very small value, representing a moment of high certainty about the new trend.
Decay: If no new collapse occurs, sigma gradually increases with each bar, representing the return of uncertainty to the market. While the script calculates the probabilities for a price distribution (the "wave"), its primary function is to use the state of sigma to define the collapse event itself, rather than plotting a visual wave.
How It Appears on the Chart
Moving Averages: The long-term maShort (blue) and maLong (orange) are plotted to show the underlying trend context.
Collapse Signals:
A green triangle is plotted below the price bar to signal a Bullish Collapse.
A red triangle is plotted above the price bar to signal a Bearish Collapse.
Collapse Price: A horizontal red line appears at the price where the collapse was triggered, serving as a key reference level for the new trend.
2EZ-Silence🕊️ 2EZ-Silence — Candle Pattern & Swing Reversal Detection
The 2EZ-Silence is a minimalist, pattern-based price action indicator focused on identifying key swing points and candlestick reversal patterns with surgical precision. Ideal for traders who rely on clean charts and strong signals rather than constant noise.
🔍 Core Features:
Pivot-Based Swing Detection
Uses configurable pivot logic to mark swing highs and lows
Candle Pattern Recognition
Identifies a wide range of key reversal candlestick formations:
Hammer / Inverted Hammer
Hanging Man / Shooting Star
Bullish & Bearish Engulfing
Morning / Evening Stars
Doji, Spinning Top, Marubozu
Three White Soldiers / Three Black Crows
Smart Labeling System
Marks high-probability reversal zones with ▲ and ▼ entries based on pattern + swing confluence
🎛️ Customizable Inputs:
Pivot Length sensitivity
Label colors for swing highs and lows

2EZ Omega Indicator V3🧠 2EZ Omega Indicator V3
The 2EZ Omega V3 is a high-precision, multi-layered confluence system designed to generate elite-level BUY and SELL signals for trend traders and scalpers. Built from the ground up with advanced filtering and market condition detection, this version integrates dynamic market structure with smart volatility-based TP/SL plotting.
🔍 Core Signal Engine Includes:
WaveTrend Oscillator crossovers for momentum shifts
MACD Histogram Reversals to catch early trend moves
Kalman Filter for real-time directional smoothing
Heikin Ashi Supertrend logic to filter chop
RSI + Volume Spike Confluence for added entry strength
🎯 Smart Signal Logic:
A weighted score system evaluates all conditions to issue a signal only when at least 3 bullish or bearish conditions align, avoiding noise and increasing win consistency.
💹 Risk Tools Included:
Auto-calculated TP/SL levels using ATR-based volatility
Real-time position tracking with visual label alerts
Integrated alert system for Long & Short signals

Slope Based Divergences Multi-Block (Dual Price)This Pine Script® indicator, titled "Slope Based Divergences Multi-Block (Dual Price)," is engineered to identify high-conviction trading signals by detecting divergences across multiple look-back lengths simultaneously. It uses a unique method of calculating momentum through average slopes rather than traditional price points, applying this logic to two different price sources and an oscillator for a comprehensive market view.
Core Concept: Average Slope Analysis
Instead of just looking at price or oscillator values, the indicator's foundation is built on measuring the rate-of-change, or slope, of the market. It goes a step further by calculating an average slope over a specified range of lengths. This provides a much more stable and robust measure of momentum compared to a single-length calculation, effectively smoothing out noise and focusing on the true underlying trend.
The Multi-Block System
The indicator's main strength comes from its "multi-block" design, which concurrently analyzes the market from three distinct perspectives:
Block 1 (Short-Term): Focuses on recent price action.
Block 2 (Mid-Term): Looks at the intermediate trend.
Block 3 (Long-Term): Analyzes the broader, underlying market structure.
For each of these blocks, the indicator calculates the average slope for two separate price sources (e.g., high and low) and one oscillator source (e.g., RSI, Stochastics).
Normalization and Thresholds
To make the slope values from different look back lengths comparable, the indicator converts each calculated average slope into a percentile rank. This rank, from 0 to 100, shows how extreme the current slope is compared to its historical values. Each of the three blocks has its own customizable high and low thresholds, allowing you to define precisely what constitutes a significant upward or downward momentum for that specific timeframe.
High-Confluence Divergence Signals
A divergence is flagged when there's a clear disagreement between the direction of price and the direction of the oscillator. For example, a bullish divergence occurs when the price sources are showing significant downward momentum (low percentile rank slopes) while the oscillator is showing significant upward momentum (high percentile rank slope).
The final signal is intentionally very selective. A "BULL" or "BEAR" signal is only generated when a rare moment of consensus occurs: all three blocks must detect a divergence simultaneously, and an additional short-term price movement must confirm this potential shift in momentum. This strict, multi-layered confirmation process is designed to filter out weak signals and highlight only the most promising opportunities.
The indicator plots clear labels on the chart and can trigger alerts, making it easy to spot these high-conviction setups when they occur

Adaptive Trend & Whale Vol + POCAdaptive Trend & Whale Vol + POC — powerful multi-tool indicator combining adaptive trend, whale volume spikes, RSI divergences, and volume-based POC to enhance trade entries and exits with clear signals and alerts.

Children MACD次级别 MACD 指标,这个和标准的 MACD 指标一样
Secondary MACD indicator, which is the same as the standard MACD indicator

BT Bar - 1.0BTBar – Real-Time Volume and Momentum Insight
BTBar is a custom indicator that highlights candles with abnormal volume spikes and directional movement. It helps identify key institutional activity zones, strong impulses, and potential exhaustion areas. Perfect for traders who rely on context and flow reading rather than fixed patterns.

Dynamic Symmetry Levels [TeamCash]Dynamic Symmetry Levels
The Dynamic Symmetry Levels (DSL) indicator plots key price levels to guide your trading decisions. It uses the daily opening price as a reference, drawing a purple dashed line, and calculates symmetrical support and resistance levels above and below it, shown as white lines with price labels.
How It Works: DSL identifies potential reversal zones where price may react. If the price stays above the daily open, it leans bullish, targeting upper levels; if below, it leans bearish, aiming for lower levels. Levels reset daily for fresh analysis.
Why Use DSL?
Pinpoints high-probability reversal zones for entries and exits.
Enhances any strategy by aligning with your key areas of interest.
Offers clear, labeled visuals for quick and confident trading decisions.
Ideal for traders seeking a simple, effective tool to complement their technical analysis.
OKX:BTCUSD BITSTAMP:ETHUSD

AmazingTrend - Long OnlyUnlock powerful trend-following logic with this dynamic and fully customizable Pine Script™ strategy, designed for traders who want precision entries, adaptive exits, and beautiful chart visuals.
✅ Key Features:
Long Bias by Default – Designed to ride bullish momentum with intelligent entries and flexible exits.
Optional Short Capability – While optimized for longs, the engine is also fully capable of short-side logic with minor adaptation.
Multiple Entry Modes – Choose between:
Classic – Reversals only
Aggressive – Early trend detection
Conservative – Confirmed trend continuation
Momentum – Powered by ATR and price bursts
Exit Customization – Includes:
Classic – Balanced logic
Quick – Tight risk control
Trailing – Dynamic stop tracking
Time-Based – Scheduled profit-taking
Visual Feedback – Multi-layered trend glow, buy/exit highlights, and a clean on-chart info panel.
Commission + Order Size Logic – Simulate realistic brokerage conditions with configurable cost and size inputs.
🔍 Chart Compatibility:
For the best performance, we recommend:
✅ Heikin Ashi and Renko charts for clarity and noise reduction.
✅ Use Regular Candlestick Charts only on higher timeframes (Daily and above) for clean signals.
❌ Avoid lower timeframes 1second to 5minute it is not built for this.
🧠 Smart Trend Detection:
The strategy detects directional bias using smoothed ATR-based stops and automatically shifts between bullish and bearish regimes. Entry and exit logic responds dynamically to market strength, giving you the edge in both volatile and trending environments.
🧪 Strategy Tested:
Built for 100% portfolio allocation per trade
Designed for realistic backtests with slippage and commission settings backtest results on our page is 0.25 % on buy and sell so total 0.50 %
Works across multiple markets: Crypto, Forex, Stocks. (futures coming later)
📈 Ideal For:
for shorters. investors, long traders, i do not recommend scalping ever but thats up to you.
Swing and momentum setups
Renko & Heikin Ashi fans
beware tradingview dont support alerts on Renko charts.
accurate backtest results that reflect reality if you use it exactly as displayed.
🎁 This Invite-Only script includes lifetime updates and is optimized for Pine Script v5. Contact the author to gain access. we will ofc develop this script feel free to use any version you prefer in the future.

Universal 10 MA be @cryptoingenerUniversal Multi MA (10 Moving Averages, Dynamic Colors, Multi-TF, By @CryptoIngener
Short Description (Краткое описание):
Indicator for plotting up to 10 moving averages of any type (SMA, EMA, WMA, HMA, RMA, DEMA, KAMA) on any timeframe, with dynamic coloring and customizable line thickness. Includes a subtle green watermark for copyright.
“This script is provided for educational and informational purposes only.”

RNDMandar_RND This indicator give buy sell signal. Mandar_RND This indicator give buy sell signal Mandar_RND This indicator give buy sell signal Mandar_RND This indicator give buy sell signal Mandar_RND This indicator give buy sell signal Mandar_RND This indicator give buy sell signal Mandar_RND This indicator give buy sell signal Mandar_RND This indicator give buy sell signal Mandar_RND This indicator give buy sell signal Mandar_RND This indicator give buy sell signal Mandar_RND This indicator give buy sell signal


TPI+Ratio Quant Equity (Assets Individually Selectable)measures performance against evenly weighted index of assets using the dots indicator.


Fibonacci Optimal Entry Zone [OTE] (Zeiierman)Bitcoin is breaking out of the symmetrical triangle and showing major signs of strength, so we can expect to hit a new all-time high in the short term! Bitcoin was struggling in the past weeks compared to the stock market, but this should end!
Why do I think that the alt season is starting? To answer this question, we need to look at the BTC.D (Bitcoin dominance chart). if BTC.D goes up, that means money is flowing out of altcoins to Bitcoin, and when BTC.D goes down, that means money is flowing from Bitcoin to altcoins. And we want BTC.D to go up! So what is the chart telling us?

AI Smart Liquidity Signal pro 🚀The "AI Smart Liquidity Signal" indicator is an advanced technical analysis tool designed for traders on TradingView. It aims to identify high-probability trading opportunities by analyzing liquidity dynamics and integrating a comprehensive suite of intelligent filters. This indicator provides precise entry and exit signals, complete with defined take-profit and stop-loss levels, helping traders make informed decisions.
Key Features:
Advanced Liquidity Analysis: The indicator identifies and plots liquidity trendlines based on key pivot points (Pivot High/Low), revealing "liquidity breakouts" that often precede significant price movements. This analysis offers unique insights into hidden supply and demand zones in the market.
Comprehensive Signal Filtering System: To ensure the highest quality signals, the indicator incorporates a robust filtering system, including:
Trend Filters: General and Smart Trend analysis using Moving Averages (SMA, EMA) to determine market strength and direction.
Momentum and Volatility Filters: Utilizing indicators like RSI, MACD, and ATR to assess momentum and price volatility, helping to avoid false signals in choppy markets.
Candle Body Strength Filters: Evaluating the strength of candle bodies to confirm signal validity.
Support & Resistance Filters: Identifying dynamic and retested support and resistance zones, and filtering signals that might be trapped within these areas.
Higher Timeframe Filters: Ability to enable trend filters from higher timeframes (e.g., 30-minute, 1-hour, 4-hour) to ensure signal confluence with larger trends.
Session Filter: Trade only during specific market sessions (Asian, London, New York) to focus trading on the most active periods.
Integrated Risk Management: The indicator provides automatic Take Profit (TP1, TP2, TP3) and Stop Loss (SL) levels based on Average True Range (ATR), helping traders effectively manage their trades and set realistic targets.
Multi-Timeframe (MTF) Scanner: The indicator allows you to monitor buy and sell signals across multiple timeframes simultaneously (from 1-minute to 1-day), providing a holistic market view and helping to identify the best entry opportunities.
Customizable Alerts: Set up instant alerts for buy/sell signals, entry/exit levels, or when price touches support/resistance zones, to stay informed about trading opportunities without constant chart monitoring.
Clear Visual Representation: All signals, trendlines, take-profit/stop-loss levels, and support/resistance zones are clearly and intuitively displayed on the chart, facilitating visual analysis.
How It Works:
The indicator employs a sophisticated algorithm that combines liquidity analysis with signal confirmation through a customizable set of filters. It identifies potential reversal points in the market (pivot points) and draws liquidity trendlines that represent areas of price attraction or rejection. When these lines are broken, an initial signal is generated. This signal then passes through a series of filters (such as RSI, MACD, ATR, trend analysis, support and resistance) to enhance its accuracy and reduce false positives. The final signals are displayed with dynamically calculated take-profit and stop-loss levels.
Why Choose AI Smart Liquidity Signal?
Enhanced Accuracy: Thanks to its multi-layered filtering system, the indicator aims to provide more precise and reliable signals.
Effective Risk Management: Integrated take-profit and stop-loss levels help you protect your capital and maximize profitable trades.
Comprehensive Market View: The multi-timeframe scanner gives you a broad market perspective, helping you identify the strongest trends and opportunities.
User-Friendly: Despite its internal complexity, the indicator is designed to be user-friendly, with clear input options allowing you to customize it to fit your trading style.
Whether you are a novice or an experienced trader, the "AI Smart Liquidity Signal" indicator provides you with the necessary tools to enhance your trading strategy and improve your results.

Strategi FVG 09:31 (Pro)FVG 09:31 Strategy (Pro)
In short, this is an automated trading strategy (bot) for TradingView designed to execute buy or sell orders based on a Fair Value Gap (FVG) pattern. The strategy is highly specific, as it only triggers on the 1-minute timeframe and looks for an FVG that forms precisely at 09:32 AM New York time.
Main Purpose of the Strategy
The primary goal of this script is to identify and capitalize on short-term price imbalances, known as Fair Value Gaps (FVGs). It operates during a specific, high-volatility window right after the U.S. stock market opens, often referred to by traders as the "Silver Bullet" session. By automating the detection and execution, it aims to trade these fleeting opportunities with precision.
How the Strategy Works
The strategy follows a clear, step-by-step logical flow on your chart.
1. Time & Timeframe Restriction
1-Minute Timeframe: The strategy is hard-coded to work only on the 1-minute (1m) chart. A warning label will appear on your chart if you apply it to any other timeframe.
Specific Time Window: The core logic activates only between 09:32 and 09:33 AM New York time. It searches for an FVG pattern formed by the three candles from 09:29, 09:30, and 09:31, with the pattern confirmation happening on the close of the 09:31 candle.
2. Fair Value Gap (FVG) Detection
An FVG is a three-candle pattern that signals a price imbalance.
Bullish FVG (Potential Buy): Occurs when the low of the first candle is higher than the high of the third candle. The space between these two prices is the FVG zone.
Bearish FVG (Potential Sell): Occurs when the high of the first candle is lower than the low of the third candle. The space between these two prices is the FVG zone.
If this pattern is detected at the target time, the strategy draws a colored box on the chart to visualize the FVG zone (aqua for bullish, fuchsia for bearish).
3. Entry Logic
The strategy provides two user-selectable methods for entering a trade:
Retracement (Immediate Entry): The strategy will open a position with a market order as soon as the price retraces back into the identified FVG zone.
For a Bullish FVG, a Long (buy) position is opened when the price drops to touch the upper boundary of the FVG.
For a Bearish FVG, a Short (sell) position is opened when the price rises to touch the lower boundary of the FVG.
Limit Order (Pending Entry): The strategy places a pending limit order at the edge of the FVG zone.
For a Bullish FVG, a Buy Limit order is placed at the upper boundary of the FVG.
For a Bearish FVG, a Sell Limit order is placed at the lower boundary of the FVG.
Order Expiration: If the limit order is not filled within a specified number of candles (default is 15), it is automatically canceled to avoid chasing a stale setup.
4. Exit Logic
Once a position is active, the strategy automatically manages the exit by setting a Take Profit (TP) and Stop Loss (SL) level. You can choose between two types:
Ticks (Fixed Points): You define a fixed profit target and loss limit in ticks (the smallest price movement). For example, a 200-tick TP and a 100-tick SL.
Last Swing (Dynamic Levels): The TP and SL are set dynamically based on the most recent swing high or swing low.
For a Long position: Take Profit is set at the last swing high; Stop Loss is at the last swing low.
For a Short position: Take Profit is set at the last swing low; Stop Loss is at the last swing high.
5. Daily Management
At the start of each new trading day, the script performs a reset. All variables, including any FVG data from the previous day, are cleared. This ensures the strategy only acts on fresh signals from the current day and cancels any pending orders from the day before.
Explanation of Settings (Inputs)
Here is what each user-configurable setting does:
Entry Type: Choose your preferred entry method: Retracement or Limit Order.
Order Expiration (Candles): Applies only to the Limit Order type. Sets how many candles an unfilled order will remain active before being canceled.
Stop Loss Type: Choose Ticks for a fixed-distance stop loss or Last Swing for a dynamic level.
Take Profit Type: Choose Ticks for a fixed-distance profit target or Last Swing for a dynamic level.
Pivot Lookback (SL/TP Swing): Defines how many candles the script looks back to identify the most recent swing high/low for the Last Swing SL/TP type.
Contract Size: The quantity or lot size for each trade.
Take Profit (in Ticks): The profit target distance if using the Ticks type.
Stop Loss (in Ticks): The maximum loss distance if using the Ticks type.

CPR with MAs, Super Trend & VWAP by Manoj Kumar Patidar JiIt's a best way to trading to one simple indicator

StarStrat Ceres Strategy [0.3.1]2025ETH 30M Trend Strategy
Retirement strategies, provided free of charge.

[FREE] Multiple Indicators Screener [NASAlgoTrading] Multiple Indicators Screener indicator is designed to help traders quickly scan multiple cryptocurrencies across different timeframes using a combination of proven technical indicators. It provides a comprehensive, at-a-glance view of market conditions to help identify high-probability trading opportunities.
How It Helps Traders Maximize Profits
✅ Saves Time – No need to switch between charts; all key metrics are displayed in one place.
✅ Confirms Trends – Combines multiple indicators to filter high-probability setups.
✅ Multi-Timeframe Alignment – Finds trades where short-term and long-term trends agree.
✅ Overbought/Oversold Alerts – Helps spot potential reversals using RSI, Stochastic, and TSI.
✅ Trend Strength Validation – ADX and Supertrend confirm whether a trend is worth trading.
Why Use This Script?
✔ Completely Free – No hidden costs or premium upgrades.
✔ Easy to Use – No complex setup; works out of the box.
✔ Customizable – Adjust timeframes, indicators, and assets to fit your strategy.
Best For:
Swing Traders – Identify trends across multiple timeframes.
Day Traders – Quickly scan for intraday opportunities.
Crypto Traders – Optimized for popular cryptocurrency pairs.
Start using this powerful screener today to enhance your trading efficiency and spot the best setups with ease! 🚀

DP_ORB Entry & Exit IndicatorDisclaimer:
This indicator is for educational purposes only. It does not constitute financial advice. Always do your own research and manage your risk. Also, I cannot take full credit for 'ORB' as its a well known strategy amongst many traders, but I do need to give a special shout out to @TheBigDaddyMax for putting me on to this.
DP_ORB Entry & Exit Indicator
Description:
The DP_ORB Entry & Exit Indicator is a powerful tool designed for traders who utilize the Opening Range Breakout (ORB) strategy on the NYSE session. This indicator visually identifies the initial volatility window of the trading day, by marking the 15m High, and 15m Low into a ORB Box, & then tracks breakout opportunities, and provides clear, dynamic trade management levels—all directly on your chart.
Key Features:
Automatic Opening Range (ORB) Box:
Identifies and plots the high and low of the user-defined opening range (default 9:30–9:45 NYSE) for visual reference and strategy foundation.
Breakout Entry Signals:
Automatically detects and marks long or short breakout entries when price closes above or below the ORB range, with additional momentum confirmation.
Dynamic Stop Loss:
Stop loss is intelligently set to the previous bar’s low for long trades (or high for shorts), adapting to market structure at entry.
Take Profit Targets:
Up to three fully adjustable take-profit levels are plotted, calculated as percentages from entry, supporting progressive trade management.
Visual Trade Management:
Entry, stop loss, and take profit levels are displayed as extending dashed lines from entry point to the current bar, with labels always shown just to the right of price for clarity on all timeframes.
Automatic Reset and Cleanup:
Visuals and logic reset daily and upon exit, ensuring a clean, uncluttered chart experience.
How to Use:
Set your preferred opening range time and take profit levels in the settings.
Wait for a breakout and confirmation during the NYSE session.
Use the on-chart lines and labels to manage your trade according to your risk and strategy plan.
Best For:
Day traders and scalpers seeking a disciplined, visual, and fully-automated approach to opening range breakout trading.
