Session Stats + (dc_77)The "Session Stats + (dc_77)" indicator is a Pine Script tool designed to analyze trading sessions by plotting key price levels and statistical metrics. It displays a session's open price, manipulation levels (mean and median price movements), and distribution levels based on historical session data, with customizable time zones and session times. Users can toggle projections for 1-hour, 4-hour, daily, weekly, and monthly timeframes, showing average manipulation and distribution distances from the session open. Visual elements like shaded areas, labeled lines, and a vertical anchor line enhance readability, with options to filter data by day of the week. Alert conditions are included to notify users when the price crosses significant levels, such as the session open or manipulation/distribution thresholds.
Chart patterns

XAU/USD Scalping Bot [Jake-Style 1500+] FINALDescription:
This advanced scalping bot is engineered for XAU/USD using Jake-style visual overlays with predictive trade triggers, early entry signals, and multi-layer confirmation tools.
Key Features:
• EMA Cloud System with color-coded directional bias (5/13/21/55/144/377)
• PSAR Flip-Only Dots to highlight trend reversal moments without chart clutter
• Bollinger Band Zones to visualize volatility channels
• Predictive Entry Flags for early buy/sell signals before momentum candles (≥2 pip move)
• TRUE Candle Logic for confirmed trend-following entries
• Multi-Level TP/SL Lines with real-time alerts:
• TP1 / TP2 / TP3 with precise trigger logic
• Stop Loss hit detection
• Red Flag Warnings for exit caution during reversal zones (overbought TDI / failed breakouts)
Optimized For:
• 1m / 3m / 5m / 15m / 30m timeframes
• Scalping & intraday trading with high-precision entries
• Traders who prefer visual confirmation before committing to entries
Created by: @Livingstonedan
Powered by: ChatGPT x Jake-style automation logic

RSI Phan Ky FullThe RSI divergence indicator is like a magnifying glass that spots gaps between price swings and momentum. When price keeps climbing but RSI quietly sags, it’s a flashing U‑turn sign: the bulls are winded, and the bears are lacing up their boots. Flip it around—price is sliding yet RSI edges higher—and you’ve got bulls secretly stockpiling. Hidden divergences shore up the trend; regular divergences hint at a pivot. Blend those signals with overbought/oversold zones, support‑resistance, and volume, and RSI divergence turns into a radar that helps traders jump in with swagger and bail out just in time.

Candle Wick Analysis🔍 What This Indicator Does
The Candle Wick Analysis indicator dynamically colors each candle body based on the comparative strength of its wicks and body, helping traders visually assess market sentiment, rejection zones, and momentum exhaustion with higher clarity.
This tool is especially useful for:
Price action traders
Scalpers
Reversal and trend continuation traders
Anyone who uses candlestick structure for confirmations
📊 How It Works
The indicator analyzes each candle and compares the percentage change of the upper wick, body, and lower wick relative to the opening price. Based on this relationship, it assigns a green or red color to the candle body to indicate likely price strength or weakness.
🧠 Logic Breakdown
✅ If the Candle is Bullish (close > open):
🔵 Green Candle Body: If the upper wick is smaller than the combined percentage size of the body + lower wick
→ Indicates strong bullish momentum with low upper rejection.
🔴 Red Candle Body: If the upper wick is larger than body + lower wick
→ Suggests potential exhaustion or rejection at the top.
✅ If the Candle is Bearish (close < open):
🔴 Red Candle Body: If the lower wick is smaller than the combined percentage size of the body + upper wick
→ Indicates strong bearish momentum with low lower support.
🟢 Green Candle Body: If the lower wick is larger than body + upper wick
→ Suggests potential downside rejection or support zone bounce.
⚪ Neutral Candles:
If the candle does not meet any specific wick/body criteria, it is displayed in gray to indicate neutrality or indecision (such as a doji).
🛠️ Technical Highlights
Built in Pine Script v5
Uses precise percentage-based wick/body comparison
Works on any timeframe and instrument
Minimalist coloring style: only the body color changes, while wicks stay gray
💡 Use Cases
Quickly spot exhaustion candles, where strong wicks may indicate a reversal or trap.
Validate trend strength: strong candles are colored green, weak ones red, even within bullish or bearish structures.
Filter entries and exits using visual confirmation of wick-to-body dynamics.
📌 Notes
This is a visual tool, not a buy/sell signal indicator.
Best used in conjunction with other forms of analysis (support/resistance, volume, moving averages, etc.)
Can be enhanced with alerts, filters (e.g., volume spikes), or labeling based on user feedback.

Zen FDAX Session📝 Description
OVERVIEW
The Zen FDAX Session indicator highlights periods outside the regular trading hours of the FDAX (DAX Futures) on the Xetra exchange. It shades the chart background during non-trading hours, aiding traders in distinguishing active market periods from inactive ones.
FUNCTIONALITY
Customizable Trading Hours: Users can define the session's start and end times in UTC, allowing flexibility to match personal trading schedules or account for daylight saving changes.
Visual Clarity: The indicator applies a subtle background color to non-trading hours, ensuring clear demarcation without obscuring price data.
Time Zone Awareness: Designed with UTC inputs to maintain consistency across different user time zones.
USAGE
Add the Indicator: Apply the "Zen FDAX Session" indicator to your chart.
Set Trading Hours: Input your desired session start and end times in UTC.
Interpret the Shading: Areas with shaded backgrounds represent times outside your defined trading session.
Note: This indicator does not generate buy/sell signals but serves as a visual aid to identify trading sessions.

Balanced Price Range | Flux Charts💎 GENERAL OVERVIEW
Introducing our new Balanced Price Range (BPR) indicator! A Balanced Price Range is a trading concept used by price action traders. It is detected by finding overlapping area between two contrary Fair Value Gaps (FVGs). These areas can be used as entry points during market pullbacks. For more information about the process, please check the "HOW DOES IT WORK ?" section.
Balanced Price Range Features :
Balanced Price Range Detection : Identifies areas where bullish and bearish FVGs overlap, suggesting a zone of price equilibrium.
Customizable FVG & BPR Detection : You can fine-tune FVG detection and sensitivity for BPR detection to your liking.
Retest Labels : Bullish & Bearish retest labels will be rendered for BPRs.
Alerts : You can set alerts for Bullish & Bearish BPR detection and their retests.
🚩 UNIQUENESS
This indicator doesn't just detect standard FVGs but specifically looks for areas where bullish and bearish IFVGs (Invalidated Fair Value Gaps) overlap, defining a Balanced Price Range. It also actively manages and updates identified BPR zones, removing them when they are invalidated or remain untouched for a specified period. It highlights and alerts users to retests of established BPR zones, signaling potential trading opportunities. Users can tailor the appearance of the BPR zones and retest markers, as well as configure specific alerts for new BPR formations and retests.
📌 HOW DOES IT WORK ?
A Fair Value Gap generally occur when there is an imbalance in the market. They can be detected by specific formations within the chart. The indicator first detects bullish & bearish FVG zones according to their formations on chart. Then, they are dynamically tracked and flagged as invalidated if the price crosses them, turning them into IFVGs. When a FVG & IFVG of the same type overlaps, the indicator combines them into a single BPR of corresponding type. The detected BPR is updated as new data comes in, and renders retests labels as they occur. A bullish BPR can be used to find long trade entry opportunities, while a bearish BPR can be used to find short trade entry opportunities. Retests can also indicate potential movements in the corresponding direction of the BPR. Users can set-up alerts for BPR detection & BPR retests and will get notified as they occur.
⚙️ SETTINGS
Show Historic Zones: If enabled, invalidated or expired BPR zones will remain visible on the chart.
Balanced Price Range:
FVG Detection Method: Determines the criteria for the bar types forming the initial FVG.
Same: All three bars forming the FVG must be of the same type (all bullish or all bearish).
Mixed: The bar types must vary (a mix of bullish and bearish bars).
All: Bar types can vary or be the same.
FVG Invalidation Method: Determines which part of the candle (wick or close) invalidates the initial FVG.
BPR Invalidation Method: Determines which part of the candle (wick or close) invalidates the Balanced Price Range.
Sensitivity: Adjusts the sensitivity of FVG detection. Higher values may identify fewer, larger BPRs, while lower values may detect more, smaller BPRs.
Labels: Toggles the display of text labels on the identified zones.
Retests: Enables or disables the detection and visualization of BPR retests.

Ai BTC Signals Buy & Whales / Liquidation - Strategy [Ai Whales]Dear Trader,
The development involved professional analysts and incorporated AI to adapt signals to the modern, constantly changing, and highly volatile BTCUSD market, also taking into account the presence and actions of large institutional players — the so-called "Whales." The strategy allows you to instantly evaluate any configuration you set within the indicator and see the results reflected in professional performance metrics aligned with your chosen strategy.
The indicator displays several signals on the chart:
1) Buy signal (not sell signals)
2) Take profit line and price
3) Stop loss line and price
4) Manipulations & Liquidations observed in the market
5) Whale activity—buying in small, medium, and large amounts
The indicator does not repaint because it is based on showing signals only after the candle closes, so the calculations are true and not distorted.
Recommended pair: BTCUSD ; BTCUSDT ; BTCUSDTP and same.
The indicator can show R/R - 0.5:1 1:1 1:2 1:3 1:4
Recommended timeframes for use: from 4 hours up to 1 week, with the ideal being 1 day. However, you are free to experiment with other near timeframes.
Possible trading modes: spot or futures.
Some methods used in the calculations of the indicator:
- statistical patterns that have the ability to repeat in the future. Bitcoin cycles in different market phases that also have the ability to repeat and are included in the indicator,
- miners' capitulation and hashrate level are also taken into account by the indicator,
- candle volumes and their deltas are taken into account in the calculations,
- as well as other bases such as RSI and its divergence, the crossing of EMA of various configurations and etc.
**How the strategy calculates positions:**
A position opens at the Buy signal level and is fixed at the level of the thick green line, which serves as the primary take profit target. Pyramiding (adding to positions) can be enabled in the settings.
The size of each position is adjustable via the settings. Importantly, each signal creates its own take profit lines. When pyramiding is enabled, all positions are eventually closed at the nearest take profit level generated by any of the pyramiding signals. This approach minimizes potential losses if the price doesn’t reach the maximum take profit levels initially set; the strategy closes positions at the closest available take profit level. This conservative method for strategy reduces risk, although ideally, each position in the pyramid should be closed at an individual take-profit level, which would lead to even better results during deep backtesting.
The strategy includes alerts that can be configured based on your platform’s capabilities. Alerts trigger on the chart when "Buy" or "Whale" signals are detected.
**Settings Overview:**
- Inside the strategy: default platform options.
- Inside the indicato have some filters:
1) allows traders to choose display modes
2) position entries based on market phase—rising or falling
3) can also select whether to trade after manipulations and liquidations
4) can also select whether to trade after whale activity (small medium or big amounts of whales).
You can manually adjust take profit and stop loss levels via simple method selections, making these flexible yet user-friendly. The indicator offers three main styles:
- "Universal" (standard levels)
- "Aggressive"
- "Conservative"
**Performance and caveats:**
Deep Backtested from day one of Bitcoin’s listing on various exchanges under specific conditions (no liquidations, certain settings), the indicator has shown a maximum drawdown of about 5-15%, with final returns surpassing "buy and hold" more than 1000000% and WinRate 93-100% However, it’s crucial to understand that such spectacular past performance does not guarantee future results.
If you are serious about your investments, remember that geopolitical events, institutional shifts, or other unforeseen factors can significantly impact Bitcoin’s price—or even its existence. Unfortunately, AI has not yet learned to fully account for these macro conditions within its adaptive mechanisms.
Trade wisely, and use this powerful tool responsibly.
Best regards,

Gartley 222 Strategy (Final Full Version)Gartley 222 Strategy (Bullish Pattern) — Repaint-Free, Backtestable
This strategy is based on the classic Gartley 222 harmonic pattern, originally introduced by H.M. Gartley in Profits in the Stock Market (1935). It identifies potential bullish reversal zones by detecting a five-point retracement structure (X-A-B-C-D) using pivot points and Fibonacci confluence.
🧠 Strategy Logic:
Detects valid pivot-based X, A, B, C points
Validates Gartley ratios:
AB = 61.8%–78.6% of XA
CD = 78.6%–88.6% of AB
Enters long at point D only after pivot confirmation (non-repainting)
Exits at 127% Fibonacci extension of XA or on stop loss
🔍 Features:
✅ Repaint-free and fully backtestable
✅ Visual X–A–B–C–D pattern lines on chart
✅ Customizable pivot length, risk, and reward ratios
✅ Alerts for real-time Gartley Buy pattern completion
Ideal for swing traders using 4H or Daily timeframes on trending instruments like NIFTY, BANKNIFTY, or major stocks.
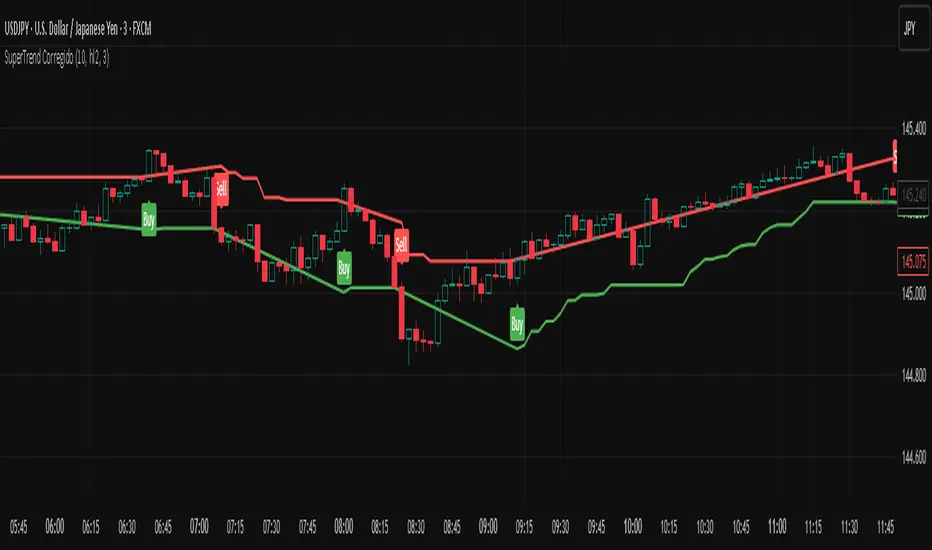
SuperTrend CorregidoThis script implements a SuperTrend indicator based on the Average True Range (ATR). It is designed to help traders identify trend direction and potential buy/sell opportunities with visual signals on the chart.
🔧 Key Features:
ATR-Based Trend Detection: Calculates trend shifts using the ATR and a user-defined multiplier.
Buy/Sell Signals: Displays "Buy" and "Sell" labels directly on the chart when the trend changes direction.
Visual Trend Lines: Plots green (uptrend) and red (downtrend) SuperTrend lines to highlight the current market bias.
Trend Highlighting: Optionally fills the background to emphasize whether the market is in an uptrend or downtrend.
Customizable Settings:
ATR period and multiplier
Option to switch ATR calculation method
Toggle for signal visibility and trend highlighting
🔔 Alerts Included:
SuperTrend Buy Signal
SuperTrend Sell Signal
SuperTrend Direction Change
This indicator is useful for identifying entries and exits based on trend momentum and can be used across various timeframes.
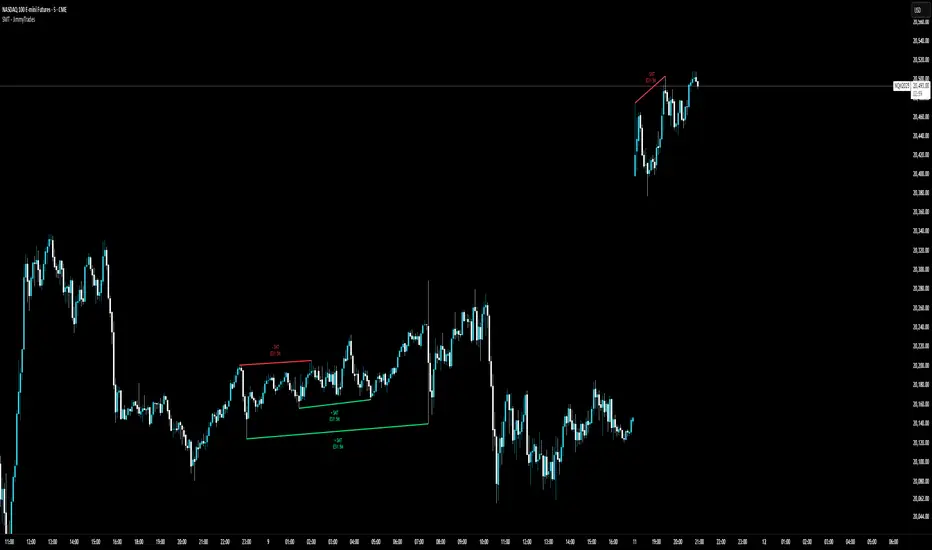
SMT - JimmyTrades🔧 SMT – JimmyTrades: Publication Rules and User Guide
📌 What This Script Does
This script detects Smart Money Traps (SMT) Divergences between the instrument on your chart and a comparative symbol (default: ES). It automatically plots both confirmed and unconfirmed bullish and bearish SMT setups across multiple timeframes.
These SMT divergences can help traders:
Identify potential reversal points
Confirm high-probability entries in line with smart money behavior
Enhance bias when confluence aligns with other market structure or liquidity factors
⚙️ Important Settings
Please make sure you correctly configure the following inputs:
Symbol: The comparative asset to check divergence against. Common examples: ES, NQ, SPX.
Session Type: Ensure this matches your chart’s session setting: Extended or Regular.
Adjustment Type: Match this to your chart (None, Dividends, or Splits) under TradingView’s chart settings (bottom-right corner).
Pivot Lookback: Controls the sensitivity of divergence detection (default is 15). Higher values reduce signal frequency.
Timeframes: You can enable up to six timeframes independently for SMT scanning.
🟢 Bullish SMT Signals
Bullish SMTs are identified when price on your chart makes a lower low, but the comparative symbol (e.g., ES) does not, suggesting potential accumulation or trap liquidity.
🔴 Bearish SMT Signals
Bearish SMTs are flagged when your chart makes a higher high, while the comparative symbol fails to do so, hinting at distribution or a stop run setup.
📈 How to Use This Script
Add the indicator to your chart.
Set the correct comparative symbol (e.g., ES for NQ, SPX for SPY, etc.).
Choose your preferred timeframes.
Watch for unconfirmed SMTs (dotted lines) as potential early warnings.
Look for confirmed SMTs (solid lines) once price respects the divergence zone for several bars.
Combine with structure, liquidity sweeps, killzones, and high-impact news for higher confluence.
🧠 Best Practices
Use SMT signals as part of a broader trade plan—not standalone entries.
Focus on SMTs forming after liquidity sweeps or during session opens (London/NY).
Combine with your higher-timeframe bias, breaker blocks, or Pegasus/Unicorn entry models.
⚠️ Limitations
Historical backtest may show perfect SMTs—real-time confirmation requires patience.
SMTs may not play out without proper context—avoid blindly entering based on signal alone.
This script is not financial advice—use at your own discretion and always manage risk.
MNQ-MES Hedge Protection Calculator by ATALLAMNQ-MES Hedge Protection Calculator - Summary
Purpose
This indicator provides real-time calculations for implementing a hedge strategy between MNQ (Micro E-mini Nasdaq-100) and MES (Micro E-mini S&P 500) futures contracts. It automatically determines the precise number of MES contracts needed to hedge a position in MNQ, based on current market prices and contract specifications.
Key Features
Real-time Hedge Ratio Calculation
Uses live market prices to calculate the optimal hedge ratio
Accounts for different point values ($2 for MNQ, $5 for MES)
Adjusts for beta differences between Nasdaq-100 and S&P 500
Flexible Position Management
Works for both long and short positions
Supports fractional contract amounts
Allows partial hedging (adjustable percentage)
User-Friendly Visual Interface
Clearly displays the exact number of MES contracts needed
Color-coded table showing position direction
Optional chart label with hedge summary
Practical Applications
Directional Risk Reduction: Maintain market exposure while reducing directional risk
Index Spread Trading: Capitalize on relative performance differences between indices
Portfolio Protection: Hedge existing positions in technology-heavy portfolios
Volatility Management: Reduce overall portfolio volatility while maintaining desired exposure
This indicator eliminates the complexity of manually calculating hedge ratios by providing instant, accurate, and visually clear instructions on how to implement an MNQ-MES hedge strategy based on current market conditions.

Higher Timeframe Candles (Dynamic Display)Key Features:
1. Higher Timeframe Candles Visualization:
Displays up to 5 candles from a user-selected higher timeframe (e.g., 15-minute, hourly).
Each candle includes:
Body (open-close range) and wicks (high-low range).
Customizable appearance settings for width, colors, and transparency.
2. Horizontal Price Levels:
Calculates and plots important levels based on the higher timeframe candles:
Max High: Highest price among the displayed candles.
Min Low: Lowest price among the displayed candles.
Midpoint: The midpoint between Max High and Min Low.
Quarter Points: 25% and 75% levels within the Max-Min range.
Each level's line appearance (color, width, style) can be customized, and price labels can be displayed.
3. Fair Value Gaps (FVG):
Detects bullish and bearish fair value gaps (FVGs) based on three consecutive candles:
Bullish FVG: Middle candle's low is higher than the previous candle's high.
Bearish FVG: Middle candle's high is lower than the previous candle's low.
Highlights FVGs with colored boxes and optional labels showing gap height.
4. Inside/Outside Bar Detection:
Identifies inside bars (current candle is entirely within the previous candle) and outside bars (current candle exceeds the previous candle's range).
Labels these patterns above the candles for easy identification.
5. Alerts for Key Levels:
Alerts are triggered when the current price crosses:
Max High
Min Low
Midpoint
Alerts help traders act without monitoring the chart constantly.
6. Customization Options:
Fully customizable input options for candles, levels, FVGs, and labels:
Appearance settings: Colors, widths, styles, transparency.
Toggle visibility for specific features (e.g., FVGs, labels, quarter points).
Label precision and positioning.

Multi-Index Gap Confluence Indicator by ATALLAOverview of the Multi-Index Gap Confluence Indicator
This indicator is designed to identify and highlight price gaps across multiple market indices and their related ETFs/futures. It specifically looks for:
True gaps (where there's no overlap between the current and previous bar's range)
Negative gaps (where only the candle bodies have no overlap, but wicks might)
The indicator has the capability to:
Visualize gaps on charts using colored rectangles
Compare gaps across up to 6 different symbols (3 ETFs and 3 futures)
Generate confluence signals when multiple symbols show gaps simultaneously
Customize appearance and detection parameters
Key Components
Gap Detection
The script distinguishes between:
True gaps: No overlap at all between current and previous bars
Negative gaps: Only the candle bodies have no overlap
Multi-Asset Comparison
The indicator can monitor gaps across six major market indices:
ETFs: QQQ (Nasdaq-100), SPY (S&P 500), and DIA (Dow Jones)
Futures: NQ1! (Nasdaq-100), ES1! (S&P 500), and YM1! (Dow Jones)
Confluence Detection
The script identifies when multiple assets display gaps simultaneously, with:
Configurable minimum threshold (default is 5 out of 6 assets)
Option to require both ETF and futures representation
A strong confluence signal when 5-6 assets show gaps
Customization Options
The indicator offers many parameters for customization:
Gap colors and opacity
Symbol selection and enablement
Confluence thresholds
Display options
Visual Elements
The indicator displays:
Colored rectangles highlighting gap areas
Optional up/down triangles for gap direction
A flag symbol for strong confluence signals (when 5-6 assets show gaps)
Labels listing which specific assets have gaps
Practical Use
This indicator appears designed for traders looking to identify potentially significant market moves by spotting when multiple major indices show price gaps simultaneously. The emphasis on "strong confluence" (5-6 assets showing gaps) suggests these are considered particularly noteworthy signals.

Hybrid: RSI + Breakout + DashboardHybrid RSI + Breakout Strategy
Adaptive trading system that switches modes based on market regime:
Ranging: Buys when RSI < 30 and sells when RSI > 70.
Trending: Enters momentum breakouts only in the direction of the 200-EMA bias, with ADX confirming trend strength.
Risk Management: Trailing stop locks profits and caps drawdown.
Optimized for BTC, ETH, and SOL on 1 h–1 D charts; back-tested from 2017 onward. Educational use only—run your own tests before deploying live funds.

NQ-QQQ NEGATIVE GAP Confluence Indicator by ATALLANQ-QQQ NEGATIVE GAP Confluence Indicator by ATALLA
Summary
This indicator specializes in detecting and highlighting when both QQQ (Nasdaq-100 ETF) and NQ (Nasdaq futures) simultaneously exhibit negative gaps. A negative gap occurs when the bodies of two consecutive candles don't overlap, though the wicks may occupy the space between them.
The indicator features:
Dual Market Analysis: Monitors both QQQ and NQ simultaneously for negative gaps
Clear Visual Signals: Displays blue circles below candles when both instruments show negative gaps at the same time
Color-Coded Gap Visualization: Highlights negative gaps in blue and true gaps in yellow for easy identification
Confluence Detection: The blue circle symbol indicates trading opportunities with higher probability due to the alignment between the ETF and futures markets
Customizable Settings: Allows users to adjust gap detection sensitivity, colors, and comparison options
This tool is particularly valuable for traders who follow Nasdaq markets, as it identifies moments when both the ETF and futures markets show the same technical pattern simultaneously, potentially signaling stronger trading opportunities

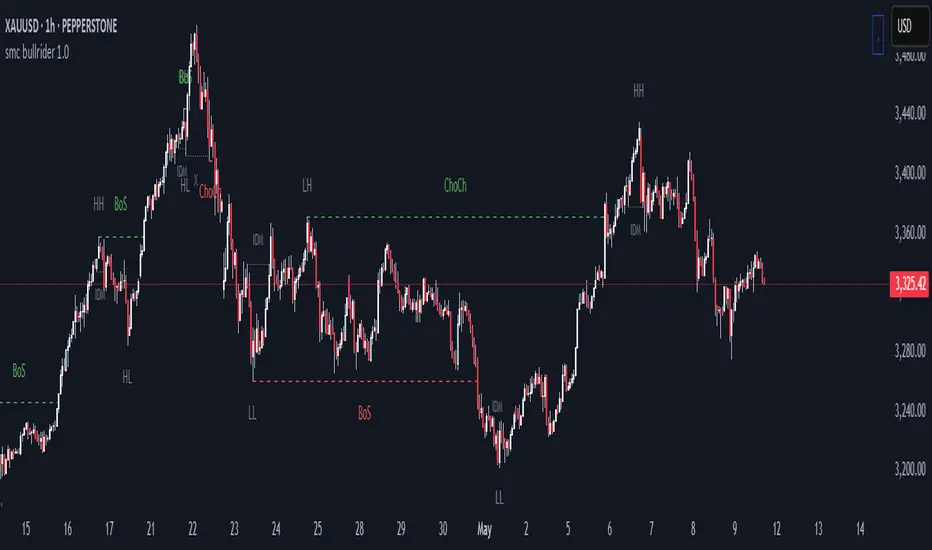
smc bullrider 1.0The smc bullrider 1.0 indicator is specifically crafted for mapping market structures. It excels in clearly recognizing type of Points Of Interest (SCOB) offering traders a straightforward and effective method to analyze market movements. It helps identify strategic entry points with precision.
🟠 Exploring Structure Mapping.
🔹This indicator presents a distinctive method for examining the market structure, emphasizing liquidity through the concept of 'Inducement'. Inducement plays a pivotal role in pinpointing essential structural indicators in the market, including Higher Highs (HH), Higher Lows (HL), Lower Lows (LL), and Lower Highs (LH).
🔹Consider Inducement as a strategically placed trap near supply or demand zones. It lures in eager buyers or sellers before the actual zone is reached, effectively creating liquidity. To validate an inducement, it must signify a legitimate pullback.
🔹A valid scenario arises when the price either sweeps or closes beyond the high or low of the preceding candle. In this context, the candle's color, whether bullish or bearish, holds no significance, and both situations are deemed valid. Inside bars are disregarded unless they meet this specific criterion. The indicator facilitates this process by automatically highlighting valid pullbacks with a distinctive gray round label.
🔹This feature serves not only as a visual guide but also as a vital tool for effortlessly comprehending market movements, offering a clear and visual representation of ongoing market trends
🟣 Understanding POI Functionality
🔹Single Candle Order Block (SCOB): Leveraging single-candle mitigation proves to be a powerful method for incorporating multiple entries into your successful trades.
🔵 How to Utilize the smc bullrider 1.0 Indicator:
🔹The smc bullrider 1.0 Indicator is crafted to elevate your trading strategy by pinpointing crucial order blocks and market signals. Below is a guide on how to make the most of the different components of the smc bullrider 1.0 Indicator:
🔹SCOB (Single Candle Order Block):
Application: SCOB is well-suited for scaling into a position. It is best utilized to increase positions when the market responds to OB or OB-EXT, signaling a potential reversal.
🟢Here's how to use it.
🔹Market Structure Drawing
This diagram depicts significant market indicators, such as instances of ascending prices (Higher Highs - HH) or descending prices (Lower Lows - LL). It serves as a valuable visual tool for comprehending the dynamics of market behavior
PICTURE (DIAGRAM)
Live Chart Example: Our indicator efficiently dissects market structure, showcasing the 'Inducement' concept with precision in real-time trends—highlighting HH, HL, LL, and LH
PICTURE (REAL CHART)
Valid Pullback ( IDM ):
Valid Pullback Example: This image illustrates a common situation where the price extends beyond the high or low of the preceding candle, signifying a valid pullback. Pay attention to the identifiable gray dotted line label marking the inducement point.
PICTURE (DRAW/REAL)
Single Candle Order Block (SCOB)
The provided chart showcases the SCOB in a real trading setting, highlighting its effectiveness in optimizing trades.
🟡 Summary
🔹smc bullrider 1.0 Indicator distinguishes itself in the realm of market analysis, with a distinct focus on structure mapping and high-probability Point of Interest (POI).
Furthermore, it provides a visual representation of three key areas for each market move: discount, premium, and the equilibrium area at 50%. Its innovative approach involves scrutinizing market structure using the 'Inducement' concept, a pivotal strategy for identifying vital structural markers and steering
Stochastic RSI with MTF TableShort Description of the Script
The provided Pine Script indicator, titled "Stochastic RSI with MTF Table," calculates and displays the Stochastic RSI for the current timeframe and multiple other timeframes (5m, 15m, 30m, 60m, 240m, and daily). The Stochastic RSI is a momentum indicator that blends the Relative Strength Index (RSI) and Stochastic Oscillator to identify overbought and oversold conditions, as well as potential trend reversals via K and D line crossovers.
Key features of the script include:
Inputs: Customizable parameters such as K smoothing (default 3), D smoothing (default 3), RSI length (default 14), Stochastic length (default 14), source price (default close), and overbought/oversold levels (default 80/20).
MTF Table: A table displays the Stochastic RSI status for each timeframe:
"OB" (overbought) if K > 80, "OS" (oversold) if K < 20, or "N" (neutral) otherwise.
Crossovers: "K↑D" for bullish (K crosses above D) and "K↓D" for bearish (K crosses below D).
Visualization: Plots the K and D lines for the current timeframe, with horizontal lines at 80 (overbought), 50 (middle), and 20 (oversold), plus a background fill for clarity.
Table Position: Configurable to appear in one of four chart corners (default: top-right).
This indicator helps traders assess momentum across multiple timeframes simultaneously, aiding in the identification of trend strength and potential entry/exit points.
Trading Strategy with 50EMA and 200EMA for Highest Winning Rate
To create a strategy with the best probability of a high winning rate using the Stochastic RSI MTF indicator alongside the 50-period Exponential Moving Average (50EMA) and 200-period Exponential Moving Average (200EMA), we can combine trend identification with momentum-based entry timing. The 50EMA and 200EMA are widely used to determine medium- and long-term trends, while the Stochastic RSI MTF table provides multi-timeframe momentum signals. Here’s the strategy:
1. Determine the Overall Trend
Bullish Trend: The 50EMA is above the 200EMA on the current timeframe (e.g., daily or 60m chart). This suggests an uptrend, often associated with a "Golden Cross."
Bearish Trend: The 50EMA is below the 200EMA on the current timeframe. This indicates a downtrend, often linked to a "Death Cross."
Implementation: Plot the 50EMA and 200EMA on your chart and visually confirm their relative positions.
2. Identify Entry Signals Using the Stochastic RSI MTF Table
In a Bullish Trend (50EMA > 200EMA):
Look for timeframes in the MTF table showing:
Oversold (OS): K < 20, indicating a potential pullback in the uptrend where price may rebound.
Bullish Crossover (K↑D): K crosses above D, signaling rising momentum and a potential entry point.
Example: If the 60m and 240m timeframes show "OS" or "K↑D," this could be a buy signal.
In a Bearish Trend (50EMA < 200EMA):
Look for timeframes in the MTF table showing:
Overbought (OB): K > 80, suggesting a rally in the downtrend where price may reverse downward.
Bearish Crossover (K↓D): K crosses below D, indicating declining momentum and a potential short entry.
Example: If the 30m and daily timeframes show "OB" or "K↓D," this could be a sell/short signal.
Current Timeframe Check: Use the plotted K and D lines on your trading timeframe for precise entry timing (e.g., confirm a K↑D crossover on a 60m chart for a long trade).
3. Confirm Signals Across Multiple Timeframes
Strengthen the Signal: A higher winning rate is more likely when multiple timeframes align with the trend and signal. For instance:
Bullish trend + "OS" or "K↑D" on 60m, 240m, and daily = strong buy signal.
Bearish trend + "OB" or "K↓D" on 15m, 60m, and 240m = strong sell signal.
Prioritize Higher Timeframes: Signals from the 240m or daily timeframe carry more weight due to their indication of broader trends, increasing reliability.
4. Set Stop-Loss and Take-Profit Levels
Long Trades (Bullish):
Stop-Loss: Place below the most recent swing low or below the 50EMA, whichever is closer, to protect against trend reversals.
Take-Profit: Target a key resistance level or use a risk-reward ratio (e.g., 2:1 or 3:1) based on the stop-loss distance.
Short Trades (Bearish):
Stop-Loss: Place above the most recent swing high or above the 50EMA, whichever is closer.
Take-Profit: Target a key support level or apply a similar risk-reward ratio.
Trailing Stop Option: As the trend progresses, trail the stop below the 50EMA (for longs) or above it (for shorts) to lock in profits.
5. Risk Management
Position Sizing: Risk no more than 1-2% of your trading capital per trade to minimize losses from false signals.
Volatility Consideration: Adjust stop-loss distances and position sizes based on the asset’s volatility (e.g., wider stops for volatile stocks or crypto).
Avoid Overtrading: Wait for clear alignment between the EMA trend and MTF signals to avoid low-probability setups.
Example Scenario
Chart: 60-minute timeframe.
Trend: 50EMA > 200EMA (bullish).
MTF Table: 60m shows "OS," 240m shows "K↑D," and daily is "N."
Action: Enter a long position when the 60m K line crosses above D, confirming the table signal.
Stop-Loss: Below the recent 60m swing low (e.g., 2% below entry).
Take-Profit: At the next resistance level or a 3:1 reward-to-risk ratio.
Outcome: High probability of success due to trend alignment and multi-timeframe confirmation.
Why This Strategy Works
Trend Following: Trading in the direction of the 50EMA/200EMA trend reduces the risk of fighting the market’s momentum.
Momentum Timing: The Stochastic RSI MTF table pinpoints pullbacks or reversals within the trend, improving entry timing.
Multi-Timeframe Confirmation: Alignment across timeframes filters out noise, increasing the win rate.
Risk Control: Defined stop-loss and position sizing protect against inevitable losses.
Caveats
No strategy guarantees a 100% win rate; false signals can occur, especially in choppy markets.
Test this strategy on historical data or a demo account to verify its effectiveness for your asset and timeframe.
This approach leverages the strengths of both trend-following (EMA) and momentum (Stochastic RSI) tools, aiming for a high-probability, disciplined trading system.

AMA Alpha TrendKey Features
4 EMAs (20, 50, 100, 200) plotted in distinct colors
ATR-based Trend Line
Uses mid-price (HL/2) ± ATR × Multiplier
Automatically “steps” higher in up-trends and lower in down-trends
Colored green when bullish, red when bearish
Breakout Triangles
▲ Green triangle when price closes above the trend line → potential long entry
▼ Red triangle when price closes below the trend line → potential short entry
Continuation Dots
● Green dot under every bar that remains above the trend line (bullish continuation)
● Red dot above every bar that remains below the trend line (bearish continuation)
Inputs & Customization
ATR Length: look-back period for True Range (default 14)
ATR Multiplier: channel width factor (default 2.0)
EMA Periods: hard-coded to 20, 50, 100, 200 but can be modified in code
How to Use
Trend Identification
When the trend line turns green, the market is bullish.
When it turns red, the market is bearish.
Entries
Long: look for a ▲ green triangle (price crossing above the green trend line).
Short: look for a ▼ red triangle (price crossing below the red trend line).
Trend Following
Hold as long as continuation dots (●) keep appearing in the trend direction.
Exits & Stops
Consider exiting when the opposite breakout triangle appears.
Place stops just beyond the trend line or a multiple of ATR.
Why This Works
Combining multiple EMAs with a dynamically-sized ATR channel captures both the direction and strength of a move. Breakout triangles mark fresh trend initiations, while the tiny dots confirm that momentum is still intact.
Tip: Experiment with the ATR multiplier on different timeframes—lower values for tighter, more sensitive signals; higher for filtering out noise.

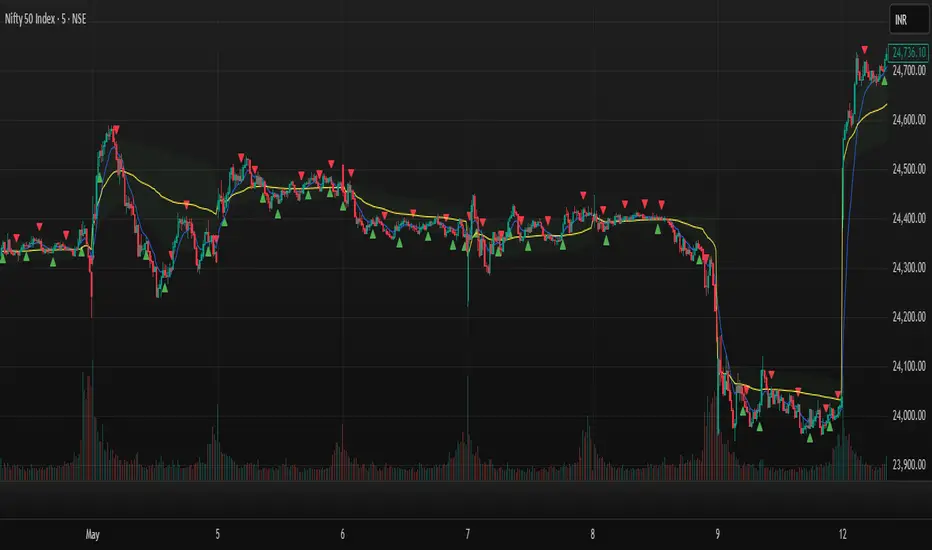
BB Vicinity Reversal SignalsThis indicator detects potential intraday reversal opportunities based on price action near the outer edges of Bollinger Bands (±2.7 std dev). Unlike traditional Bollinger Band signals that require strict band touches or crossings, this tool identifies reversals that occur in the vicinity of the outer bands, increasing signal frequency while maintaining logical precision.
✅ Key Features:
Buy Signal: Triggered when a bullish candle with a strong body forms near the lower Bollinger Band.
Sell Signal: Triggered when a bearish candle with a strong body forms near the upper Bollinger Band.
Vicinity logic: User-adjustable % range from the outer bands (default: 20%) to define how close price must be.
Body-to-candle ratio filter: Ensures that only meaningful directional candles trigger signals.
No repainting: All signals are generated in real-time based on confirmed candle closes.
Built-in alerts: Receive instant notifications for buy and sell setups.
This tool is ideal for traders looking to capture high-probability mean-reversion trades without being overly restrictive. It works well on intraday timeframes like 5m, 15m, and 1h.

Bollinger Volatility AnalyzerThe Bollinger Volatility Analyzer (BVA) is a powerful enhancement of the traditional Bollinger Bands indicator, tailored to help traders identify volatility cycles and catch potential breakouts with better precision and timing. It builds upon the foundational concept of Bollinger Bands—using a moving average and standard deviation bands—but adds crucial insights into market contraction and expansion, which can be instrumental in timing entries and exits.
Here's how it works and why it's useful
At its core, the indicator calculates a moving average (called the "basis") and plots two bands—one above and one below—based on a multiple of standard deviation. These bands expand during volatile periods and contract during quiet ones. The width between these bands, normalized as a percentage of the basis, gives us a sense of how compressed or expanded the market currently is. When the band width drops below a user-defined threshold (like 2%), the script highlights this with an orange triangle below the bar. This is the "squeeze" condition, signaling a potential buildup of market energy—a kind of calm before the storm.
What makes this version of Bollinger Bands particularly powerful is that it not only detects squeezes, but also tells you when price breaks out of that squeeze range. If price closes above the upper band after a squeeze, a green "Breakout ↑" label is shown; if it closes below the lower band, a red "Breakout ↓" appears. These breakout labels act as entry signals, suggesting that volatility is returning and a directional move has begun.
This indicator is especially useful in markets that tend to alternate between consolidation and breakout phases, such as forex, crypto, and even individual stocks. Traders who look for early signs of momentum—whether for swing trading, scalping, or position building—can benefit from this tool. During a quiet market phase, the indicator warns you that a move might be coming; when the move starts, it tells you the direction.
In fast-moving markets, BVA helps filter out noise by focusing only on high-probability conditions: quiet consolidation followed by a strong breakout. It’s not a complete system by itself—it works best when paired with volume confirmation or oscillators like RSI—but as a volatility trigger and directional guide, it’s a reliable component of a trading workflow.

Aroon Buy & Sell (Custom TFs)Here's a detailed explanation of your Pine Script titled "Aroon Buy & Sell (Custom TFs)":
🧠 Strategy Overview:
This script generates buy and sell signals using the Aroon indicator across two different timeframes:
* One for detecting the primary trend (Trend Timeframe)
* One for confirming precise entry signals (Signal Confirmation Timeframe)
📊 Key Components:
1. User Inputs
* trendTF: The timeframe used to determine overall trend direction (e.g., 5-minute).
* signalTF: The faster timeframe for confirming trade signals (e.g., 1-minute).
* aroonLength: Lookback period for the Aroon calculation (default 14).
* cooldownPeriod: Number of bars to wait before allowing a new signal.
2. Aroon Calculation Function
Calculates Aroon Up and Aroon Down values using the number of bars since the highest high and lowest low.
3. Multi-Timeframe Aroon Values
Uses request.security to compute Aroon values on both trendTF and signalTF.
4. Trend Detection
* A bullish trend is defined when Aroon Up crosses above Aroon Down on the trend timeframe.
* A bearish trend is defined when Aroon Down crosses above Aroon Up.
5. Signal Logic
* Buy Signal: When the overall trend is bullish and Aroon Down = 100 on the signal timeframe.
* Sell Signal: When the trend is bearish and Aroon Up = 100 on the signal timeframe.
6. Cooldown Mechanism
Prevents back-to-back signals by enforcing a cooldown (e.g., 20 bars) after each buy/sell.
7. Signal Plotting & Alerts
Plots buy/sell signals directly on the chart and supports alerts for automation.
📈 Visual Output:
* BUY label below the bar when buy conditions are met.
* SELL label above the bar when sell conditions are met.
🔔 Alerts:
Two alertconditions are defined to trigger alerts whenever a buy or sell signal occurs.
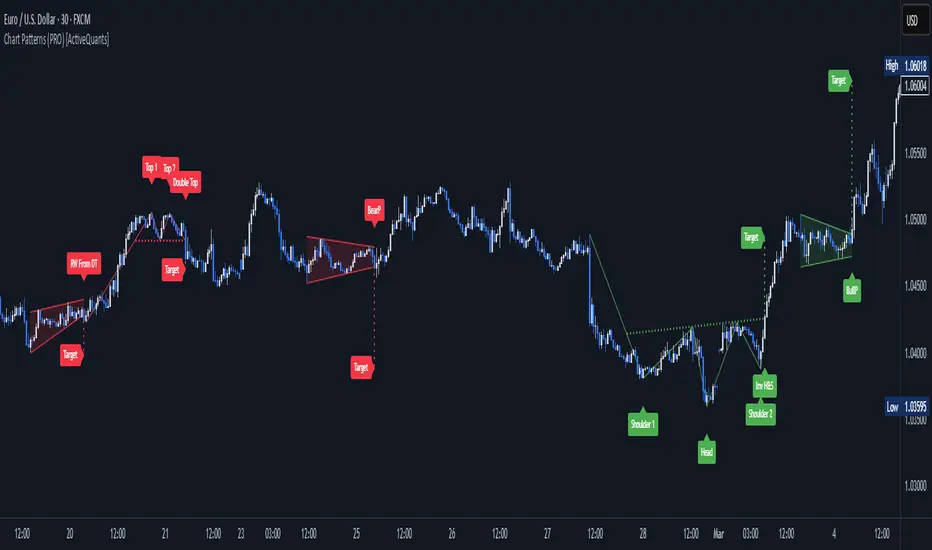
Chart Patterns (PRO) [ActiveQuants]Unlock the full potential of chart pattern trading with Chart Patterns (PRO) ! This advanced indicator goes beyond basic detection, offering a comprehensive suite of tools for serious traders. Automatically identify an extensive range of reversal and continuation patterns, complete with projected price targets , visually appealing pattern fills , and a sophisticated multi-status alert system .
How It Works
The indicator employs a sophisticated multi-stage process:
Precision Pivot Detection: At its heart, the indicator identifies significant swing highs and lows (pivot points) using an optimized internal period. These pivots are the fundamental building blocks for all pattern recognition. ( Users can toggle visibility of these pivots ).
Advanced Pattern Recognition Engine: Sequences of these pivot points are meticulously analyzed against a vast library of predefined geometric conditions to identify chart patterns. This includes checks for relative pivot heights/lows, slope analysis of trendlines, and ATR-based proportionality for patterns like Head & Shoulders.
Dynamic Status Tracking & Invalidation:
- Active: A pattern's initial structure is identified (e.g., two tops of a Double Top, or the converging trendlines of a Pennant). The pattern is developing.
- Confirmed: The pattern completes, and price breaks out/down from a key level (e.g., neckline, trendline) in the expected direction. Price targets are plotted upon confirmation.
- Invalidated: If price breaks out/down in the opposite direction of what's expected for an "Active" pattern, or if a new pivot forms that structurally compromises an "Active" Double Top/Bottom or Head & Shoulders before its confirmation, the pattern is marked "Invalid".
Price Target Projection: For confirmed patterns (excluding simple HH/LL structures), the indicator automatically calculates and plots potential price targets based on common technical analysis principles (e.g., pattern height projected from the breakout point).
█ DETECTED CHART PATTERNS
Chart Patterns (PRO) identifies a comprehensive list of 20 patterns, categorized for clarity:
I. Simple Market Structures:
Lower Low (LL): Indicates bearish pressure, potentially forming part of a larger downtrend.
Lower Low & Lower High (LL & LH): Stronger confirmation of a bearish trend.
Higher High (HH): Signals bullish strength, potentially part of an uptrend.
Higher High & Higher Low (HH & HL): Stronger confirmation of a bullish trend.
II. Reversal Patterns:
These patterns typically signal a potential end of the current trend and the beginning of a new one in the opposite direction.
Double Top (DT): Bearish reversal. Two distinct peaks at similar levels.
Double Bottom (DB): Bullish reversal. Two distinct troughs at similar levels.
Head and Shoulders (H&S): Bearish reversal. A central peak (head) flanked by two smaller peaks (shoulders).
Inverse Head and Shoulders (Inv H&S): Bullish reversal. A central trough (head) flanked by two smaller troughs (shoulders).
Rising Wedge From Uptrend (RW From UT): Bearish reversal. Converging trendlines with an upward slant during an uptrend.
Falling Wedge From Downtrend (FW From DT): Bullish reversal. Converging trendlines with a downward slant during a downtrend.
Bearish Ascending Triangle (Reversal): Bearish reversal. A horizontal resistance line with rising support, typically occurring after a downtrend.
Bullish Descending Triangle (Reversal): Bullish reversal. A horizontal support line with falling resistance, typically occurring after an uptrend.
III. Continuation Patterns:
These patterns typically suggest a temporary pause in the prevailing trend, after which the trend is likely to resume.
Rising Wedge From Downtrend (RW From DT): Bearish continuation. An upward-slanted consolidation during a downtrend.
Falling Wedge From Uptrend (FW From UT): Bullish continuation. A downward-slanted consolidation during an uptrend.
Bearish Pennant: Bearish continuation. A small symmetrical triangle (converging trendlines) after a sharp downward move.
Bullish Pennant: Bullish continuation. A small symmetrical triangle (converging trendlines) after a sharp upward move.
Bearish Flag: Bearish continuation. A short, rectangular consolidation (parallel trendlines, often upward sloping) after a sharp downward move.
Bullish Flag: Bullish continuation. A short, rectangular consolidation (parallel trendlines, often downward sloping) after a sharp upward move.
Bearish Descending Triangle: Bearish continuation. Horizontal support and a descending resistance line during a downtrend.
Bullish Ascending Triangle: Bullish continuation. Horizontal resistance and an ascending support line during an uptrend.
█ KEY FEATURES
- Automatic Price Target Projection:
Once a pattern is "Confirmed," a price target is automatically plotted on the chart.
Targets are calculated based on established technical methods, typically measuring the height of the pattern and projecting it from the breakout point.
Includes a label displaying the target price level. Toggle with Show Price Targets .
- Advanced Multi-Status Alerts:
Never miss an opportunity with highly configurable alerts.
Receive notifications when a pattern is:
- Developing (Active): Get an early heads-up.
- Confirmed: Act on breakout signals.
- Invalidated: Re-assess your strategy quickly.
Alerts automatically include the pattern type and its status (e.g., "Double Top - Confirmed ✅").
Additional contextual information included by default: Ticker Symbol, Chart Timeframe, Current Price, and Projected Target Price (for confirmed patterns).
Enable/disable all alerts via the Enable Alerts setting.
- Comprehensive Pattern Validation & Invalidation:
Patterns like Wedges, Triangles, Pennants, and Flags are monitored for breakouts. A breakout in the expected direction confirms the pattern; a breakout in the opposite direction invalidates it.
Double Tops/Bottoms and Head & Shoulders have pre-confirmation invalidation logic: if a new pivot forms that compromises the pattern's structure before the neckline breaks, the pattern is marked "Invalid". This helps filter out weaker setups.
ATR is used internally for proportional checks in patterns like Head & Shoulders, ensuring more reliable formations.
- Superior Visualizations:
Pattern Fills: Wedges, Triangles, Pennants, and Flags are visually enhanced with a semi-transparent fill between their trendlines, making them easy to spot.
Clear Necklines & Trendlines: Critical lines for patterns are drawn clearly.
Distinct Labels: Each pattern receives a main label (e.g., "H&S", "BullP"). Double Tops/Bottoms and H&S also get individual component labels (Top 1/2, Shoulder 1/Head/Shoulder 2).
Customizable Colors: Set distinct colors for bullish and bearish patterns.
- Pattern Display Control:
Toggle visibility for each of the 20 individual pattern types.
Filter displayed patterns by their status: All , Active , Confirmed , or Invalid .
Control historical depth with Show Last History (Bars) .
- Pivot Point Engine:
The indicator uses an optimized internal lookback period for robust pivot detection.
Optionally display these pivot high and low markers on your chart, with customizable colors.
█ USER INPUTS
Visibility and Common Styling
- Show Last History (Bars):
Number of recent bars the indicator will analyze and plot patterns on.
Default: 3000. Min: 10.
- Patterns (Visibility Filter):
Filters displayed patterns based on their status.
Options: All, Active, Confirmed, Invalid.
Default: All.
- Show Price Targets:
Toggles the display of calculated price targets for confirmed patterns.
Default: Enabled.
- Bearish Color:
Sets the color for bearish patterns and their components.
Default: Red.
- Bullish Color:
Sets the color for bullish patterns and their components.
Default: Green.
Pivot Points
- Show Pivot Highs:
Toggles the visibility of detected pivot high markers.
Default: Enabled.
- Show Pivot Lows:
Toggles the visibility of detected pivot low markers.
Default: Enabled.
- Pivot Highs Color:
Color for pivot high markers.
Default: #ff5252 (Reddish).
- Pivot Lows Color:
Color for pivot low markers.
Default: #089981 (Greenish).
Pattern Toggles (Grouped by Type)
- Simple Structures:
Lower Low (Default: Enabled)
Lower Low & Lower High (Default: Enabled)
Higher High (Default: Enabled)
Higher High & Higher Low (Default: Enabled)
- Reversal Patterns:
Double Tops (Default: Enabled)
Double Bottoms (Default: Enabled)
Head and Shoulders (Default: Enabled)
Inverse Head and Shoulders (Default: Enabled)
Rising Wedges From Uptrend (Default: Enabled)
Falling Wedges From Downtrend (Default: Enabled)
Bearish Ascending Triangles (Reversal context) (Default: Enabled)
Bullish Descending Triangles (Reversal context) (Default: Enabled)
- Continuation Patterns:
Rising Wedges From Downtrend (Default: Enabled)
Falling Wedges From Uptrend (Default: Enabled)
Bearish Pennants (Default: Enabled)
Bullish Pennants (Default: Enabled)
Bearish Flags (Default: Enabled)
Bullish Flags (Default: Enabled)
Bearish Descending Triangles (Continuation context) (Default: Enabled)
Bullish Ascending Triangles (Continuation context) (Default: Enabled)
Alerts
- Enable Alerts:
Master switch to enable or disable all alert notifications from this indicator.
Default: Enabled. ( Alert messages are pre-configured to include Pattern Type, Status, Symbol, Timeframe, Price, and Target Price when applicable and confirmed ).
█ UNDERSTANDING PATTERN INVALIDATION
Trendline Patterns (Wedges, Triangles, Pennants, Flags): An "Active" pattern is invalidated if price breaks its trendlines in the direction opposite to the expected breakout before a confirmation occurs. E.g., an Active Bullish Pennant is invalidated if price breaks below its lower trendline.
Neckline Patterns (Double Tops/Bottoms, H&S): An "Active" pattern can be invalidated before a neckline break if a new pivot point forms that violates the pattern's structural integrity.
Example (Double Top): If Top 1, Neckline (P5), and Top 2 form (Active status), but before price breaks below P5, a new swing low forms at or above P5, the Double Top is invalidated. This indicates a failure to break support and potential renewed strength.
█ ALERTS GUIDE
Add the " Chart Patterns (PRO) " indicator to your chart.
Ensure Enable Alerts is checked in the indicator settings.
In TradingView, click the "Alert" icon (clock) in the right toolbar or press ALT + A .
In the "Create Alert" dialog:
- Condition: Select " Chart Patterns (PRO) ".
- For the condition dropdown below it, choose " Any alert() function call ". This will trigger for any alert generated by the script.
- Interval: Choose whatever interval you want the alert to be triggered.
- Expiration: Choose the expiration date.
Customize your alert notification preferences (popup, email, webhook, etc.) and click " Create ".
You will now receive alerts for pattern status changes (Developing, Confirmed, Invalidated) with detailed information.
█ CONCLUSION
The Chart Patterns (PRO) indicator is an indispensable tool for traders aiming to optimize their workflow. By automatically identifying and drawing classical chart patterns, it eliminates the need for manual chart analysis, thereby enabling users to dedicate substantially less time to chart monitoring. Its comprehensive detection, coupled with actionable insights like price targets and a meticulous status tracking system with alerts, provides a significant analytical edge. Automate your pattern recognition and drawing, and concentrate on making informed trading decisions with enhanced efficiency.
█ IMPORTANT NOTES
⚠ Confirmation is Crucial: While "Active" patterns provide early warnings, always await "Confirmed" status (e.g., neckline/trendline breaks) and consider volume and broader market context.
⚠ Non-Repainting Logic: Pattern detection and status updates are based on confirmed price bars and pivot points. Once a pattern is fully formed and its status set (Active, Confirmed, Invalid), it will not repaint its historical state. Initial drawing of "Active" patterns extends to the current bar and updates dynamically.
⚠ Combine with Other Tools: No indicator is a standalone solution. Use Chart Patterns (PRO) in conjunction with other forms of analysis (e.g., fundamental analysis, other indicators, volume analysis) and robust risk management .
⚠ Historical Data: Ensure sufficient historical data on your chart for patterns to form and be detected accurately. The Show Last History (Bars) setting can manage this.
⚠ Lagging Nature: By their very definition, chart patterns are lagging indicators as they require a sequence of price action and several pivot points to complete their formation.
█ RISK DISCLAIMER
Trading involves substantial risk of loss and is not suitable for all investors. The Chart Patterns (PRO) indicator and its generated information are for educational and informational purposes only. It does not constitute financial advice or a recommendation to buy or sell any security. Chart patterns and projected targets indicate potential price movements based on historical tendencies but do not guarantee future results. Always conduct your own due diligence, consider multiple factors, and consult with a qualified financial advisor before making investment decisions. Past performance is not indicative of future results.
📈 Happy trading! 🚀
Granville's 8 Rules Visualizer 🧠 Granville’s 8 Rules Indicator
I’ve created a Pine Script indicator that visually implements **Granville’s Eight Rules**, one of the foundational theories for price movement relative to a moving average (MA). This tool helps traders better time entries and exits based on momentum shifts and MA behavior.
---
### 📈 What is Granville’s Law?
Joseph Granville’s theory suggests that **price and moving average (typically SMA)** interactions produce **8 recurring signals**:
* **4 Buy signals** (B1–B4)
* **4 Sell signals** (S1–S4)
These rules help identify the beginning or continuation of bullish and bearish trends.
---
### 🔍 Indicator Logic
This indicator uses a simple 20-period SMA (modifiable) and tracks price action in relation to it. Each signal is drawn as a triangle with a label (`B1` to `B4` or `S1` to `S4`), based on the following rules:
#### ✅ Buy Signals:
* **B1**: Price crosses above a rising MA (classic breakout)
* **B2**: Price pulls back below a rising MA, then begins rising again
* **B3**: Price bounces off a falling MA
* **B4**: Price is above a rising MA but temporarily drops
#### ❌ Sell Signals:
* **S1**: Price crosses below a falling MA
* **S2**: Price pulls back above a falling MA, then starts dropping again
* **S3**: Price bounces down off a rising MA
* **S4**: Price is below a falling MA but temporarily rises
---
### 🛠 How to Use It:
1. **Trend Confirmation**: Use the moving average slope (rising or falling) as your trend filter.
2. **Entry Timing**: Look for Buy signals (B1–B4) in uptrends and Sell signals (S1–S4) in downtrends.
3. **Avoid Noise**: Combine with volume or volatility filters (e.g. ATR or squeeze) to eliminate weak setups.
4. **Customize**: Adjust the MA type or length to fit your market (e.g. EMA for crypto, SMA for FX).
---
### 💡 Example Strategies:
* Pair **B1 + rising volume** for early trend entries
* Use **B2/B4** for retracement-based entries
* Exit on **S3/S4** for profit taking or stop logic
Happy trading!
