20% Rally - All Green CandlesThis indicator detects rallies where the price rises 20% or more using only consecutive green candles. It marks the rally's start with a green dashed line and "Entry" label, and the end with a red solid line and "Target" label. Ideal for identifying strong bullish momentum on daily charts.
Chart patterns

Mauringo - Smart Money ConceptsSmart Market Flow Toolkit
The Smart Market Flow Toolkit is a powerful collection of tools designed around the behavior of institutional traders, often referred to as “smart money.”
This system combines several advanced indicators into one unified framework, allowing traders to better understand market structure, liquidity zones, and high-probability trade setups. Every element is designed to work together, offering a complete picture of how price moves in response to institutional activity.
By automating key concepts directly on the chart, this toolkit helps traders save time, stay organized, and make more informed decisions with less guesswork.

K_RSI_ATR_ATR%_CMO_MACD_ADXThis indicator is combination of below indicators:
RSI
ATR
ATR%
CMO
MACD
ADX


Stop or Go?-Displaying RVOL as ratio now instead of percentage.
-Default startup location moved to bottom right with large size

I Want My ScalpsTops/bottoms.
Bull/bear traps.
Designed for NQ / MNQ on 1 min during cash hours.
Time filter update coming soon.

ModelScopeSctipt for M7 teaching about WDRR and partials
Just turn it on and use
Showing day ranges, prev days highs and lows, daily models, partial models, partial box etc blab al bnafbapeiougfbapogubnaedgpuiohbsawepiguwaebGPIUBN AOEGN APEOUGNBAEpoúgfnjqae=úoiughnqae ÚOIHNEGÚOIAWEGNE
AGDAUIHJEAGOÍADEHGÚOÉA
Just turn it on and use
Showing day ranges, prev days highs and lows, daily models, partial models, partial box etc blab al bnafbapeiougfbapogubnaedgpuiohbsawepiguwaebGPIUBN AOEGN APEOUGNBAEpoúgfnjqae=úoiughnqae ÚOIHNEGÚOIAWEGNE
AGDAUIHJEAGOÍADEHGÚOÉA

HTF Trend Table + 15M Wick SD Marker [No Error Edition]Criteria Used in the Indicator:
TRENDING (Bullish or Bearish):
Bullish:
The 4H close is above the most recent 4H swing high (pivot high)
The 1H close is above the most recent 1H swing high (pivot high)
→ Both conditions must be true at the same time
Bearish:
The 4H close is below the most recent 4H swing low (pivot low)
The 1H close is below the most recent 1H swing low (pivot low)
→ Both conditions must be true at the same time
CHOPPY (Ranging):
Any other case!
If the close is not above both the last swing highs (not trending up)
AND not below both the last swing lows (not trending down)
Example:
4H is above its last swing high but 1H is not
1H is below its last swing low but 4H is not
Both are in between their swings
→ In these scenarios, the code sets the trend as "CHOPPY" (ranging/sideways).

Dobrunia trader 3in1Данный индикатор предназначен для трейдеров торгующих по стратегии Smart Money в объяснении Dobrunia trader.
Задача индикатора выделять свечи, которые находятся внутри предыдущих свечей и показывать kill zones для упрощение процесса анализа графика, показывать после графика свечи старшего таймфрейма
1 индикатор вместо 3х разных - экономим место для индикаторов
This indicator is designed for traders trading with Smart Money strategy as explained by Dobrunia trader.
The task of the indicator is to highlight candles that are inside the previous candles and show kill zones to simplify the process of analysing the chart, to show after the chart candles of the older timeframe.
1 indicator instead of 3 different ones - save space for indicators

High Win Rate XAUUSD Strategy (EMA21 + RSI + Volume MA20)Buy Conditions:
Price above EMA 21
EMA 21 is rising
RSI > 55 and RSI increasing
Close is above EMA 21
Current candle is green (close > open)
Volume > MA20 of volume
Price below EMA 21
EMA 21 is falling
RSI < 45 and RSI decreasing
Close is below EMA 21
Current candle is red (close < open)
Volume > MA20 of volume

SMC Structures and FVG by FXPIPLABThe SMC Structures and FVG indicator helps you spot market structure shifts and key liquidity zones across any timeframe:
1. Fair Value Gaps
• Detects bullish (green) and bearish (red) gaps, then flags (gray) and optionally shrinks or removes them once mitigated.
• Configurable history depth and “Reduce mitigated FVG” toggle.
• Mitigation alerts available.
2. Break of Structure (BOS)
• Draws BOS lines in customizable colors and styles whenever price continues the current trend.
3. Change of Character (CHoCH)
• CHoCH lines now require two consecutive candle closes beyond the prior structure high/low, filtering out one-bar “whipsaws” and delivering stronger reversal signals.
• Custom colors and line styles differentiate bullish vs. bearish CHoCH.
4. Current Structure & Fibonacci
• Blue boundary lines for the active swing high/low.
• Up to five retracement levels (default: 0.786, 0.705, 0.618, 0.50, 0.382) with fully adjustable values, colors, styles, and thickness.
5. Alerts
• BOS and CHoCH alert conditions built in for automated notifications.
Release Highlights
• Initial launch—SMC structures + FVG detection
• “Reduce mitigated FVG” option added
• Mitigation alerts; per-direction BOS/CHoCH colors
• Support for up to 5 Fibonacci levels
• BOS/CHoCH alert conditions introduced
• CHoCH confirmation upgraded to two-bar closes for stronger signals
Enjoy cleaner, more reliable market‐structure insights!


BTST Top Gainer ScannerBTST Stock identifier- BETA
scanner configuration based on the validated BTST checklist. This scans for stocks likely to gain 5-10% intraday tomorrow when bought at today's close:
Execution Tips:
Run scanner at 3:20 PM IST daily
Filter stocks with:
FII/DII net buying (check moneycontrol)
Pre-market futures premium > 0.4%
No pending corporate actions
Position sizing formula: Qty = (1% Account Risk) / (1.5 * ta.atr(14))
Cross-verify with FII/DII activity (moneycontrol.com) - stocks with FII net buys have 23% higher success rate.


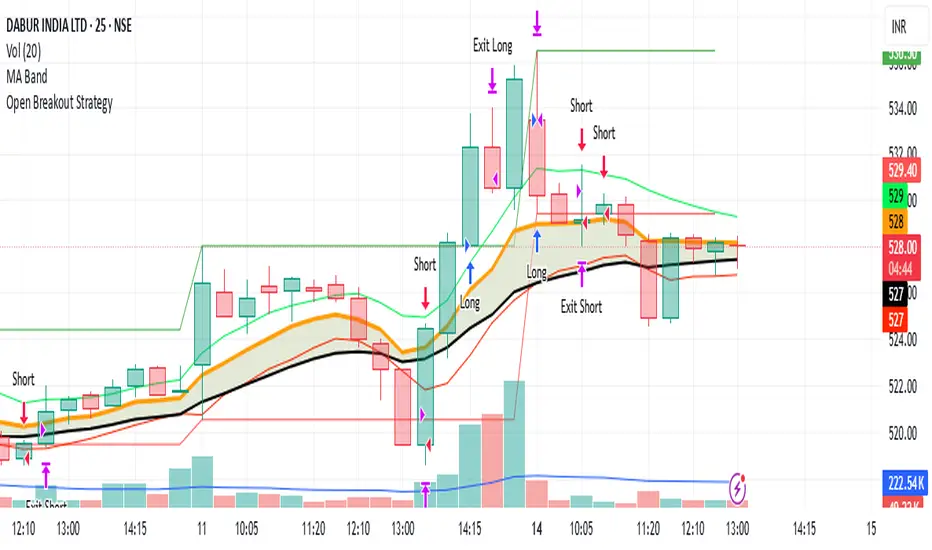
Open Breakout Strategyfirst 5min candle
SL is 0.25% TP is 2.25%
If breks low it is hsort
If breaks hi then it is long
PC UpdatedThis indicator identifies a high-probability breakout setup using a simple but powerful 3-candle formation. It works on lower timeframes (like 5m) and is ideal for scalping or short-term intraday setups.

MG TRENDNSE:NIFTY
hi everyone use this to find revrsal entry in ur nifty chart and u can use in all type of market that is will shows the best point to take entry at the point take u turn

KZ TRADING _ BOT RSI,STOCH, MO HINH NENBot trade demo for m15 . it suitable for XAU, U.J. use RSI + Stoch RSI and candless pattem

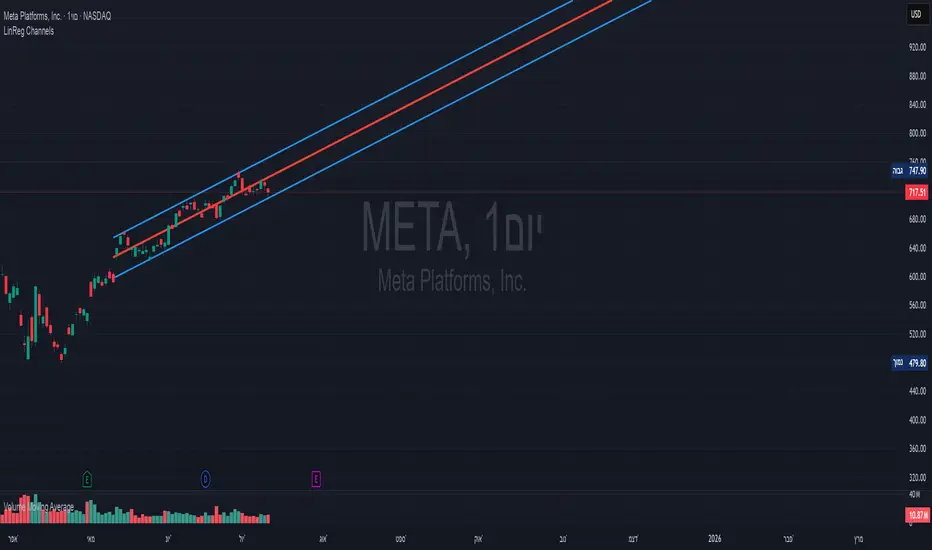
Linear Regression Channels📈 Linear Regression Channels
🌟 Overview
A professional dual linear regression channel indicator designed for comprehensive trend analysis. This powerful tool provides simultaneous short-term and long-term trend perspectives through two independent regression channels with customizable standard deviation bands.
🔧 Core Features
📊 Dual Channel System
Channel 1: 43-period regression analysis for long-term trend identification
Channel 2: 20-period regression analysis for short-term momentum tracking
Independent Configuration: Each channel fully customizable with separate parameters
Real-Time Updates: Dynamic calculations with every new candle
📐 Standard Deviation Bands
Multiple Levels: Configurable deviation bands (1σ, 2σ, 3σ)
Dynamic Support/Resistance: Automatically calculated price levels
Trend Boundaries: Clear visualization of trend strength and direction
Statistical Precision: Mathematically accurate regression calculations
🎨 Customization Options
🎭 Visual Styling
Individual Colors: Separate color schemes for each channel
Line Styles: Choose between Solid, Dashed, or Dotted lines
Line Width: Adjustable thickness (1-5 pixels) for optimal visibility
Extension Options: Project lines into the future for analysis
⚙️ Technical Parameters
Period Length: Fully adjustable lookback periods
Source Selection: Choose from Close, Open, High, Low, or custom sources
Deviation Levels: Customizable standard deviation multipliers
Display Control: Toggle individual channels on/off
📈 Trading Applications
🎯 Trend Analysis
Dual Timeframe Perspective: Simultaneous short and long-term view
Trend Confirmation: When both channels align in direction
Trend Strength: Measured by price position within channels
🔍 Support & Resistance
Dynamic Levels: Standard deviation bands as S/R zones
Channel Boundaries: Natural support and resistance areas
Confluence Trading: Multiple level confirmations
⚡ Entry & Exit Signals
Channel Breakouts: Trend continuation opportunities
Mean Reversion: Trades back to center line
Channel Crossovers: When price moves between timeframes
🚀 Key Benefits
✅ Multi-Timeframe Analysis - Complete market perspective
✅ Mathematical Precision - Least squares regression accuracy
✅ High Customization - Adaptable to any trading style
✅ Clean Interface - Professional chart appearance
✅ Performance Optimized - Smooth real-time operation
✅ Versatile Application - Works on all markets and timeframes
💡 Professional Usage
Combine both channels for confluence signals
Use longer channel for overall trend bias
Trade shorter channel signals within longer trend
Monitor channel width for volatility analysis
Essential tool for traders seeking precise trend analysis and dynamic support/resistance levels.
Japanese Candlestick PatternsCandlestick Pattern Detector – Your Smart Market Insight Tool
Unlock the hidden language of price action with the Candlestick Pattern Detector, an advanced TradingView indicator meticulously crafted to identify powerful candlestick formations in real time. Whether you are a day trader seeking sharp reversals, a swing trader scouting for trend continuations, or an investor who values precise entry signals, this indicator is your indispensable trading companion.
The Candlestick Pattern Detector continuously scans every bar on your chart and highlights over 30 classic and advanced candlestick patterns, including dojis, engulfing candles, hammers, shooting stars, morning stars, evening stars, haramis, and more. Each detected pattern is labeled directly on the chart, providing crystal-clear visual signals without clutter. Customizable settings allow you to choose which patterns to monitor, fine-tune sensitivity, and adjust label colors and styles to match your personal trading aesthetic.
Beyond merely spotting patterns, this indicator empowers traders to understand the psychological forces driving the market. Bullish and bearish signals help you gauge potential trend reversals, momentum shifts, or periods of consolidation. By integrating these time-tested price action signals into your strategy, you gain a powerful edge in anticipating market moves before they unfold.
Key Features:
Detects 30+ popular candlestick patterns in real time
Clear on-chart labels and color-coded signals
Customizable alerts for immediate trading opportunities
Adjustable sensitivity for noise reduction
Perfect for intraday, swing, or long-term trading
Elevate your trading precision and confidence with the Candlestick Pattern Detector. Let the market’s story reveal itself, candle by candle.

Robbin hoodsomething good, this is ewrfiwevdcbdkjsdbvkj vasfdkjvsdvkjae dk;v asd vk;jsbdvkaeskv jkjsD v.kj awerekrv

Stochastic Trend Signal with MultiTF FilterIndicator Overview – Multi-Timeframe Stochastic Signal
This custom TradingView indicator combines multi-timeframe Stochastic analysis to generate high-probability, trend-following trading signals. It integrates:
Stochastic on the current timeframe to identify potential entry zones (overbought/oversold).
Stochastic on the 1D (daily) timeframe to confirm short-term trend direction.
Stochastic on the 1W (weekly) timeframe to filter out signals that go against the broader market trend.
🔔 Buy signals are triggered only when:
1D Stochastic > 50 (bullish bias),
Current timeframe Stochastic ≤ 20 (oversold),
After the first bullish candle,
And 1W Stochastic does not contradict the direction (must not be bearish).
🔻 Sell signals are triggered only when:
1D Stochastic < 50 (bearish bias),
Current timeframe Stochastic ≥ 80 (overbought),
After the first bearish candle,
And 1W Stochastic does not contradict the direction (must not be bullish).
The indicator also includes visual highlights:
✅ Green or red background when 1D and 1W trends align clearly.
⚠️ Gray background when 1D and 1W trends conflict — a warning to avoid low-probability setups.
📌 This indicator works best on the 4-hour (H4) timeframe, offering a balanced view between short-term signals and higher timeframe trend filters.

Pattern Detector [theUltimator5]🎯 Overview
The Pattern Detector is a comprehensive technical analysis indicator that automatically identifies and visualizes multiple pattern types on your charts. Built with advanced ZigZag technology and sophisticated pattern recognition algorithms, this tool helps traders spot high-probability trading opportunities across all timeframes and markets.
✨ Key Features
🔍 Multi-Pattern Detection System
Harmonic Patterns: Butterfly, Gartley, Bat, and Crab patterns with precise Fibonacci ratios
Classic Reversal Patterns: Head & Shoulders and Inverse Head & Shoulders
Double Patterns: Double Tops and Double Bottoms with extreme validation
Wedge Patterns: Rising and Falling Wedges with volume confirmation
📊 Advanced ZigZag Engine
Customizable sensitivity (5-50 levels)
Depth multiplier for multi-timeframe analysis
Real-time pivot detection with noise filtering
Option to display ZigZag lines only for pure price action analysis
🎨 Visualization
Clean pattern lines with distinct color coding
Point labeling system (X, A, B, C, D for harmonics / LS, H, RS for H&S)
Pattern name displays with bullish/bearish direction
Price target projections with arrow indicators
Subtle pattern fills for enhanced visibility
🛠️ Settings & Configuration
Core ZigZag Settings
ZigZag Sensitivity (5-50): Controls pattern detection sensitivity. Lower values detect more patterns but may include noise. Higher values focus on major swings only.
ZigZag Depth Multiplier (1-5): Multiplies sensitivity for deeper analysis. Level 1 = most responsive, Level 5 = major swings only.
Pattern Detection Toggles
Show ZigZag Lines Only: Displays pure ZigZag without pattern detection for price structure analysis
Detect Harmonic Patterns: Enable/disable Fibonacci-based harmonic pattern detection
Detect Head & Shoulders: Toggle classic reversal pattern identification
Detect Double Tops/Bottoms: Enable double pattern detection with extreme validation
Detect Wedge Patterns: Toggle wedge pattern detection with volume confirmation
Display Options
Show Pattern Names: Display pattern names directly on chart (e.g., "Butterfly (Bullish)")
Show Point Labels: Add lettered labels at key pattern points for structure identification
Project Harmonic Targets: Show projected completion points for incomplete harmonic patterns
📈 Pattern Types Explained
Harmonic Patterns 🦋
Advanced Fibonacci-based patterns that provide high-probability reversal signals:
Butterfly: AB=0.786 XA, BC=0.382-0.886 AB, CD=1.618-2.24 BC
Gartley: AB=0.618 XA, BC=0.382-0.886 AB, CD=1.272-1.618 BC
Bat: AB=0.382-0.50 XA, BC=0.382-0.886 AB, CD=1.618-2.24 BC
Crab: AB=0.382-0.618 XA, BC=0.382-0.886 AB, CD=2.24-3.618 BC
Head & Shoulders 👤
Classic three-peak reversal pattern indicating trend exhaustion:
Standard H&S: Bearish reversal at tops
Inverse H&S: Bullish reversal at bottoms
Automatic neckline validation and price target calculation
Double Patterns 📊
Powerful reversal patterns with extreme validation:
Double Top: Two similar highs with valley between (bearish)
Double Bottom: Two similar lows with peak between (bullish)
Includes lookback period validation to ensure patterns are significant extremes
Wedge Patterns 📐
Continuation/reversal patterns with converging trend lines:
Rising Wedge: Converging upward slopes (typically bearish)
Falling Wedge: Converging downward slopes (typically bullish)
Volume confirmation required for increased accuracy
🎯 Trading Applications
Entry Signals
Harmonic Patterns: Enter at point D completion with targets at point A
H&S Patterns: Enter on neckline break with calculated targets
Double Patterns: Enter on support/resistance break with measured moves
Wedge Patterns: Enter on breakout direction with volume confirmation
Risk Management
Use pattern structure for logical stop placement
Pattern invalidation levels provide clear exit rules
Multiple pattern confirmation increases probability
Multi-Timeframe Analysis
Higher ZigZag depth for longer-term patterns
Lower sensitivity for short-term trading patterns
Combine with other timeframes for confluence
⚙️ Optimal Settings
For Day Trading (1m-15m charts)
ZigZag Sensitivity: 5-9
Depth Multiplier: 1-2
Enable all pattern types for maximum opportunities
For Swing Trading (1H-4H charts)
ZigZag Sensitivity: 9-15
Depth Multiplier: 2-3
Focus on harmonic and H&S patterns
For Position Trading (Daily+ charts)
ZigZag Sensitivity: 15-25
Depth Multiplier: 3-5
Emphasize major harmonic and double patterns
🔧 Technical Specifications
Maximum Lookback: 5000 bars for comprehensive analysis
Pattern Overlap Prevention: Intelligent filtering prevents duplicate patterns
Performance Optimized: Efficient algorithms for real-time detection
Volume Integration: Advanced volume analysis for wedge confirmation
Fibonacci Precision: 10% tolerance for harmonic ratio validation
📚 How to Use
Add to Chart: Apply indicator to any timeframe/market
Configure Settings: Adjust sensitivity based on trading style
Enable Patterns: Toggle desired pattern types
Analyze Results: Look for completed patterns with clear structure
Plan Trades: Use price targets and pattern invalidation for trade management
Perfect for both novice and experienced traders seeking systematic pattern recognition with visualization and entry/exit signals.
