JUJUBy default, the indicator works on the current chart timeframe (HTF = chart).
Bars back defines how many previous candles are used in the calculations.
To display the indicator on the same chart but from another timeframe, set a negative offset equal to -bars_back.
Note: Don't forget to set offset = -bars_back.
If you encounter bar counting errors, reduce the bars_back value.
Alternatively, use symbols like NQ1, ES1, etc. where historical data is more reliable.
🔁 Using a different timeframe (HTF):
If you want to visualize candles from a different timeframe:
Set the appropriate timeframe manually
Set bars_back = 100
Set offset = 20
This will draw the HTF chart with a right-side offset of 20 candles.
⚠️ Warning: When using a higher timeframe with offset > 0, you can only display up to 500 bars forward.
So, if you're stacking multiple HTF indicators (e.g. multiple Juju indicators), make sure the total of offset + bars_back is less than 500.
🔎 Visual elements included:
FVG (Fair Value Gaps)
With options for:
Mitigated / not mitigated
Volume filtering
Number of times mitigated
OB Candles (not zones)
With imbalance detection
Parameters can be adjusted per timeframe
Bollinger Bands
Period 20 with deviation 2 and 2.5
Period 160 with deviation 2.8
Simple Moving Averages (SMA)
SMA 50, SMA 20, SMA 7
Trend
Shows the current trend (short-term)
Buy/Sell Labels
Generated when price interacts with FVGs
Conditional on the current Trend
Structure Levels (dashed lines)
If touched: line becomes solid
If broken through: line disappears
BSL / SSL (Buy-side / Sell-side Liquidity)
Marked using price values
CASH (RTH - Regular Trading Hours)
Displays price levels from the cash session
Highlights open/close candles
Plots levels and Fibonacci from the previous day’s open/close gap
Midnight Range (first 30 minutes)
Displays High, Low, and Open
USA / EU Tickers
Optional — complete this list to enable correct session detection for RTH/Cash calculations
Auto Fibonacci Tool
Automatically plots fib levels and extensions
Helps visualize Discount / Premium zones + Equilibrium
Yellow zones = Fibonacci extensions
Linear Regression + Deviation
Previous High / Low: Daily, Weekly, Monthly
Previous Asia Session High / Low
Candlestick analysis

NY Open Breakout [ATR-5000]# **New York Open Breakout Indicator **
## **📌 Overview**
This **Pine Script** indicator identifies high-probability breakout opportunities at the **New York market open (13:30 UTC)** based on **volatility filters** using **customizable ATR periods and thresholds**.
### **🔹 Key Features**
✅ **Fully Customizable ATR Periods** (2 to **5000** bars)
✅ **Adjustable Thresholds** (0.01% to 5.00%)
✅ **Opening Range (OR) Filter** (0.01% to 5.00%)
✅ **Clean Visuals** – Only highlights the **13:30 UTC candle** when conditions are met
✅ **Real-Time Info Panel** – Displays current ATR & threshold settings
✅ **Automatic Daily Reset** – Fresh signals every trading day
---
## **📊 How It Works**
### **1️⃣ Volatility Check (13:25 UTC)**
- Calculates **two ATR values** (user-defined periods)
- Compares them against **custom % thresholds**
- Only proceeds if **both ATRs exceed** their required volatility levels
### **2️⃣ Opening Range Confirmation (13:30 UTC)**
- Measures the **high-low range** of the 13:30 candle
- Validates if the range meets the **minimum % threshold**
- If all conditions pass → **Highlights the candle** in your chosen color
### **3️⃣ Visual Feedback**
- **🟣 Colored Candle** → Valid breakout signal
- **📊 Info Table** → Shows current ATR settings & thresholds
---
## **⚙️ Customization Options**
| **Setting** | **Default** | **Adjustable Range** |
|---------------------------|------------|----------------------|
| **First ATR Period** | 14 | **2–5000** bars |
| **Second ATR Period** | 161 | **2–5000** bars |
| **First ATR Threshold** | 0.42% | **0.01%–5.00%** |
| **Second ATR Threshold** | 0.40% | **0.01%–5.00%** |
| **OR Range Threshold** | 0.42% | **0.01%–5.00%** |
| **Candle Color** | Purple | **Any color** |
---
## **📈 Best Use Cases**
✔ **Forex (EURUSD, GBPUSD)** – Captures NY session momentum
✔ **Indices (SPX, NASDAQ)** – Works well with opening volatility
✔ **Commodities (Gold, Oil)** – Filters out low-energy days
---
## **🔧 How to Adjust Settings**
1. **Click the gear icon (⚙️)** on your TradingView chart
2. **Modify ATR periods & thresholds** as needed
3. **Change the candle color** for better visibility
---
## **🚀 Why This Indicator?**
- **No repainting** – Signals lock in after candle close
- **No clutter** – Only marks valid 13:30 candles
- **Adaptable** – Works on **any market & timeframe**
- **Fully automated** – No manual adjustments needed
---
### **📥 Apply & Start Trading!**
Simply **load the script** on TradingView and customize it to fit your strategy! 🚀

CRT + PO3 Range Theory Hey everyone, I’ve put together a little script for TradingView that tries to show the classic CRT + PO3 (Power of Three) pattern. It’s still a work in progress, so please use it on a demo account and let me know what you think!
What It Does
Accumulation Phase: On each higher‐timeframe bar (e.g. 2-hour), it draws a shaded zone where price is hanging out. That’s when we assume “big players” are quietly building positions.
Manipulation Phase: If price briefly pokes above or below that zone but then slips back inside, it marks that wick as a shake-out.
Distribution Phase: When price finally closes cleanly outside the zone, it draws another shaded area and drops a “Distribution” label plus a big LONG or SHORT arrow on that bar.
You can tweak it so it only shows signals when a bar closes (no more weird flashing mid-bar), or even allow “direct” Distribution on a clean breakout without waiting for a fake wick first.
How to Set It Up
Add the script from your Indicators list.
Pick your HTF (I like 2-hour or 4-hour).
Turn “Show Zone Labels” on or off—these are the little “Accumulation/Manipulation/Distribution” tags.
Turn “Show Entry Signals” on to get the big LONG/SHORT arrows.
If you hate flicker, check “Show signals only at bar close.”
If you want to catch a swift breakout (no fake-out needed), check “Allow direct Distribution on clean breakout.”
There are also sliders for zone colors, transparency, label size, and how far above/below the bars the labels sit.
Why It’s Still a Beta
I’m not a CRT/PO3 guru—this is more of a hobby project and a little facination for this strategy.
There might be edge cases where it misses a shake-out or flags a Distribution too early.
I take no responsibility for your trades—please only run it on a demo account until we’ve worked out the quirks.
Feedback Wanted!
If you try it out, I’d love to hear:
Did the Manipulation wicks line up where you expected?
Were the Distribution arrows on the right bars?
Any ideas for easier settings or extra alerts?
Thanks for testing and helping me turn this into something solid!

NY Open Breakout [ATR-5000]# **New York Open Breakout Indicator **
## **📌 Overview**
This **Pine Script** indicator identifies high-probability breakout opportunities at the **New York market open (13:30 UTC)** based on **volatility filters** using **customizable ATR periods and thresholds**.
### **🔹 Key Features**
✅ **Fully Customizable ATR Periods** (2 to **5000** bars)
✅ **Adjustable Thresholds** (0.01% to 5.00%)
✅ **Opening Range (OR) Filter** (0.01% to 5.00%)
✅ **Clean Visuals** – Only highlights the **13:30 UTC candle** when conditions are met
✅ **Real-Time Info Panel** – Displays current ATR & threshold settings
✅ **Automatic Daily Reset** – Fresh signals every trading day
---
## **📊 How It Works**
### **1️⃣ Volatility Check (13:25 UTC)**
- Calculates **two ATR values** (user-defined periods)
- Compares them against **custom % thresholds**
- Only proceeds if **both ATRs exceed** their required volatility levels
### **2️⃣ Opening Range Confirmation (13:30 UTC)**
- Measures the **high-low range** of the 13:30 candle
- Validates if the range meets the **minimum % threshold**
- If all conditions pass → **Highlights the candle** in your chosen color
### **3️⃣ Visual Feedback**
- **🟣 Colored Candle** → Valid breakout signal
- **📊 Info Table** → Shows current ATR settings & thresholds
---
## **⚙️ Customization Options**
| **Setting** | **Default** | **Adjustable Range** |
|---------------------------|------------|----------------------|
| **First ATR Period** | 14 | **2–5000** bars |
| **Second ATR Period** | 161 | **2–5000** bars |
| **First ATR Threshold** | 0.42% | **0.01%–5.00%** |
| **Second ATR Threshold** | 0.40% | **0.01%–5.00%** |
| **OR Range Threshold** | 0.42% | **0.01%–5.00%** |
| **Candle Color** | Purple | **Any color** |
---
## **📈 Best Use Cases**
✔ **Forex (EURUSD, GBPUSD)** – Captures NY session momentum
✔ **Indices (SPX, NASDAQ)** – Works well with opening volatility
✔ **Commodities (Gold, Oil)** – Filters out low-energy days
---
## **🔧 How to Adjust Settings**
1. **Click the gear icon (⚙️)** on your TradingView chart
2. **Modify ATR periods & thresholds** as needed
3. **Change the candle color** for better visibility
---
## **🚀 Why This Indicator?**
- **No repainting** – Signals lock in after candle close
- **No clutter** – Only marks valid 13:30 candles
- **Adaptable** – Works on **any market & timeframe**
- **Fully automated** – No manual adjustments needed
---
### **📥 Apply & Start Trading!**
Simply **load the script** on TradingView and customize it to fit your strategy! 🚀

Target Trend v1.0 [MkTrade]Target Trend is an intelligent trend indicator that automatically detects the trend direction and displays key levels on the chart: entry, stop, and up to 3 target (take-profit) levels.
🧠 How It Works:
The indicator uses moving averages and an adapted ATR to:
📈 Detect uptrends or downtrends;
🔄 Identify change of character (CHoCH) trend shifts;
🎯 Plot entry, stop-loss, and take-profit levels in the direction of the trend;
🧱 Visually display these levels with lines and labels on the chart;
✅ Mark targets hit and stop-outs with a checkmark or cross icon.
⚙️ Settings:
Trend Length – moving average period (default is 10);
Set Targets – additional multiplier for target levels;
All targets are dynamically calculated using volatility (ATR 200).
🔔 Alerts:
The indicator detects and supports alerts for:
Trend reversals (up/down),
Target (TP) hits,
Stop-loss activation.
You can enable these in the TradingView Alerts Panel.
✅ Benefits:
Fully automatic – no manual drawing required;
Convenient – all key levels are visualized directly on the chart;
Flexible – can be adapted to any strategy;
Clear visuals – clean interface with intuitive colors.
📋 How to Use:
Add the indicator to your chart;
Wait for a trend reversal signal (triangle + colored candle);
Enter at the current candle (Entry line);
Monitor price reaching T1–T3 or stop level;
Use alerts for automation if needed.
Target Trend — это интеллектуальный трендовый индикатор, который автоматически определяет направление тренда и отображает ключевые уровни: вход, стоп и до 3-х целей (тейков) на графике.
🧠 Как работает:
Индикатор использует скользящие средние и адаптированный ATR для:
📈 Определения восходящего или нисходящего тренда;
🔄 Определения моментов смены тренда (CHoCH);
🎯 Построения уровней входа, стоп-лосса и тейков в направлении тренда;
🧱 Отображения целей в виде уровней и меток на графике;
✅ Отмечает достигнутые цели и срабатывание стопа (визуально — галочкой и крестиком).
⚙️ Настройки:
Trend Length — длина скользящей средней (по умолчанию 10);
Set Targets — дополнительный множитель для расчёта тейков;
Все цели рассчитываются динамически с учётом волатильности (ATR 200).
🔔 Алерты:
Индикатор распознаёт сигналы на:
смену тренда (вверх/вниз),
достижение целей (тейков),
срабатывание стопа.
Можно включить в окне алертов TradingView.
✅ Преимущества:
Полностью автоматический: не требует ручной разметки.
Удобство: уровни и цели отображаются прямо на графике.
Гибкость: можно адаптировать под любую стратегию.
Визуальная ясность: приятные цвета, чистый интерфейс.
📋 Как использовать:
Добавь индикатор на график.
Дождись сигнала смены тренда (треугольник и свеча с цветом тренда).
Вход осуществляется на текущем баре (линия Entry).
Следи за достижением целей T1–T3 или стопа.
Можно использовать алерты для автоматизации.
Переведи на английский

20/40/6020/40/60 candle separator. Three lines only on all timeframes. Range length and height included. Doesn't mess up the scaling. Togglable elements and movable lines.


Fibonacci Optimal Entry Zone [OTE] (Zeiierman)Bitcoin is breaking out of the symmetrical triangle and showing major signs of strength, so we can expect to hit a new all-time high in the short term! Bitcoin was struggling in the past weeks compared to the stock market, but this should end!
Why do I think that the alt season is starting? To answer this question, we need to look at the BTC.D (Bitcoin dominance chart). if BTC.D goes up, that means money is flowing out of altcoins to Bitcoin, and when BTC.D goes down, that means money is flowing from Bitcoin to altcoins. And we want BTC.D to go up! So what is the chart telling us?

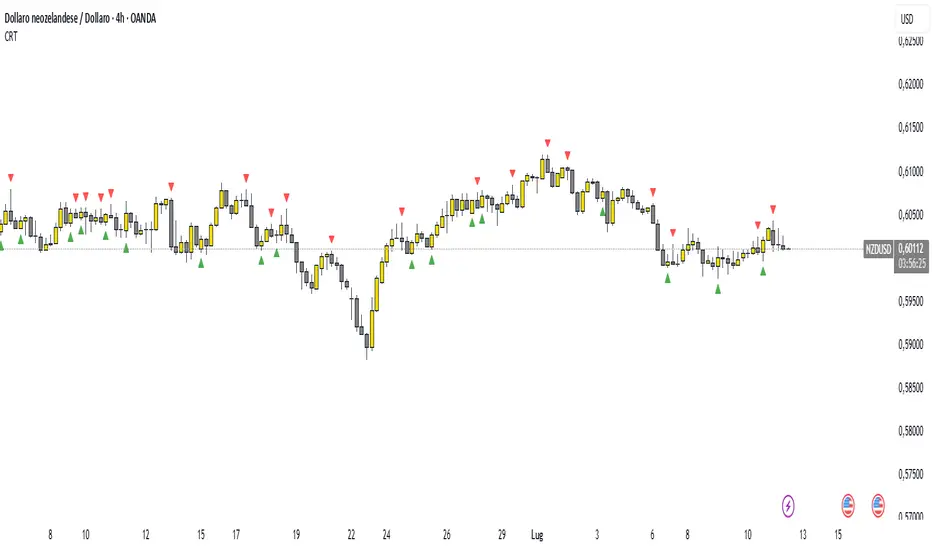
Candle Range Theory (CRT) indicator📌 Indicator Name: Candle Range Theory (CRT) indicator
This indicator detects potential bullish and bearish reversal setups based on specific candlestick price action behavior. It is designed to highlight moments when the market may be rejecting extremes and preparing to reverse direction — but only after confirmation with the closing price.
🔍 How It Works:
Bullish Setup (Long Signal):
The previous candle is bearish (closes lower than it opens).
The current candle makes a lower low than the previous one.
The current candle closes above the previous candle’s close.
Bearish Setup (Short Signal):
The previous candle is bullish (closes higher than it opens).
The current candle makes a higher high than the previous one.
The current candle closes below the previous candle’s close.
Signals are only triggered after the bar is fully closed, to avoid premature entries.
🔔 The script includes alert conditions for both long and short setups so you can receive notifications instantly.
🎥 Inspiration:
The idea for this indicator came from the excellent educational content presented in this video:
"How to Read Candlesticks Like a Pro"
We highly recommend watching it to better understand the price action principles behind this signal.
Strategi FVG 09:31 (Pro)FVG 09:31 Strategy (Pro)
In short, this is an automated trading strategy (bot) for TradingView designed to execute buy or sell orders based on a Fair Value Gap (FVG) pattern. The strategy is highly specific, as it only triggers on the 1-minute timeframe and looks for an FVG that forms precisely at 09:32 AM New York time.
Main Purpose of the Strategy
The primary goal of this script is to identify and capitalize on short-term price imbalances, known as Fair Value Gaps (FVGs). It operates during a specific, high-volatility window right after the U.S. stock market opens, often referred to by traders as the "Silver Bullet" session. By automating the detection and execution, it aims to trade these fleeting opportunities with precision.
How the Strategy Works
The strategy follows a clear, step-by-step logical flow on your chart.
1. Time & Timeframe Restriction
1-Minute Timeframe: The strategy is hard-coded to work only on the 1-minute (1m) chart. A warning label will appear on your chart if you apply it to any other timeframe.
Specific Time Window: The core logic activates only between 09:32 and 09:33 AM New York time. It searches for an FVG pattern formed by the three candles from 09:29, 09:30, and 09:31, with the pattern confirmation happening on the close of the 09:31 candle.
2. Fair Value Gap (FVG) Detection
An FVG is a three-candle pattern that signals a price imbalance.
Bullish FVG (Potential Buy): Occurs when the low of the first candle is higher than the high of the third candle. The space between these two prices is the FVG zone.
Bearish FVG (Potential Sell): Occurs when the high of the first candle is lower than the low of the third candle. The space between these two prices is the FVG zone.
If this pattern is detected at the target time, the strategy draws a colored box on the chart to visualize the FVG zone (aqua for bullish, fuchsia for bearish).
3. Entry Logic
The strategy provides two user-selectable methods for entering a trade:
Retracement (Immediate Entry): The strategy will open a position with a market order as soon as the price retraces back into the identified FVG zone.
For a Bullish FVG, a Long (buy) position is opened when the price drops to touch the upper boundary of the FVG.
For a Bearish FVG, a Short (sell) position is opened when the price rises to touch the lower boundary of the FVG.
Limit Order (Pending Entry): The strategy places a pending limit order at the edge of the FVG zone.
For a Bullish FVG, a Buy Limit order is placed at the upper boundary of the FVG.
For a Bearish FVG, a Sell Limit order is placed at the lower boundary of the FVG.
Order Expiration: If the limit order is not filled within a specified number of candles (default is 15), it is automatically canceled to avoid chasing a stale setup.
4. Exit Logic
Once a position is active, the strategy automatically manages the exit by setting a Take Profit (TP) and Stop Loss (SL) level. You can choose between two types:
Ticks (Fixed Points): You define a fixed profit target and loss limit in ticks (the smallest price movement). For example, a 200-tick TP and a 100-tick SL.
Last Swing (Dynamic Levels): The TP and SL are set dynamically based on the most recent swing high or swing low.
For a Long position: Take Profit is set at the last swing high; Stop Loss is at the last swing low.
For a Short position: Take Profit is set at the last swing low; Stop Loss is at the last swing high.
5. Daily Management
At the start of each new trading day, the script performs a reset. All variables, including any FVG data from the previous day, are cleared. This ensures the strategy only acts on fresh signals from the current day and cancels any pending orders from the day before.
Explanation of Settings (Inputs)
Here is what each user-configurable setting does:
Entry Type: Choose your preferred entry method: Retracement or Limit Order.
Order Expiration (Candles): Applies only to the Limit Order type. Sets how many candles an unfilled order will remain active before being canceled.
Stop Loss Type: Choose Ticks for a fixed-distance stop loss or Last Swing for a dynamic level.
Take Profit Type: Choose Ticks for a fixed-distance profit target or Last Swing for a dynamic level.
Pivot Lookback (SL/TP Swing): Defines how many candles the script looks back to identify the most recent swing high/low for the Last Swing SL/TP type.
Contract Size: The quantity or lot size for each trade.
Take Profit (in Ticks): The profit target distance if using the Ticks type.
Stop Loss (in Ticks): The maximum loss distance if using the Ticks type.

Intelligent Top & Bottom Finder v9.8 Keyvankh📈 Intelligent Top & Bottom Finder v9.8 Keyvankh
A next-generation all-in-one trading system for precise tops, bottoms, and reversals across all timeframes.
---
🟢 Overview
This indicator is a powerful and intelligent solution for detecting market tops and bottoms, key reversals, and S/R zones with institutional-grade accuracy. Designed for traders seeking an edge in any market (crypto, forex, stocks), it combines advanced candlestick recognition, multi-indicator confirmation, smart support/resistance clustering, and strict signal filtering into one seamless tool.
---
🔎 How Does It Work?
1. Advanced Support & Resistance Clustering
Automatically detects and draws high-probability support and resistance zones using dynamic ATR-based pivot clustering.
Highlights breakouts and retest (flip) zones in real-time, adapting to changing market structure.
2. Full Candlestick Pattern Recognition
Scans for 15+ classic and advanced patterns: Engulfing, Pin Bar, Doji, Three Bar, Marubozu, Hammer, Shooting Star, Three White Soldiers, Three Black Crows, Tweezer, Morning/Evening Star, Kicker, Belt Hold, and more.
Scores each pattern’s strength based on location (S/R zone, retest, breakout), volume context, and confirmation signals.
3. Multi-Indicator Confirmation Engine**
Integrates and scores confirmation from up to five additional sources:
RSI Games 1.2** (smoothed LTF momentum shifts)
MACD Divergence** (bullish/bearish momentum reversal)
QQE+ v7 Advanced** (dynamic volatility filter)
OBV Trend Filter** (volume-backed trend validation)
Volume Game** (net volume spike and reversal detection)
Each module can be enabled or disabled to fit your personal trading style.
4. Institutional S/R and Retest Logic
Real-time recognition of major trendline breaks, retest zones, and price flips.
Automatic labeling and coloring of S/R zones, retest boxes, and confirmation candles.
5. Smart Buy & Sell Signal Generation**
Combines all scoring modules with strict logical filters and “failsafe override” logic (guaranteeing signal on confirmed hammers, engulfings, etc. even if other filters disagree).
Plots clear “BUY” and “SELL” labels only when a strong, multi-factor signal appears—minimizing noise and maximizing reliability.
Built-in fallback logic (optional) for edge cases.
6. Alerts & Automation Ready
TradingView alerts for all BUY, SELL, or ANY signal conditions—perfect for auto-trading or notification setups.
---
*⚙️ Customizable Inputs
Enable/Disable any module (RSI Games, MACD, OBV, QQE+, Candlestick Scanner, Volume Game)
Minimum Confirmations** required for a signal (1–10)
Pivot/Zone Sensitivity:** ATR multiplier, pivots per cluster, retest bar duration
LTF (Lower Timeframe) Confirmation:** Fully configurable
---
📊 How To Use**
Apply on any timeframe and symbol**—crypto, stocks, forex, indices.
Use as a **standalone reversal/entry tool** or to confirm your own technical setups.
Combine with your favorite momentum, trend, or volume indicators for advanced confluence.
Set up **TradingView alerts** for auto-trading, Telegram/email notifications, or trade journaling.
---
🟢 What Makes This Unique?
All-in-one multi-indicator fusion:** No more juggling a dozen scripts.
Institutional logic:** Goes beyond basic signals with true S/R, retest, and volume logic.
Full transparency:** Source code is clear and commented (if published open-source).
Fast and reliable:** Optimized for minimal lag and maximum accuracy.
---
⚠️ Disclaimer**
This indicator is a tool to assist with trade timing and risk management. **No system is 100% accurate.** Always use in conjunction with your own analysis and risk management practices.
---
📚 Credits & License**
Created by Keyvan Khodakhah.
You may use, modify, or share this script under the (mozilla.org).
Please credit the original author if you fork or reuse in public.
---
Questions, feedback, or collaboration? Contact: Keyvankh
---
Precision in technical analysis comes from layers of confluence and discipline. This tool brings that precision to your chart.

StarStrat Ceres Strategy [0.3.1]2025ETH 30M Trend Strategy
Retirement strategies, provided free of charge.

HTF Candle Extremes Zigzag (Drawn on LTF)HTF Candle Extremes Zigzag (Drawn on LTF)
This indicator plots zigzag lines connecting the extremes (highs and lows) of Higher Timeframe (HTF) candles directly on your lower timeframe (LTF) chart. It visually highlights trend changes and HTF candle structure by drawing colored lines representing uptrends and downtrends based on HTF candle extremes.
"Key Features"
Higher Timeframe Tracking: Select any HTF to track candle extremes using the built-in security function.
Zigzag Lines: Connects HTF candle lows to highs in an intuitive zigzag pattern.
Trend Indication: Uptrend lines are green, downtrend lines are red (customizable colors).
Customizable Line Width: Adjust the thickness of the zigzag lines for better visibility.
Drawn on Lower Timeframe: All lines appear on your active lower timeframe chart, allowing easy visual correlation.
"How It Works"
The script fetches the open, high, low, close, and time data of the specified HTF candle. It detects new HTF bars and identifies trend direction changes by comparing the highs and lows of consecutive HTF candles.
- When an uptrend is detected, vertical lines are drawn from low to high of the HTF candle, connected to the previous extreme low.
- When a downtrend is detected, vertical lines are drawn from high to low, connected to the previous extreme high.
- Transitions between trends are highlighted by connecting the last extreme of the previous trend to the current extreme, creating a clean zigzag pattern.
Usage Notes:
Ideal for traders who want to visualize HTF market structure and trend changes while analyzing price action on lower timeframes.
---
© The_Forex_Steward
(mozilla.org)

Fair Value Gap & Liquidity Zones [Combined]mixed FVG and buyside and sellside liquidity
xxxxxxxxxxxxxxxxxxxxxxxxxxxxxxxxxxxxxxxxxxxxxxxxxxxxxxxxxxxxxxxxxxxxxxxxxxxxxxxxxx

Multi-TF Candle Pattern Table — last 3 + formingUsing strat pattern, including 4 timeframe, you can directly modify timeframe on code. The up means it is a 2 candle, and separate them between 2U and 2D

Support & Resistance by O Dinesh BabuThis Script is Specifically Designed to Work with NIFTY, BANKNIFTY & FINNIFTY Indices Only..
For Optimal Results, Please Wait for the 1st 15-Minute Candle to Complete Before Initiating Any Trades..
Wishing All Traders the Very Best in Their Journey..
Warm Regards,
O. Dinesh Babu
Son of Mr. & Mrs. O. Asha Rama Krishna

High Selling Point Reversal V6.0Criteria combined for a "High Selling Point" signal: Best used for exiting long positions or entering shorts
Overbought Condition (RSI):
Purpose: Ensures the asset has had a significant run-up and is potentially exhausted.
Criteria: RSI (Relative Strength Index) is above a certain threshold (e.g., 70 or 80).
Bearish Candlestick Reversal Pattern:
Purpose: Identifies specific price action that indicates a shift from buying to selling pressure.
Criteria: We can implement detection for one or more strong bearish patterns. A good starting point would be:
Bearish Engulfing: A bearish candle whose real body completely covers the previous bullish candle's real body. This is a very strong two-candle reversal signal.
Shooting Star: A candle with a small real body at the lower end of the range, a long upper shadow, and little to no lower shadow. It signifies rejection of higher prices.
Evening Star: A three-candle pattern: a large bullish candle, followed by a small-bodied candle (the "star"), and then a large bearish candle. This is a powerful top reversal.
Negative Divergence (Optional but powerful):
Purpose: Indicates weakening momentum despite price continuing to rise, suggesting underlying weakness.
Criteria: Price makes a higher high, but a momentum oscillator (like RSI or MACD) makes a lower high.
Combine with other indicators for confluence

DP_ORB Entry & Exit IndicatorDisclaimer:
This indicator is for educational purposes only. It does not constitute financial advice. Always do your own research and manage your risk. Also, I cannot take full credit for 'ORB' as its a well known strategy amongst many traders, but I do need to give a special shout out to @TheBigDaddyMax for putting me on to this.
DP_ORB Entry & Exit Indicator
Description:
The DP_ORB Entry & Exit Indicator is a powerful tool designed for traders who utilize the Opening Range Breakout (ORB) strategy on the NYSE session. This indicator visually identifies the initial volatility window of the trading day, by marking the 15m High, and 15m Low into a ORB Box, & then tracks breakout opportunities, and provides clear, dynamic trade management levels—all directly on your chart.
Key Features:
Automatic Opening Range (ORB) Box:
Identifies and plots the high and low of the user-defined opening range (default 9:30–9:45 NYSE) for visual reference and strategy foundation.
Breakout Entry Signals:
Automatically detects and marks long or short breakout entries when price closes above or below the ORB range, with additional momentum confirmation.
Dynamic Stop Loss:
Stop loss is intelligently set to the previous bar’s low for long trades (or high for shorts), adapting to market structure at entry.
Take Profit Targets:
Up to three fully adjustable take-profit levels are plotted, calculated as percentages from entry, supporting progressive trade management.
Visual Trade Management:
Entry, stop loss, and take profit levels are displayed as extending dashed lines from entry point to the current bar, with labels always shown just to the right of price for clarity on all timeframes.
Automatic Reset and Cleanup:
Visuals and logic reset daily and upon exit, ensuring a clean, uncluttered chart experience.
How to Use:
Set your preferred opening range time and take profit levels in the settings.
Wait for a breakout and confirmation during the NYSE session.
Use the on-chart lines and labels to manage your trade according to your risk and strategy plan.
Best For:
Day traders and scalpers seeking a disciplined, visual, and fully-automated approach to opening range breakout trading.

Rifaat Ultra Candle AI V2 – Gold M1 Ultimate with MACDScript Overview
This Pine Script is an advanced automated trading strategy designed for the gold market on a 1-minute timeframe. It combines comprehensive candlestick pattern recognition with popular technical indicators — including EMA, RSI, ATR, and MACD — to generate reliable buy and sell signals.
Main Features
Comprehensive Candlestick Pattern Recognition
The script detects more than 50 worldwide known candlestick patterns. These include:
Single candle patterns: Hammer, Shooting Star, Doji variants, Marubozu, etc.
Double candle patterns: Bullish/Bearish Engulfing, Harami, Piercing Line, Dark Cloud Cover, etc.
Triple candle patterns: Morning Star, Evening Star, Three White Soldiers, Three Black Crows, etc.
Other rare and complex patterns like Tweezers, Counter Attack, Tasuki Gap, Mat Hold, Deliberation, and more.
Trend Filters
EMA200 Trend Filter: The script checks the current price relative to the 200-period Exponential Moving Average (EMA) to determine if the market is bullish or bearish.
RSI Filter: Uses the Relative Strength Index (RSI) to confirm momentum (default threshold is 50).
MACD Filter: Adds a condition where buy signals require the MACD line to be above its signal line, and sell signals require the MACD line below its signal line.
Entry and Exit Logic
Entry Conditions: Combines candlestick signals with trend and momentum filters for precise entries.
Stop Loss and Take Profit: Uses the Average True Range (ATR) dynamically to set stop loss and three levels of take profit.
Trailing Stop: Optional trailing stop feature with customizable parameters to protect profits.
The strategy entries and exits split the position size into parts for scaling out (TP1: 50%, TP2: 30%, TP3: 20%).
Visual Aids on Chart
When enabled, the script plots dashed lines for Stop Loss and each Take Profit level on the chart for clear visual guidance.
User Configurable Inputs
You can toggle on/off:
Use of ATR for TP/SL calculation
RSI filter
EMA trend filter
MACD filter
Display of TP/SL lines
Trailing stop feature and its parameters
How It Works
Candlestick Analysis:
The script evaluates the latest candles for a variety of bullish and bearish patterns. When it detects a strong bullish pattern, it looks for trend confirmation via EMA200 and momentum via RSI and MACD before placing a buy order. The same logic applies inversely for bearish patterns and sell orders.
Dynamic Risk Management:
Stop loss and take profit targets are calculated based on ATR, adapting to current market volatility. The trailing stop locks in profits as the price moves favorably.
Strategy Execution:
Orders are placed automatically when conditions meet. Partial exits at TP1 and TP2 secure profits early, and the trailing stop on TP3 attempts to maximize gains.
Suitable For
Traders looking for an institutional-level automated strategy that combines price action (candlestick patterns) with key technical indicators.
Scalpers and short-term traders focusing on gold (XAUUSD) on a 1-minute timeframe.
Users who want configurable filters and clear visual cues to optimize entries and exits.

Break & Retest Strategy V2 (Clean Visuals)This strategy is built on a high-probability EMA breakout and retest model, designed for traders who want clean structure-based entries filtered by trend alignment and strong price action. It leverages:
• ✅ A 44 EMA trend filter on the 4H chart
• ✅ HTF directional bias from the Daily 44 EMA
• ✅ Breakout above the EMA followed by a wick-based retest
• ✅ Strong bullish candle confirmation (body > 50% of range)
• ✅ Dynamic stop loss using either the pivot low or a buffer below the EMA
• ✅ Fixed 1:3 Risk:Reward ratio for consistent reward targeting
• ✅ Cooldown system to prevent overtrading
• ✅ Clean, minimal visuals using smart RR boxes instead of chart clutter
This system is fully backtestable and designed with prop firm challenge criteria in mind — prioritizing risk control, clarity, and high-quality trade conditions.
⸻
🔧 Current Development Goals (V3 Roadmap)
We’re actively refining the system to improve win rate and profit factor, while keeping drawdown low. Key upgrades in progress:
1. 📈 Liquidity Trap Filter
• Add logic to confirm a wick below recent lows (liquidity sweep) before retesting the EMA
2. 🧠 Partial Take Profits + Breakeven Logic
• TP1 at 1.5R → move SL to breakeven
• TP2 at 3R → close remaining position
3. 🔁 Trade Session Filter
• Limit entries to London & New York AM sessions to avoid false signals in low volume periods
4. 📉 Short Entry Engine
• Mirror logic for bearish break + retest setups below the EMA
5. 🔔 Live Alerts System
• Entry signal alerts for hands-free, real-time trading decisions
6. 📊 Optimizer Toolkit (future)
• Add ATR/volatility filters
• Add market structure confluence zones (HH/HL filters)
• Smart cooldown timer based on wins/losses or volatility shifts

Smart Impulse Exhaustion Finder (ATR + ADX Filter)
Smart Impulse Exhaustion Finder (ATR + ADX Filter)
This advanced script helps you spot potential trend exhaustion points exactly where impulsive moves may lose strength.
It automatically combines multiple conditions:
✅ Identifies fresh swing highs and lows using a smart lookback range.
✅ Confirms strong price extension with a minimum ATR distance from the previous swing.
✅ Uses RSI extremes, volume spikes, and candle wick rejection to detect signals only when at least two out of three exhaustion factors align.
✅ Filters out false signals during sideways chop using an ADX trend strength filter.
✅ Ignores noise candles like dojis by requiring a clear minimum body size.
This makes the tool flexible for catching late-stage trend impulses that might be due for a pullback or reversal — ideal for trailing stop strategies, partial profit taking, or hunting reversal setups on crypto, forex or stocks.
How to use
📌 Tip: This is a sniper-type tool that can catch the very start of a reversal.
Therefore, when trading its signals, it’s strongly recommended to use a Risk:Reward ratio of at least 1:3 — especially for crypto markets.
The idea is simple:
Look for exhaustion signals at fresh swing highs for potential short pullbacks.
Or at fresh swing lows for potential long reversals.
Combine with your own trend and context tools.
Always test thoroughly before live trading.
Inputs
🔹 Extremum Lookback: Defines how far back to check for fresh highs/lows.
🔹 ATR Threshold: Controls the minimum impulse distance.
🔹 ADX Filter: Ensures signals only appear in meaningful trending conditions.
🔹 Body and Wick Filters: Reduce noise by rejecting tiny candles and highlighting clear rejection tails.
Disclaimer
⚠️ This script is for educational purposes only and does not constitute financial advice.
Trade responsibly — always use proper risk management and test before deploying in live conditions.

EMA Pullback + Smart Breakout SystemSaint James
Your script filters for:
Strong trend (EMA stack)
Healthy dip (pullback to 21 EMA)
Breakout candle
Strong volume confirmation
And labels it clearly so you can act on it quickly for option trades.
