Previous Levels - CA23📌 Indicator: Previous Levels – CA23
Description:
“Previous Levels – CA23” is a powerful multi-timeframe utility tool designed to automatically plot the Open, High, Low, and Close (OHLC) levels from up to 6 higher timeframes (HTFs) directly onto your chart. These levels serve as key reference points for support, resistance, liquidity grabs, or institutional price reactions, helping you spot high-probability areas for entries, exits, and trade management.
Whether you’re a scalper on the 1-minute chart or a swing trader using daily or weekly levels, this indicator provides precise historical price levels with full customization options.
⸻
⚙️ Features:
• ✅ Plot OHLC levels from up to 6 different HTFs (e.g., 15m, 1H, 4H, Daily, Weekly, Monthly).
• ✅ Display customizable labels for each level (e.g., “Previous”, “OHLC”, “Price”, “Date/Time”, or custom symbols).
• ✅ Trace historical extensions of each level to the left (ghost line) for improved backtesting and structure analysis.
• ✅ Fade colors of levels far from current price using an ATR proximity filter, for better visual focus.
• ✅ Works across all markets: futures, crypto, forex, stocks.
⸻
🧩 Customization Options:
🔹 HTF Levels:
For each HTF (1–6), you can:
• Enable or disable the level
• Set the timeframe (e.g., 15m, 1H, 4H, Daily…)
• Limit how many previous bars to display
• Choose which OHLC values to show: Open, High, Low, Close
• Customize color, line style (solid, dashed, dotted), and line thickness
• Show a vertical start marker for each level
• Enable trace-back lines to show level history
🔹 Labeling System:
• Toggle labels on/off
• Choose text color, background color, and label size
• Build labels using up to 9 elements:
• Interval, OHLC type, “Previous”, Price, Date, Symbols (like • or ◆), etc.
• Full flexibility to format the text shown next to each level
🔹 Layout & Display:
• Offset levels forward/backward in time to declutter chart
• Control vertical spacing between stacked HTF levels
• Hide levels on higher timeframes if needed
🔹 Advanced:
• Fade out levels if price is too far (based on ATR × factor)
• Select fade transparency percentage and ATR length
⸻
🧠 Use Cases:
• Identify institutional levels like daily/weekly highs/lows
• Backtest reactions to previous highs/lows
• Detect liquidity zones or breaker blocks
• Combine with ICT, SMC, or supply/demand strategies
• Confluence with killzones and session ranges
⸻
📎 Notes:
• Optimized for performance and clean chart display
• Compatible with both light and dark modes
• Maximum customization for experienced traders
• Created by ca23
Candlestick analysis

[CRYPTOLABS] BTC MinuteMaster (OBV + RSI + VWAP + ORDERBLOCKS) BTC MinuteMaster (OBV + RSI + VWAP + Orderblocks)
The BTC MinuteMaster by Cryptolabs is designed specifically for precise intraday and scalping strategies on Bitcoin (BTCUSD). This indicator combines four proven market techniques into one compact, modular tool:
✅ VWAP Deviation Bands
Calculates volume-weighted average price (VWAP) with standard deviation bands to identify short-term overbought/oversold zones and potential mean-reversion areas.
✅ OBV-based RSI (OBV RSI)
A custom RSI that evaluates On-Balance Volume (OBV) instead of price. The OBV RSI provides early signals for momentum shifts, especially when volume divergences occur. Custom-level alerts help identify extremes efficiently.
✅ Automatic Orderblock Detection (S/R Levels)
Automatically detects bullish and bearish orderblocks based on key pivot levels, combined with volatility filters. Helps visualize relevant support and resistance areas with precision.
🔑 Use Cases:
-> Intraday / Minute Trading (best suited for 1m – 15m timeframes)
-> Mean-Reversion / Momentum-based Setups
-> Support for Orderblock & S/R Identification
📌 Technical Highlights:
-> Volume-based (OBV / VWAP)
-> Multi-framework indicator (Price / Volume / Structure)
-> No repainting, no lagging signals
⚠️ Disclaimer:
Our "BTC MinuteMaster" is not an automated trading system. It is a supporting tool for discretionary analysis. For best results, combine it with Price Action and Liquidity-based strategies.

Candle Revers Indicator by MathbotThe Candle Reverse indicator detects and highlights every reversal candle on the chart, helping traders identify potential turning points in the market with precision.
Developed by Mathbot SRL, this tool is designed to enhance decision-making for both manual and algorithmic traders.
Learn more at: www.mathbot-ea.pro

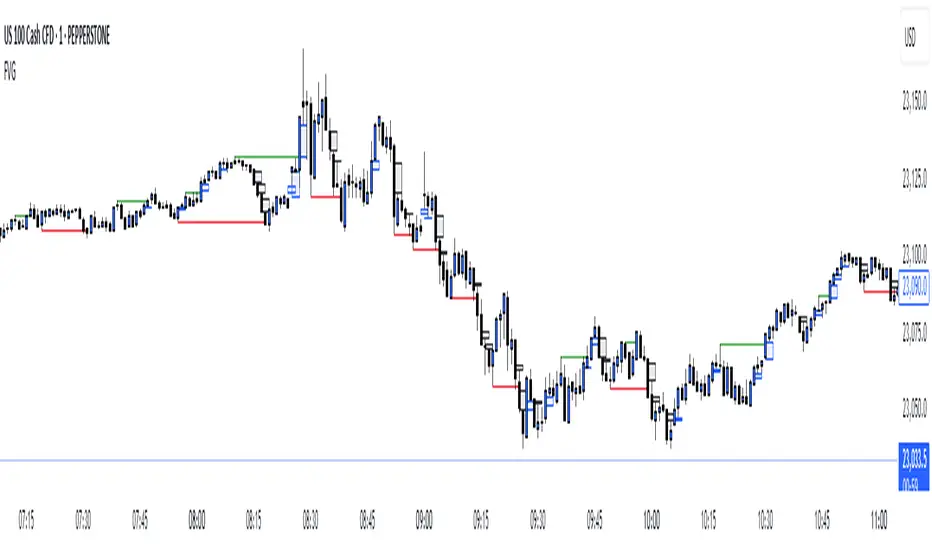
Advanced VWAP & FVG with ICT Market Structure by NabsAdvanced VWAP & FVG with ICT Market Structure by Nabs

Momentum Candlestick TerakhirThis indicator helps traders identify where the last momentum candle occurred.
It also provides a Multi-Timeframe Table that displays the most recent momentum candle for each timeframe.
for entry, if weekly's current momentum is momentum buy, timeframe h4 also must be momentum buy.
weekly - H4
Daily - H1
H4 - M30
H1 - M15
weekly - 300/500 pips
daily - 100/150 pips
H4 - 70/80 pips
H1 - 20/30 pips

S/R Levels with Breaks v 1.0.0725 [JayKay]Support and Resistance Levels with Break Alerts
This script identifies high-probability support and resistance levels based on pivot structures and highlights breakout conditions when accompanied by strong volume momentum. Designed specifically for 15-minute charts, it is ideal for intraday traders looking for clean, actionable levels with visual break alerts.
Key Features:
Automatic S/R Detection: Uses pivot-based logic to plot horizontal support and resistance lines at significant price turning points.
Break Confirmation: Highlights bullish and bearish breaks only when price breaches S/R levels with volume confirmation.
Volume Oscillator Filter: Validates breakout strength using a short-term vs long-term volume EMA oscillator.
Bull & Bear Wick Signals: Detects failed breakout attempts (false moves) using candle wick analysis.
15-Minute Chart Restriction: Plots S/R lines and signals only on the 15-minute timeframe to maintain precision and avoid noise.
Custom Alerts: Get notified when a resistance or support level is broken under strong volume.
This tool is best suited for traders who want clear, rule-based levels combined with breakout logic for disciplined trade setups.

Momentum Candle (XAUUSD)Alert & label, candle momentum 50-200 pips. Red bearish candle, green bullish candle.

Multi-Pair Matrix📊 Multi-Pair Matrix — Strategy Overview
This invite-only strategy works across five major crypto pairs: BTC, ETH, XRP, DOT, and SOL. It combines multiple confirmation signals and risk-management tools into one unified script.
🔍 Core Logic
The strategy uses a combination of proven technical tools:
Price Action Patterns: Breakouts, rejections, and reversal zones
EMA Crossovers: Short- and long-term trend confirmation
Stochastic Oscillator: Identifies exhaustion and entry opportunities
MACD Histogram: Filters entries by confirming directional momentum
Dynamic SL/TP Logic: Each trade has an independent stop-loss and take-profit based on market conditions
Delayed Entry System: Prevents immediate re-entry after closing in the opposite direction
Smart Trailing Stop-Loss: Adjusts as price moves to secure gains
⚙️ Capital Allocation & Pyramiding
The strategy uses strategy.percent_of_equity = 100, but only ~10% margin is used per position
This leaves headroom for controlled pyramiding without risking full account exposure
🔁 Recommended Pyramiding Settings per Pair
Pair -Pyramiding
BTC - 6
ETH - 6
XRP - 8
DOT - 5
SOL - 7
🧪 Backtest Conditions
Commission: 0.1% per trade
Slippage: 3 ticks
Capital: realistic margin use per trade
Pair displayed in this publication: XRP
This pair is shown in the current backtest example due to platform limitations
The remaining pairs follow the same internal logic and backtest methodology, but are not visible in a single report
⚠️ Usage Instructions
To use this script for real-time alerts:
Open the Inputs tab and enable “Live Trading Mode”
Choose your desired pair from the dropdown — this will automatically apply the correct settings
The script is designed for lower timeframe markets and is optimized for high-activity, volatile periods
All logic is contained in a single script as required — no suite publishing or duplicated variations

GALAXY INDICATOR v2✅ Features:
📊 Entry Signal: RTI contraction followed by RTI = 100 breakout (high momentum)
🛑 Stoploss: Based on breakout candle low
🎯 Target: Risk–Reward based (customizable RR ratio)
🔁 Trailing Stoploss: Optional SL trail below 50 EMA
🔎 EMA Alignment Check: 10 EMA > 20 EMA > 50 EMA required for trade
📈 Real-time Trade Table: Entry, SL, Target, Quantity, Profit/Loss shown on chart
🔔 Entry/Exit Alerts (ready-to-use for automation or notifications)
🟠 Orange Dot Detection: Identifies RTI contraction zones (low volatility buildup)
💡 Optimized for intraday & swing trading across all segments
📌 Ideal For:
Traders who prefer confirmation-based breakouts
Those looking for volume-backed entries
Trend followers who avoid noise and false signals

[Teyo69] T1 Short & Long Covering📘 Overview
The Short & Long Covering indicator is designed to help traders detect potential absorption candles and short-covering traps using a combination of normalized volume behavior and price exhaustion logic.
It visualizes possible long opportunities after sell-offs and short traps after price rallies—ideal for traders who want to anticipate reversals based on volume structure.
🧩 Features
📈 Detects rising price with falling volume → potential short covering
📉 Detects falling price with falling volume → potential long absorption
🔍 Flags volume spike conditions using normalized volume vs MA
🔵 Plots “L” (Long Covering) below bars
🔴 Plots “S” (Short Trap) above bars
Customizable pivot lookback and exhaustion period
⚙️ How to Use
Use "L" markers as possible long re-entry points after shakeouts
Use "S" markers to watch for failed rallies or bull traps
Combine with S/R zones or trend filters to confirm
Works well in conjunction with Wyckoff-style market logic or volume spread analysis (VSA)
🔧 Configuration
Price movement Lookback: Sets how many bars to compare for trend detection
Exhaustion Lookback: Defines the recent window to confirm price is exhausted
Normalized Volume MA Length: Used to determine volume spikes relative to average
⚠️ Limitations
Not a standalone signal — should be used with confluence (e.g., support/resistance, trend filters)
Best for spotting potential reversals, not trend-following entries
May generate false signals in low volume chop or news spikes
💡 Advanced Tips
Combine with a trend filter like appropriate EMA to avoid counter-trend setups
Use with a support/resistance script to find confluence zones
Watch for clustered L/S signals — multiple signals in a zone may show strong absorption or distribution
📝 Notes
Signal logic is based on volume exhaustion and price movement divergence
Normalized volume helps compare relative volume across time
“Spike” condition triggers only when volume exceeds 100% of its moving average
🚫 Disclaimer
This script is for educational purposes only. It does not constitute financial advice. Always do your own research and use proper risk management.

Liquidity Hunter ProLiquidity Hunter Pro
The Liquidity Hunter Pro is an indicator designed to identify a specific, high-probability trading setup based on the concept of institutional liquidity hunts. The core philosophy is that major market moves are often initiated after large players engineer liquidity by sweeping obvious swing highs or lows, tricking retail traders before revealing their true direction.
This tool automates the detection of this entire sequence, acting as your assistant to filter out market noise and highlight moments of clear institutional intent. It's designed for precision on lower timeframes (like M1) but is fully customizable for any trading style.
Key Features
Multi-Timeframe (MTF) Bias: A simple, on-chart panel shows you the dominant trend from a higher timeframe (default: 15min). This acts as your master filter, ensuring you always trade with the larger market flow.
Intelligent Sweep Detection: Instead of flagging every minor break, the LHP identifies significant liquidity sweeps below/above confirmed swing points, marking them with a minimalist 🧹 icon.
Momentum-Filtered CHoCH: A simple break of structure isn't enough. A Change of Character (CHoCH) is only confirmed if the breakout candle has strong momentum, filtering out weak and indecisive reversals.
Clear Visual Cues: The indicator plots clean, minimalist lines for both the swept level (dashed) and the CHoCH confirmation (solid), giving you a clear visual map of the setup.
High-Probability FVG Detection: Automatically highlights Fair Value Gaps (FVGs) that are created during the powerful CHoCH move, pinpointing an A+ entry zone.
Customizable Alerts: Never miss a setup. Set alerts for two key events: an early warning on a Liquidity Sweep and the main Setup Ready alert once a sweep is confirmed by a CHoCH.
How to Use: The Optimal Entry Method (A Quick Guide)
The "Liquidity Hunter Pro" is designed to be used with a disciplined, step-by-step approach.
Step 1: Follow the Bias
Look at the HTF Bias Panel in the top-right corner.
If BULLISH, you are ONLY looking for long (buy) setups.
If BEARISH, you are ONLY looking for short (sell) setups.
Step 2: Wait for the Sweep (The Trigger)
Patiently wait for the indicator to plot the 🧹 icon and a dashed horizontal line. This signals that liquidity has been taken and a potential setup is forming.
Step 3: Get Confirmation (The Validation)
You must wait for the indicator to print the solid horizontal CHoCH line and label. This validates that the reversal after the sweep has strength. If no CHoCH appears, the setup is invalid.
Step 4: Identify Your Point of Interest (The Entry Zone)
Once the CHoCH is confirmed, it's time to find your entry.
A+ Entry: The indicator will automatically draw a colored FVG Box if a valid one is created. This is your highest-probability entry zone.
B+ Entry: If no FVG appears, your next best entry zone is the "Inducement Order Block" (the last opposite-colored candle right before the sweep occurred).
*** DISCLAIMER ***
This indicator is a tool for analysis and education; it is not financial advice or a signal service. Trading financial markets involves substantial risk and is not suitable for every investor. Past performance is not indicative of future results. Always use proper risk management and never risk more than you are prepared to lose. The author is not responsible for any profits or losses that may result from using this tool.

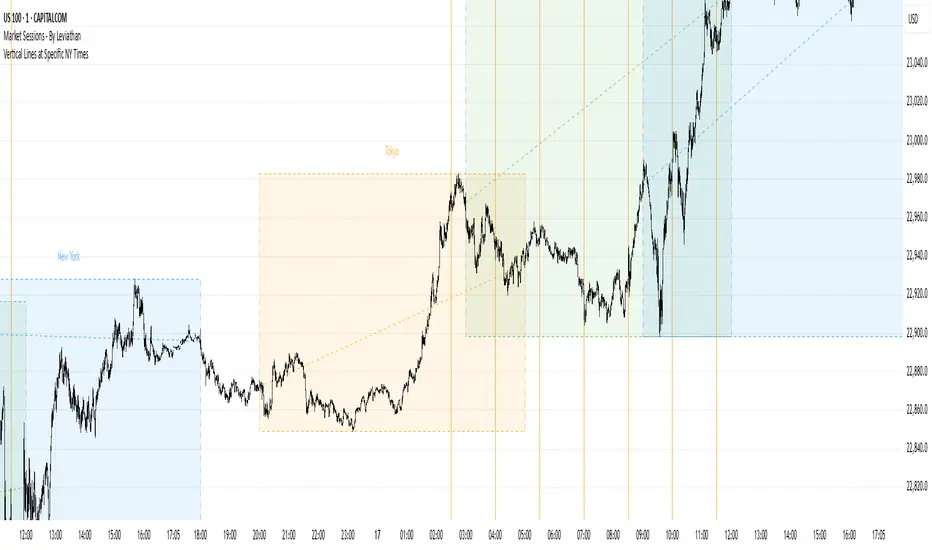
Vertical Lines at Specific NY Timesthese time zones indicates london session and new york session accumulation manipulation and distribution at than spesific time zones
Alinhamento H1 + H4 com Fundo Colorido MACD Alignment Strategy: H1 + H4
This script highlights candles on the H1 chart with a colored background when there's full alignment between H1 and H4 based on the classic MACD (12,26,9) and EMA 200.
✅ Bullish background (green):
Price is above the EMA 200 on both H1 and H4
On both H1 and H4:
MACD line is above the Signal line
Histogram is green and above zero
MACD is above zero
❌ Bearish background (red):
Price is below the EMA 200 on both H1 and H4
On both H1 and H4:
MACD line is below the Signal line
Histogram is red and below zero
MACD is below zero
Use this tool to visually confirm trend alignment between timeframes and filter high-probability entries.


Swing ReversalSwing Reversal — Indicator Description
What is the Swing Reversal Indicator?
The Swing Reversal indicator is designed to identify high-probability price rejection zones that could mark the beginning of a short- to medium-term reversal. It is based on technical price action patterns, momentum analysis, and volume behavior.
Rather than relying on trend-following signals, this tool looks for localized reversals that occur after failed breakouts or exhaustion moves — typically seen as wick-heavy rejection candles that sweep liquidity and then sharply reverse.
How Does It Work?
The Swing Reversal indicator analyzes a combination of price structure, candle behavior, momentum, and market participation to detect potential reversal points in the market.
It identifies candles that exhibit key characteristics of rejection and liquidity sweeps — commonly seen during turning points in swing trends. These candles are typically marked by:
A sharp rejection of price in one direction
A localized break of recent structure
Subtle shifts in momentum and volume
The indicator uses multiple filters to reduce noise and ensure that signals are based on meaningful price action, not random wicks or volatility spikes.
All signal logic is parameterized — allowing you to fine-tune the detection sensitivity to match the behavior of different assets or market conditions.
Best Used On:
This is a swing-based tool — not intended for scalping or ultra-short-term trading.
📌 For best results, use it on:
1H, 2H, 4H, 12H
Daily and 3D
It performs best when paired with:
Support/resistance zones
Trendline or structure analysis
Momentum confirmation (e.g., divergence, breakout follow-through)
⚠️ Caution
This indicator does not predict tops or bottoms. It identifies technical conditions for potential reversals, and should always be used with confirmation and sound risk management.
Here are some usecases:

Tradinguia.com Advanced Market Intelligence
Revolutionary Trading Technology
Represents a breakthrough in technical analysis, utilizing proprietary geometric algorithms combined with adaptive machine learning to identify high-probability trade setups. This is not your typical indicator - it's a complete market intelligence system.
What Makes SmartFlow Pro Unique
🔬 Advanced Mathematical Foundation
Proprietary Geometric Analysis: Uses advanced mathematical concepts to create dynamic market zones
Multi-Dimensional Calculations: Processes price action through sophisticated spatial algorithms
Adaptive Intelligence: Self-learning system that continuously optimizes performance
Zero-Lag Architecture: Real-time analysis without traditional indicator delays
Core Methodology
SmartFlow Pro employs a three-tier analytical framework:
Structural Recognition Engine: Identifies key market geometry patterns using proprietary pivot detection
Dynamic Zone Mapping: Creates intelligent support/resistance areas that adapt to market volatility
Probabilistic Signal Generation: Combines multiple validation layers for high-confidence trade signals
Signal Intelligence
LONG Signals: Generated when multiple geometric and probabilistic conditions align for bullish momentum
SHORT Signals: Triggered by convergence of bearish structural and statistical factors
Smart Filtering: Advanced validation system eliminates low-probability setups
Adaptive Timing: Machine learning component optimizes entry timing based on historical patterns
Key Advantages Over Traditional Indicators
✅ No Moving Averages: Eliminates lag associated with traditional trend indicators
✅ Dynamic Adaptation: Automatically adjusts to changing market conditions
✅ Multi-Market Compatibility: Optimized for Forex, Stocks, Crypto, and Commodities
✅ All Timeframe Support: Effective from 1-minute to monthly charts
✅ Institutional-Grade Logic: Professional-level analytical framework
✅ 100% Original Code: Completely proprietary algorithm with no built-in dependencies
Optimal Usage Scenarios
Primary Applications
Swing Trading: Exceptional for 4H to Daily timeframes
Trend Reversal Detection: Early identification of momentum shifts
Breakout Confirmation: Validates genuine breakouts vs. false signals
Risk Management: Clear entry/exit levels for position sizing
Market Conditions
Trending Markets: Captures momentum continuation setups
Consolidating Markets: Identifies range breakout opportunities
Volatile Markets: Filters noise while maintaining signal accuracy
All Market Sessions: Performs consistently across different trading sessions
Technical Specifications
Algorithm Type: Proprietary geometric and statistical hybrid
Calculation Method: Multi-layered mathematical analysis
Signal Generation: Probabilistic convergence model
Optimization: Machine learning adaptive framework
Code Base: 100% original, no built-in functions used
Professional Disclaimer
SmartFlow Pro is designed for experienced traders who understand market dynamics and risk management. The advanced nature of this indicator requires proper education in its application. Past performance does not guarantee future results.
Experience the Next Generation of Technical Analysis
Where Advanced Mathematics Meets Market Intelligence

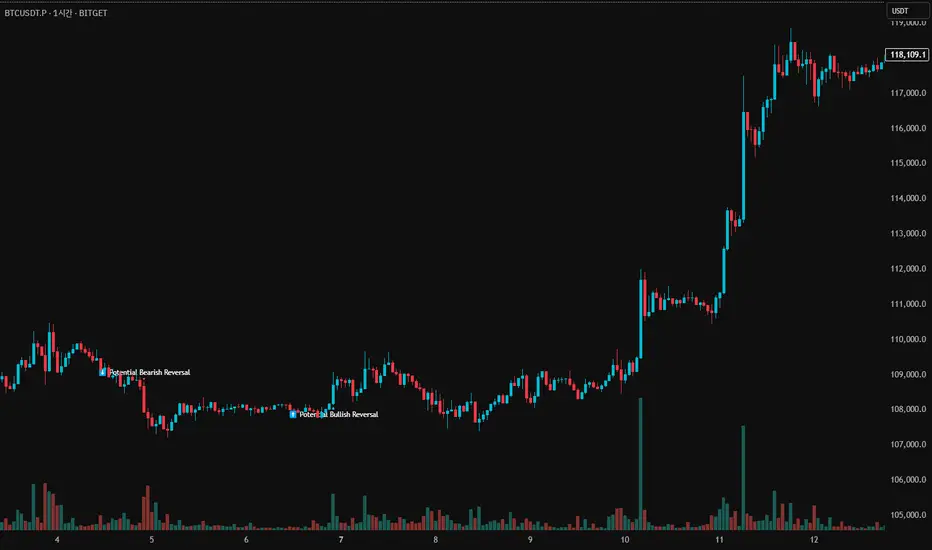
52SIGNAL RECIPE Market Structure Reversal Signals═══ 52SIGNAL RECIPE Market Structure Reversal Signals ═══
◆ Overview
52SIGNAL RECIPE Market Structure Reversal Signals is a technical indicator designed to detect structural changes in price charts and identify potential trend reversals. By tracking highs and lows over a specified period, this indicator provides clear visual signals when significant price breakouts occur, helping traders capture directional changes in the market early.
─────────────────────────────────────
◆ Key Features
• Structural Reversal Detection: Provides potential trend change signals when price breaks through recent N-day highs/lows
• Duplicate Signal Prevention: Filters out consecutive signals in the same direction
• Intuitive Visualization: Clearly distinguishes bullish/bearish reversal signals by color and position on the chart
• Confirmed Bar Based: Generates signals only after bars are completely closed, enhancing reliability
• Customizable Settings: Adjustable tracking period to optimize for various market environments and timeframes
─────────────────────────────────────
◆ Technical Foundation
■ Market Structure Analysis Principle
• High/Low Tracking: Identifies previous highs (LH) and lows (HL) over the specified period
• Structural Breakout: Interprets as structural change when closing price breaks above previous high or below previous low
• Confirmed Bar Verification: Minimizes false signals by generating signals only after the current bar has completely closed
■ Signal Filtering Mechanism
• Signal State Tracking: Prevents duplicate signals by tracking the direction of the last generated signal
• Directional Change Focus: Suppresses signals in the same direction until an opposite signal occurs
• Noise Reduction: Focuses only on important level breakouts, eliminating unnecessary signals
─────────────────────────────────────
◆ Practical Applications
■ Trend Reversal Point Identification
• Bullish Trend Starting Point:
▶ When bullish reversal signal occurs after a downtrend
▶ When upward momentum is confirmed by breaking previous high
• Bearish Trend Starting Point:
▶ When bearish reversal signal occurs after an uptrend
▶ When downward momentum is confirmed by breaking below previous low
• Range Breakout Detection:
▶ Potential trend formation signals when breaking upper/lower boundaries in a ranging market
■ Trading Strategy Application
• Trend Following Strategy:
▶ Consider buy entry when bullish reversal signal occurs
▶ Consider sell entry when bearish reversal signal occurs
• Reversal Trading:
▶ Signals occurring at support/resistance levels provide high-probability entry points
▶ Reversal signals in overbought/oversold conditions strengthen trend reversal possibility
• Risk Management:
▶ Consider closing or reducing positions when opposite signals occur
▶ Set precise stop-loss points by combining with key technical levels
─────────────────────────────────────
◆ Advanced Setting Options
■ Tracking Period (N-day) Adjustment
• Short-term Setting: 10-15 days (sensitive signals, quick reaction, suitable for short-term trading)
• Medium-term Setting: 20-30 days (balanced signals, general trend detection, recommended default)
• Long-term Setting: 40-50 days (strong filtering, detects only major trend reversals, suitable for long-term investment)
■ Timeframe Optimization
• Daily Chart: 20-30 day setting (medium-term trend change detection)
• 4-Hour Chart: 30-40 setting (short-term swing trading signals)
• Hourly Chart: 40-50 setting (intraday trend change detection)
• Intraday Chart: 10-20 setting (scalping and short-term trading)
■ Market Type Adjustment
• High Volatility Markets: Higher N values (30-50) to filter noise
• Trending Markets: Medium N values (20-30) to capture only major reversals
• Ranging Markets: Lower N values (10-20) to capture range-bound movements
─────────────────────────────────────
◆ Synergy with Other Indicators
• Moving Averages: Signal strength enhanced when Market Structure Reversal Signals align with key moving average crossovers
• RSI: Market Structure Reversal Signals occurring at overbought/oversold levels increase reversal probability
• Volume Indicators: Market Structure Reversal Signals accompanied by high volume enhance reliability
• Fibonacci Levels: Market Structure Reversal Signals occurring at key Fibonacci levels provide important turning points
• Channel Indicators: Powerful breakout confirmation when price channel upper/lower breakthroughs coincide with Market Structure Reversal Signals
─────────────────────────────────────
◆ Conclusion
52SIGNAL RECIPE Market Structure Reversal Signals objectively identifies structural changes in the market and clearly visualizes potential trend reversal points. Its simple yet powerful approach of detecting directional changes through recent N-day high/low breakouts provides flexibility applicable to various market environments and trading styles. The duplicate signal prevention mechanism and confirmed bar-based signal generation greatly enhance signal quality and reliability. When combined with other technical indicators, synergy effects can be maximized, providing traders with a valuable tool to capture market turning points early.
─────────────────────────────────────
※ Disclaimer: Past performance does not guarantee future results. Always use appropriate risk management strategies.
═══ 52SIGNAL RECIPE Market Structure Reversal Signals ═══
◆ 개요
52SIGNAL RECIPE Market Structure Reversal Signals는 가격 차트의 구조적 변화를 감지하여 잠재적인 추세 반전을 식별하는 기술적 지표입니다. 이 지표는 최근 N일 동안의 고점과 저점을 추적하여 의미 있는 가격 돌파가 발생할 때 명확한 시각적 신호를 제공함으로써, 트레이더가 시장의 방향성 변화를 조기에 포착할 수 있도록 도와줍니다.
─────────────────────────────────────
◆ 주요 특징
• 구조적 반전 탐지: 가격이 최근 N일 고점/저점을 돌파할 때 잠재적 추세 변화 신호 제공
• 중복 신호 방지: 동일한 방향의 신호가 연속으로 반복되지 않도록 필터링
• 직관적인 시각화: 상승/하락 반전 신호를 차트 상에서 색상과 위치로 명확히 구분
• 확정 봉 기반: 봉이 완전히 종료된 후에만 신호 생성하여 신뢰도 향상
• 사용자 정의 설정: 추적 기간을 조정하여 다양한 시장 환경과 타임프레임에 최적화 가능
─────────────────────────────────────
◆ 기술적 기반
■ 시장 구조 분석 원리
• 고점/저점 추적: 지정된 기간 동안의 이전 고점(LH)과 저점(HL) 식별
• 구조적 돌파: 종가가 이전 고점을 상향 돌파하거나 이전 저점을 하향 돌파할 때 구조적 변화로 해석
• 확정 봉 검증: 현재 봉이 완전히 종료된 후에만 신호 생성하여 오신호 최소화
■ 신호 필터링 메커니즘
• 신호 상태 저장: 마지막 생성된 신호의 방향을 추적하여 동일 방향 신호 중복 방지
• 방향성 전환 초점: 반대 방향 신호가 발생할 때까지 동일 방향 신호 억제
• 노이즈 감소: 중요 수준 돌파에만 집중하여 불필요한 신호 제거
─────────────────────────────────────
◆ 실용적 응용
■ 추세 전환점 식별
• 상승 추세 시작점:
▶ 하락 추세 후 상승 반전 신호 발생 시
▶ 이전 고점 돌파로 상승 모멘텀 확인 시
• 하락 추세 시작점:
▶ 상승 추세 후 하락 반전 신호 발생 시
▶ 이전 저점 이탈로 하락 모멘텀 확인 시
• 범위 돌파 감지:
▶ 횡보 시장에서 상/하 경계 돌파 시 잠재적 추세 형성 신호
■ 트레이딩 전략 적용
• 추세 추종 전략:
▶ 상승 반전 신호 발생 시 매수 진입 고려
▶ 하락 반전 신호 발생 시 매도 진입 고려
• 반전 트레이딩:
▶ 지지/저항 수준에서 반전 신호 발생 시 높은 확률의 진입점 제공
▶ 과매수/과매도 상태에서의 반전 신호는 추세 전환 가능성 강화
• 리스크 관리:
▶ 반대 방향 신호 발생 시 포지션 종료 또는 축소 고려
▶ 주요 기술적 수준과 결합하여 정밀한 손절점 설정 가능
─────────────────────────────────────
◆ 고급 설정 옵션
■ 추적 기간(N일) 조정
• 단기 설정: 10-15일 (민감한 신호, 빠른 반응, 단기 트레이딩에 적합)
• 중기 설정: 20-30일 (균형 잡힌 신호, 일반적 추세 감지, 기본 권장)
• 장기 설정: 40-50일 (강한 필터링, 주요 추세 전환만 감지, 장기 투자에 적합)
■ 타임프레임별 최적화
• 일봉 차트: 20-30일 설정 (중기 추세 변화 감지)
• 4시간 차트: 30-40 설정 (단기 스윙 트레이딩 신호)
• 시간봉 차트: 40-50 설정 (일중 추세 변화 감지)
• 일중 차트: 10-20 설정 (스캘핑 및 단기 거래)
■ 시장 유형별 조정
• 변동성 높은 시장: 높은 N값 (30-50) 설정으로 노이즈 필터링
• 추세 시장: 중간 N값 (20-30) 설정으로 주요 반전만 포착
• 횡보 시장: 낮은 N값 (10-20) 설정으로 범위 내 움직임 포착
─────────────────────────────────────
◆ 다른 지표와의 시너지
• 이동평균선: Market Structure Reversal Signals 신호와 주요 이동평균선 교차 지점이 일치할 때 신호 강화
• RSI: 과매수/과매도 수준에서의 Market Structure Reversal Signals 신호는 반전 가능성 높임
• 볼륨 지표: 높은 볼륨과 함께 발생하는 Market Structure Reversal Signals 신호는 신뢰도 향상
• 피보나치 레벨: 주요 피보나치 레벨에서 발생하는 Market Structure Reversal Signals 신호는 중요한 전환점 제공
• 채널 지표: 가격 채널의 상단/하단 돌파와 Market Structure Reversal Signals 신호 일치 시 강력한 돌파 확인
─────────────────────────────────────
◆ 결론
52SIGNAL RECIPE Market Structure Reversal Signals는 시장의 구조적 변화를 객관적으로 식별하여 잠재적인 추세 전환점을 명확하게 시각화합니다. 최근 N일 고점/저점 돌파를 통해 방향성 변화를 감지하는 단순하면서도 강력한 접근 방식은 다양한 시장 환경과 트레이딩 스타일에 적용할 수 있는 유연성을 제공합니다. 중복 신호 방지 메커니즘과 확정 봉 기반 신호 생성은 신호의 품질과 신뢰성을 크게 향상시킵니다. 다른 기술적 지표와 결합하여 사용할 때 시너지 효과를 극대화할 수 있으며, 트레이더에게 시장의 전환점을 조기에 포착할 수 있는 귀중한 도구를 제공합니다.
─────────────────────────────────────
※ 면책 조항: 과거 성과가 미래 결과를 보장하지 않습니다. 항상 적절한 리스크 관리 전략을 사용하세요.
Lemang Solid Buy/Sellini adalah indicator Lemang Solid, cara kegunaan dia ada di Ebook Pakcik Chapter4

Buluh Berbudi Buy/SellIni adalah indicator Buluh Berbudi, cara kegunaan indicator ini ada di Ebook Pakcik Chapter 4.

[🧪] LABS-ANALYTIX: CANDLE.BEHAVIORAL.ANALYTIX LABS ANALYTIX – Indicator Description
LABS ANALYTIX is your on‑demand Market Recon Tool. It scans every candle across your chosen timeframe and breaks out key performance metrics by weekday, so you can pinpoint patterns, optimize entries, and manage risk with surgical precision.
Features:
• Weekday Performance Metrics – Calculates % of up vs. down candles for Mon→Sun
• Average Gain & Loss – Computes mean gain on winning days and mean loss on losing days
• Max Single‑Bar Run‑Up – Identifies the largest one‑bar gain per weekday
• Max Single‑Bar Drawdown – Identifies the largest one‑bar loss per weekday
• Historical Lookback Control – Set “Lookback Bars” to limit analysis to the most recent X bars or use “0” for full history
• Neon‑themed Table Overlay – Renders a compact, color‑coded table in the top‑right corner for instant tactical insight
Use Cases:
• Discover your strongest and weakest weekdays
• Quantify average move sizes to tailor your stop‑loss and take‑profit levels
• Identify outlier candles for potential trade setups or cautionary risk flags
• Drill into specific timeframes with adjustable lookback
How to Use:
1. Add the indicator to any chart (overlay=false).
2. Adjust “Lookback Bars” input to focus on recent samples or entire history.
3. Refer to the Neon Table to guide your weekly trade cadence and refine strategy.

Order Blocks Higher TimeFrameSmart Order Block & FVG Indicator | Precision Entry Tool
Take your trading to the next level with this powerful Order Block + Fair Value Gap (FVG) indicator, designed to help you spot institutional price levels with precision.
✅ Key Features:
Automatically detects Bullish and Bearish Order Blocks
Highlights Fair Value Gaps (FVGs) for refined entries
Includes Break of Structure (BOS) logic to confirm valid setups
Real-time Buy/Sell signals based on OB + FVG + Engulfing pattern
Built-in Stop Loss and Take Profit (1:1.5 RR) lines
Clean visual layout with customizable zones
Works on all markets and best optimized for 30m & 1H
🎯 Ideal for traders using Smart Money Concepts (SMC) or ICT-style trading, this tool is your edge to catch institutional moves before the crowd.

ICT & Zeussy Macro - Vertical Lines at Specific Times 1.0# ICT & Zeussy Macro - Vertical Lines at Specific Times 1.0
## Description
The **ICT & Zeussy Macro - Vertical Lines at Specific Times 1.0** is a Pine Script indicator designed for TradingView to plot vertical lines at user-defined times within each hour, making it a valuable tool for traders following ICT (Inner Circle Trader) and Zeussy macro strategies. The indicator allows users to mark specific times during the trading day with customizable vertical lines, helping to highlight key market moments such as macro times for analysis or trade planning.
## Key Features
- **Customizable Time Selection**: Choose specific hours (00:00 to 23:00) to display vertical lines using checkboxes in the settings.
- **Flexible Minute Inputs**: Define exact minutes for green and orange lines using comma-separated values (e.g., "45,15" for green lines at :45 and :15, or "50,0,10" for orange lines at :50, :00, :10).
- **Color and Style Customization**: Select colors for green and orange lines, as well as the line style (Solid, Dashed, or Dotted) to suit your chart preferences.
- **Historical and Future Plotting**: Configure the number of past and future days to display lines, allowing for analysis of historical patterns or planning for upcoming sessions.
- **Line Limit Management**: The indicator supports up to 500 lines to comply with TradingView's limits, with a warning label displayed if the maximum is reached.
## How It Works
The indicator plots vertical lines at specified minutes within selected hours for each chosen day:
- **Green Lines**: Drawn at user-defined minutes (default: :45 and :15 past the hour).
- **Orange Lines**: Drawn at user-defined minutes (default: :50, :00, and :10 past the hour).
- Users can enable or disable specific hours via checkboxes, and the lines are plotted for the specified number of past and future days.
- The indicator uses the chart's timezone to ensure accurate placement of lines relative to the market's session times.
## Usage
1. **Add to Chart**: Apply the indicator to your TradingView chart.
2. **Configure Settings**:
- In the "Hour Selection" group, check the boxes for the hours you want to display lines (e.g., 08:00 to 23:00 are enabled by default).
- In the "Green Minutes" and "Orange Minutes" fields, enter comma-separated minute values (e.g., "45,15" for green, "50,0,10" for orange).
- Adjust the "Days in Past" and "Days in Future" to control how many days the lines will cover.
- Customize the "Green Color", "Orange Color", and "Line Style" to match your chart aesthetics.
3. **Monitor Limits**: If you see a "Line limit reached (500 max)" warning, reduce the number of selected hours or days to stay within TradingView's line limit.
## Ideal For
- Traders using ICT or Zeussy macro strategies to identify key times for market analysis.
- Users who need to mark recurring time-based events on their charts.
- Technical analysts looking to visualize specific time intervals across multiple days.
## Notes
- Ensure that the number of selected hours and days does not exceed TradingView's 500-line limit to avoid missing lines.
- The indicator respects the chart's timezone, so verify that your chart's timezone aligns with your trading session.
- For optimal performance, limit the number of past and future days when using multiple hours to avoid hitting the line limit.
This indicator is perfect for traders who rely on precise timing for their strategies, offering a clean and customizable way to visualize critical market moments.
