CRT [TakingProphets]CRT (Candle Range Theory) is a high-level, real-time indicator built for ICT/SMC traders who want to visualize higher timeframe (HTF) candles, identify Candle Range Transitions, and uncover Smart Money Divergence (SMT)—without switching timeframes.
Designed to give traders a bird’s-eye view of institutional price action, CRT offers clear visuals for HTF Open-High-Low-Close projections, bullish/bearish CRT formations, and correlated divergence setups, all layered seamlessly over your lower timeframe chart.
🧠 Core Features Explained
✅ HTF Candle Visualization
Overlay candles from any timeframe (1min to Monthly) directly on your active chart. Perfect for traders using HTF context in their LTF setups (e.g., the Flow State Model). The 3 most recent HTF candles are dynamically displayed with full body/wick precision.
✅ Candle Range Transition (CRT) Detection
Identify institutional footprints. CRT detects high-probability Bearish and Bullish CRTs:
Bearish CRT: A failed continuation to the upside (lower close, higher high).
Bullish CRT: A failed breakdown (higher close, lower low).
These formations act as traps or turning points that often signal smart money rejections.
✅ SMT Divergence Integration
Compare price behavior between correlated assets (e.g., ES vs NQ, or EURUSD vs GBPUSD) to detect divergences in CRT behavior. Confirm traps, anticipate reversals, or avoid false breakouts.
✅ Current Candle Projections
Project the real-time HTF candle’s Open, High, Low, and Close levels across the current session. Use these levels as evolving support/resistance, bias filters, or take-profit zones. All levels are fully customizable by color, label, and visibility.
✅ Custom Display Engine
Modify candle body width, label size, wick color, and transparency to tailor the view to your style. Use the Info Box to display the instrument, HTF timeframe, and date stamp clearly at a glance.
✅ SMT Divergence Lines & Alerts
Draws real-time lines connecting CRT divergences across correlated assets, with bold labels like “BULLISH SMT” or “BEARISH SMT”. Paired with alert conditions to never miss critical confirmation or a potential trap.
✅ Alert System Built for Speed
Four alert types included:
Bullish CRT
Bearish CRT
Bullish SMT Divergence
Bearish SMT Divergence
Set them up once and receive real-time push notifications when smart money shows its hand.
⚙️ Why CRT Matters for ICT/SMC Traders
In ICT, understanding where Smart Money shifts delivery or fails to continue a move is critical. CRT captures these moments by analyzing how the middle candle of a three-candle sequence behaves relative to the prior one. If that middle candle fails to expand the range effectively—or diverges from a correlated pair—it often signals an impending shift.
CRT helps you:
Visualize HTF bias and reaction zones without flipping charts
Detect liquidity traps and engineered false moves
Confirm flow state entries or HTF POI rejections
Enhance SMT logic with actionable real-time divergence overlays
🧭 Who Should Use CRT?
Whether you’re a:
Flow State trader identifying PD Arrays and CISD entries
Intraday sniper waiting for killzone shifts and liquidity grabs
Swing trader using weekly HTF rejection models
Candlestick analysis

VIKRANT ComboThank you for your interest in my custom TradingView script.
I've granted you access to my Invite-Only script, titled “VIKRANT COMBO” on TradingView. This script is designed to help you with more accurate entries and exits based on advanced trend

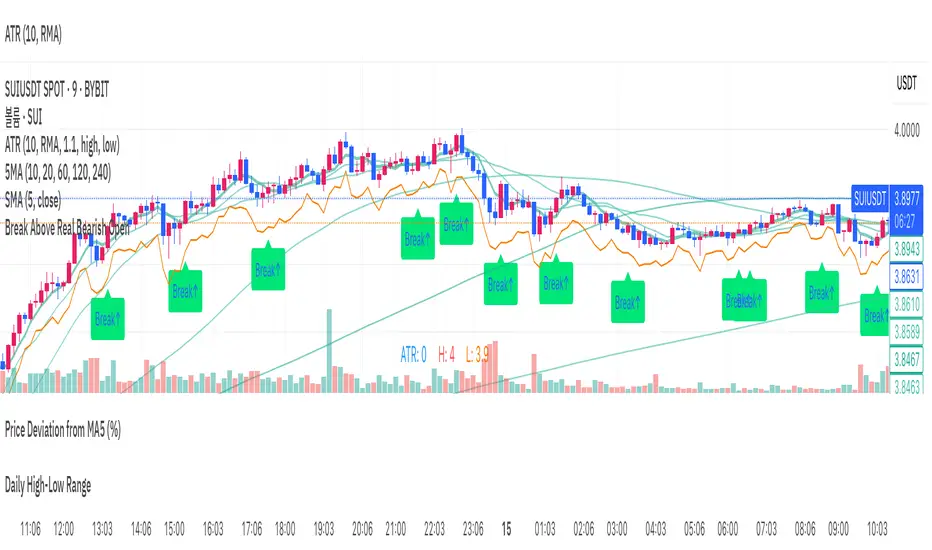
Break Above Real Bearish Open// This indicator is designed to help identify precise intraday entry points on lower timeframes.
// It tracks the most recent valid bearish candle—defined as a red candle whose close is lower than the low of the most recent bullish candle.
// When the price breaks above the open of that bearish candle with a bullish candle, a "Break↑" signal is shown.
// Minor pullback candles within uptrends are filtered out to reduce noise.
// The alert only triggers once per valid bearish setup, avoiding redundant signals.
// Ideal for detecting breakout opportunities after pullbacks in intraday trending markets.
// 이 인디케이터는 장중 분봉 기준에서 정밀한 진입 타이밍을 포착하는 데 도움을 줍니다.
// 최근 형성된 유효한 음봉(가장 최근 양봉의 저가보다 종가가 낮은 음봉)을 추적하며,
// 해당 음봉의 시가를 돌파하는 양봉이 등장할 경우, "Break↑" 신호를 차트에 표시합니다.
// 상승 중의 사소한 눌림 음봉은 자동으로 걸러내어 노이즈를 최소화합니다.
// 하나의 음봉에 대해 알림은 단 한 번만 발생하며, 중복되지 않도록 설계되어 있습니다.
// 분봉 흐름 속 눌림목 이후 돌파 구간을 자동으로 포착하고자 할 때 유용하게 활용할 수 있습니다.
Crypto Sentiment + Correlation📊 Crypto Sentiment + Correlation Indicator
Key Features:
- 🔄 Sentiment Aggregation: Measures price momentum vs moving averages across BTC, LTC, ETH, XRP, and SOL.
- ⚖️ Flexible Weighting Options: Choose between equal weight, market cap weighting, or volume-driven sentiment for tailored insights.
- 📈 Visual Candles & Background Signals: Uses sentiment-based candle overlays and color-coded signals to indicate potential shifts or divergence.
- 📊 BTC Correlation Map: Tracks correlation strength and direction between combined sentiment and Bitcoin’s price movement.
- 🧠 Technical Overlays: EMA and Bollinger Bands help contextualize sentiment trends with traditional indicators.
- 🎨 Stylized SMA Layers: Adds intuitive multi-format SMA visualization with area fill and stepped markers for easy spotting of trend shifts.
Why Use It:
Whether you're swing trading or refining entries on crypto positions, this tool gives you a snapshot of what the “mood” across major coins looks like—are the markets in harmony or diverging from BTC’s path? Use it to stay ahead of trend reversals, spot overextended rallies, or confirm bullish sentiment before you jump in.

GOLD DR Long with diamond & TP2 Exit האינדיקטור מזהה נקודת כניסה אידיאלית ל־LONG, פותח פוזיציה, קובע יעד רווח אוטומטי, מגן עם סטופלוס חכם, ומבצע מיצוע רק כשהתנאים בשלים – הכל קורה אוטומטית, בזמן אמת, על הגרף.
The indicator identifies an ideal LONG entry, opens a position, sets an automatic take-profit target, protects with a smart stop-loss, and averages in only when conditions are right – all fully automated, in real time, right on the chart.

Kalman Moving Average For LoopKey Features of the Indicator:
Flexible Moving Average Calculation (calcMovingAverage):Description: Allows users to select from 10 moving average types (SMA, EMA, DEMA, TEMA, WMA, VWMA, SMMA, HMA, LSMA, ALMA) to process the input price source (pricesource, default: close).
Parameters:
maType: User selects the moving average type (default: HMA).
period: Length of the moving average (default: 14).
almaSigma: Sigma parameter for ALMA (default: 5).
Purpose: Provides versatility in analyzing price trends, with the chosen moving average (maValue) used for comparison with the smoothed Kalman filter output.
Kalman Filter for Price Smoothing:
Description:
Applies a Kalman filter to the price source to produce a filtered price (kalmanFilteredPrice), which is further smoothed using an HMA to create smoothedKalmanPrice.
Parameters:
process_noise: Controls system model noise (default: 0.01).
measurement_noise:
Controls measurement noise (default: 3).
N: Filter order, determining the number of state estimates (default: 3).
smooth_period: HMA period for smoothing kalmanFilteredPrice (default: 9).
Purpose: Reduces noise in price data, providing a smoother trend line for signal generation and plotting.
Historical Analysis with For-Loop:
Description: Uses a for-loop to calculate the average of calcMovingAverage values over a user-defined historical range (from to to_) for historical bars of the price source (pricesource ).
Parameters:
from: Start of the historical range (default: 1).
to_: End of the historical range (default: 25).
Purpose: Computes an average moving average (avgMa) over the specified range to compare with the smoothed Kalman price for signal generation.
Error Handling and Robustness:
Description: Includes checks for na values in the for-loop to ensure only valid calcMovingAverage values contribute to the average (avgMa). Resets signal and plot variables each bar to prevent carryover.
Purpose: Ensures reliable calculations and prevents errors from invalid data.

ZYTX RSI SuperTrendZYTX RSI SuperTrend
ZYTX RSI + SuperTrend Strategy
The definitive integration of RSI and SuperTrend trend-following indicators, delivering exemplary performance in automated trading bots.

London Reversal + LazyAlgoLondon Reversal Strategy with FS Entry
This script detects trend reversals during the London session, following the Asian session, using technical signals based on moving averages, Asian range breakouts, and multi-timeframe trend filters. It includes a system of visual signals and alerts, with customizable Stop Loss and Take Profit levels.

GOLD Auto-Alert Strategy [Enhanced+Signals+UT Bot]New Version The Indicator
✅ BUY Signal Triggers Only If:
UT Buy signal flips (from down to up)
ADX > Threshold → market has strength
RSI is outside the 40–60 range
Volume is spiking above 20-bar average × 1.2
EMA Fast > EMA Slow → uptrend confirmed
Close > EMA Fast → price above short-term trend
Bullish Engulfing candle
🔻 SELL Signal Triggers Only If:
UT Sell signal flips (from up to down)
ADX > Threshold → market has strength
RSI is outside the 40–60 range
Volume is spiking above average
EMA Fast < EMA Slow → downtrend confirmed
Close < EMA Fast → bearish structure
Bearish Engulfing candle

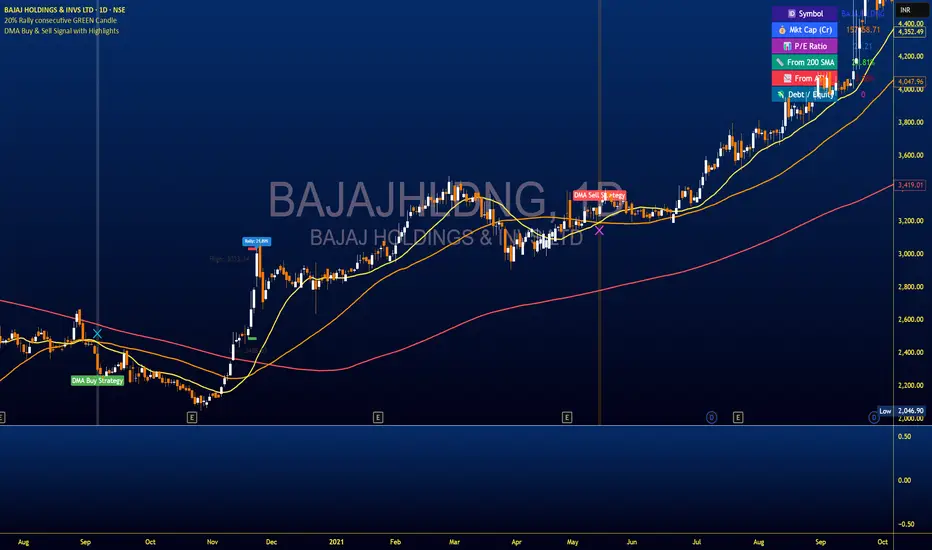
DMA Buy & Sell Signal with AlertsThis script identifies **BUY** signals when the 20 DMA crosses **below** the 50 DMA, with the alignment: `200 DMA > 50 DMA > 20 DMA > Price`.
It also plots **SELL** signals when the 20 DMA crosses **above** the 50 DMA, with the alignment: `Price > 20 DMA > 50 DMA > 200 DMA`.
Each signal is plotted on the chart with green "BUY" and red "SELL" labels.
The script includes alert conditions for both signals.
It uses simple moving averages (SMA) of 20, 50, and 200 periods.
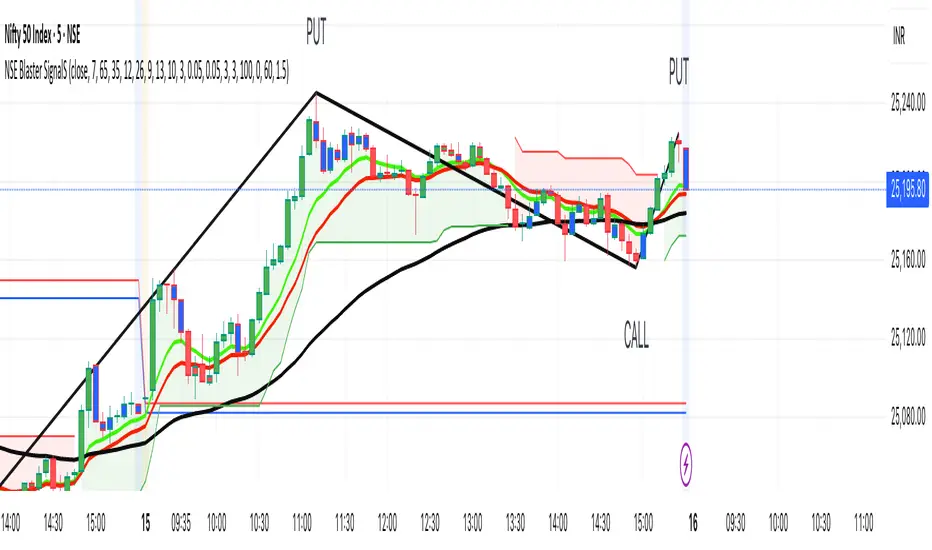
NSE Blaster SignalSThis is a trend following indicator and alert on Candlestick patterns and trend line -
This code combines a number of indicators to create an overall trading strategy.
The indicator recognises and displays some useful candle defined patterns that are used to support trend continuation:
Added Main Entry Signals.....
Manipulation Candle SignalsManipulation Candle signal. Good signal to be aware when there is a liquidity sweep from the previous candle high or low, and a continuation in the trend. Most recomended in 30 min and 1HR time frame for day trade

BBOB: Breaker + Order + Overlapping Blocks + Buy/Sell💎 Smart OBX Premium – Order Block, Breaker Block & Overlap Zones
Unleash the power of institutional trading levels with Smart OBX Premium, a next-generation indicator designed to identify Order Blocks, Breaker Blocks, and Overlap Zones with pinpoint precision and stunning visuals.
🔷 Key Features:
✅ Order Blocks (OB)
Detects bullish and bearish order blocks from smart money footprints. Zones are colored elegantly with clear, labeled boxes for instant recognition.
✅ Breaker Blocks (BB)
Identifies failed OBs that act as strong reversal or continuation zones. Visually distinct with premium-quality styling and easy-to-read tags.
✅ Overlap Zones
Highlights powerful confluence areas where OB and BB intersect — the most high-probability reaction zones. These are shaded uniquely with gold gradient tones for instant visual edge.
✅ Zone Labels & Reactions
All blocks are clearly labeled on chart with names like:
• 🔵 Bullish OB
• 🔴 Bearish OB
• 🟢 Bullish Breaker
• 🟠 Bearish Breaker
• ⭐ Overlap Zone
✅ Professional Design
Ultra-clear visuals with soft shadows, rounded edges, transparent layers, and precise alignment. Perfect for content creators and serious traders.
✅ Buy/Sell Signal Points
Automatic arrows or labels appear above/below candles whenever price reacts strongly to OB/BB/Overlap zones.
🧠 Smart Money Concept-Based
Built entirely on institutional price behavior — the same logic used by banks, hedge funds, and top-level smart money traders.

I Want My ScalpsTops/Bottoms.
Bull/Bear traps.
Designed for NQ / MNQ on 1 min timeframe during cash hours.
Time filter for disabling extended hours visibility.
Default settings are the settings I use, if you find a combination of settings that you like or work better please let me know.

20% Rally - All Green CandlesThis indicator detects rallies where the price rises 20% or more using only consecutive green candles. It marks the rally's start with a green dashed line and "Entry" label, and the end with a red solid line and "Target" label. Ideal for identifying strong bullish momentum on daily charts.

RB3 DEMO – Rejection Blocks Visual ExampleThis is a simplified demo version of a custom Rejection Block (RB) visual indicator. It identifies potential bullish and bearish rejection zones based purely on candle structure, without using any time-based or algorithmic filters.
🧠 What it does:
• Detects Bullish and Bearish Rejection Blocks using clean price action logic
• Highlights those zones with boxes, optional lines, and labels
• Designed to help traders visually study price rejections and market structure
⚙️ How it works:
• Bullish RB = red candle with a lower low than the previous and next candle
• Bearish RB = green candle with a higher high than the previous and next candle
• No time filters or hidden logic are used — this tool is purely structural
🎯 Best used by:
• Traders who want to visualize potential rejection zones
• Beginners studying price action and structural reversals
• Visual learners who prefer clean chart-based confirmations
✅ This demo does **not** include institutional filters, time anchors (e.g., TRAL‑03), or sequence-based validation.
📌 A more advanced version with time-reactive filtering logic is available privately.
ℹ️ To use: enable "Boxes" and/or "Labels" to highlight rejection blocks clearly. Works on all timeframes.

NY Open ATR System - Tick Range Filter### **New York Open ATR System - Brief Overview**
#### **🎯 Core Purpose**
Identifies **high-potential breakout setups** at the New York open (13:30 UTC) by combining:
1. **Volatility filters** (dual ATR periods)
2. **Tick-based range analysis**
3. **Time-specific triggers**
---
### **⚙️ Key Components**
| **Feature** | **Function** |
|---------------------------|-----------------------------------------------------------------------------|
| **ATR Filters** | Dual volatility checks (short + long periods) at 13:25 UTC |
| **Tick Range Limit** | Highlights candles with range < user-defined ticks (default: 150) |
| **Time Precision** | Focuses exclusively on 13:30 UTC weekday candles |
| **Visual Markers** | Yellow highlight + tick count label (e.g., "147/150 ticks") |
| **Info Panel** | Real-time display of settings and current tick count |
---
### **📊 How It Works**
1. **Pre-Open Check (13:25 UTC)**
- Verifies market volatility using 2 ATR values
- Requires both to exceed user-defined thresholds
2. **Open Analysis (13:30 UTC)**
- Measures exact tick count: `(high - low) / instrument_mintick`
- Compares against your max tick limit (adjustable 1-5000)
3. **Visual Trigger**
- Highlights candle yellow if:
```tick_count < your_set_limit```
- Labels show exact performance vs limit (e.g., "142/150 ticks")
---
### **⚡ Trading Signals**
| **Condition** | **Visual Feedback** |
|----------------------------|---------------------------------------------|
| High volatility + tight range | Yellow candle + tick count label |
| All other scenarios | No marking |
---
### **🛠️ Customization**
```pine
// Key Adjustable Parameters:
maxTicks = input.int(150) // Set 1-5000 ticks
atrPeriod1 = input.int(14) // Short ATR (2-5000)
atrPeriod2 = input.int(161) // Long ATR (2-5000)
candleColor = input.color(color.yellow) // Highlight color
```
---
### **💡 Practical Use Cases**
1. **Breakout Anticipation**
- Tight ranges after volatility spikes often precede strong moves
2. **Session Scalping**
- Identify low-range opens for mean-reversion plays
3. **Volatility Filtering**
- Avoid trading when ATR thresholds aren't met
---
### **📈 Suggested Settings**
| **Market** | **Max Ticks** | **ATR Periods** |
|------------------|--------------|----------------|
| Forex (EUR/USD) | 100-200 | 14/161 |
| Stocks (SPY) | 50-120 | 10/200 |
| Crypto (BTC) | 300-500 | 20/100 |
---
### **✅ Benefits**
- **Precision Timing**: Focused on NY open liquidity surge
- **Quantitative Filtering**: Exact tick measurement + volatility thresholds
- **Clean Visuals**: No chart clutter - only marks qualifying candles
- **Adaptable**: Works across all markets and timeframes
This system helps traders spot high-probability breakout setups by combining volatility anticipation with precise range measurement at the market's most liquid opening window.

Dominance Candle Raja Saien (Detector with Alerts)Dominance Candle Finder with Alerts by Raja Saien
This powerful indicator is designed to detect dominance candles—those strong-bodied candles that often signify momentum and trend strength. Whether you're trading breakouts, trend continuations, or reversals, this tool helps you identify key market moves in real time with optional alerts.
🔍 Features:
Automatic Detection of Dominance Candles: Highlights candles with strong body size, showing decisive market movement.
Customizable Thresholds: Adjust sensitivity according to your strategy or asset volatility.
Built-in Alerts: Get notified the moment a dominance candle forms—no need to stare at charts all day!
Multi-Timeframe Compatibility: Works on any timeframe from 1-minute to daily or higher.
📊 Use Cases:
Entry confirmation on breakouts
Trend strength analysis
Volatility surge detection
Combine with support/resistance or order block zones for powerful setups
Tip: Best used with strong support/resistance levels or price action strategies for confluence

K_RSI_ATR_ATR%_CMO_MACD_ADXThis indicator is combination of below indicators:
RSI
ATR
ATR%
CMO
MACD
ADX

Heikin Ashi Color Change Alert📈 Heikin Ashi Color Change Alert
This indicator detects color changes in Heikin Ashi candles and issues visual signals and alerts when a change is confirmed at bar close.
🔍 What it does:
Reconstructs Heikin Ashi candles directly from chart prices.
Detects when the color changes from bearish to bullish (or vice versa).
Prints a triangle symbol on the chart when the change occurs.
Allows you to set alerts so you never miss a potential reversal.
✅ How it works:
A bullish signal occurs when a red (bearish) Heikin Ashi candle is followed by a green (bullish) one.
A bearish signal occurs when a green (bullish) candle is followed by a red (bearish) one.
The detection is done only after the current candle is fully closed, ensuring cleaner signals.
🔔 Example Alerts:
"Heikin Ashi candle changed to bullish"
"Heikin Ashi candle changed to bearish"
This indicator is ideal for:
Traders who follow price action
Those who want to filter trends
Anyone who uses Heikin Ashi to smooth market noise and detect reversals

I Want My ScalpsTops/bottoms.
Bull/bear traps.
Designed for NQ / MNQ on 1 min during cash hours.
Time filter update coming soon.

Momentum Ride Indicatorbeautiful indicator with buy & exit signal. It will allow to ride the full momentum.
