tradingweapon#PurePriceAction
#TradeWithoutIndicator
Custom Candlestick Pattern
Buy and Sell On Custom Location
Best Semi Automatic Strategy
Candlestick analysis

Engulfing CandlestickEngulfing Candlestick Pattern
The Engulfing Candlestick Indicator can be used in any timeframe. It has a high accuracy entries.

High Win Rate XAUUSD Strategy (EMA21 + RSI + Volume MA20)Buy Conditions:
Price above EMA 21
EMA 21 is rising
RSI > 55 and RSI increasing
Close is above EMA 21
Current candle is green (close > open)
Volume > MA20 of volume
Price below EMA 21
EMA 21 is falling
RSI < 45 and RSI decreasing
Close is below EMA 21
Current candle is red (close < open)
Volume > MA20 of volume


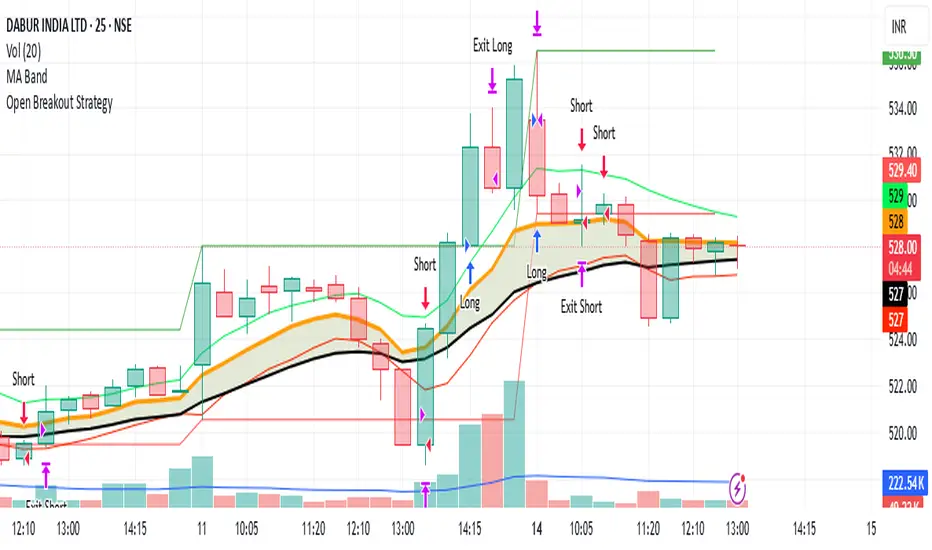
Open Breakout Strategyfirst 5min candle
SL is 0.25% TP is 2.25%
If breks low it is hsort
If breaks hi then it is long
PC UpdatedThis indicator identifies a high-probability breakout setup using a simple but powerful 3-candle formation. It works on lower timeframes (like 5m) and is ideal for scalping or short-term intraday setups.

Strict S&D Zones with Real BoS (Wick Breaks)Marking supply and demand zones for you before a 3 candle push. Accurate for supply and demand zones

MG TRENDNSE:NIFTY
hi everyone use this to find revrsal entry in ur nifty chart and u can use in all type of market that is will shows the best point to take entry at the point take u turn

KZ TRADING _ BOT RSI,STOCH, MO HINH NENBot trade demo for m15 . it suitable for XAU, U.J. use RSI + Stoch RSI and candless pattem

Multi-Timeframe Fibonacci Retracement [HG]# 🌀 Fibonacci Multi-Timeframe Indicator
## 🌟 Overview
An advanced Fibonacci-based indicator utilizing three distinct timeframes (5, 14, and 34 periods) to provide comprehensive market analysis. This powerful tool combines short-term momentum with medium and long-term trend perspectives, all based on the mathematical precision of Fibonacci sequence numbers.
## 🔧 Core Features
### 📊 Triple Fibonacci System
- **Fast Signal (5 periods)**: Ultra-responsive for scalping and quick entries
- **Medium Signal (14 periods)**: Balanced approach for swing trading
- **Slow Signal (34 periods)**: Long-term trend identification and confirmation
- **Fibonacci Harmony**: All periods based on authentic Fibonacci sequence
### 🎯 Multi-Timeframe Analysis
- **Convergence Signals**: When all three timeframes align
- **Divergence Detection**: Early warning of potential reversals
- **Momentum Layers**: Different speed signals for complete market picture
- **Trend Strength**: Measured through multiple Fibonacci perspectives
## 🎨 Customization Options
### 🎭 Visual Configuration
- **Individual Colors**: Separate color schemes for each timeframe
- **Line Styles**: Solid, Dashed, or Dotted options for clear differentiation
- **Line Thickness**: Adjustable width (1-5 pixels) for optimal visibility
- **Transparency Control**: Fine-tune opacity for overlapping signals
### ⚙️ Technical Parameters
- **Source Selection**: Configurable input (Close, Open, High, Low, HLC3)
- **Smoothing Options**: Additional filtering for cleaner signals
- **Alert System**: Notifications for convergence and crossover events
- **Display Toggle**: Enable/disable individual timeframe components
## 📈 Trading Applications
### 🎯 Signal Generation
- **Triple Confirmation**: Highest probability when all timeframes agree
- **Early Entry**: Fast signal (5) for quick market entries
- **Trend Confirmation**: Slow signal (34) validates overall direction
- **Exit Timing**: Medium signal (14) for optimal trade management
### 🔍 Market Analysis
- **Trend Identification**: Clear visualization of market direction
- **Momentum Shifts**: Early detection through Fibonacci relationships
- **Support/Resistance**: Dynamic levels based on Fibonacci calculations
- **Market Cycles**: Natural rhythm recognition through mathematical harmony
### ⚡ Trading Strategies
- **Scalping**: Ultra-fast 5-period signals for quick profits
- **Swing Trading**: 14-period balance for medium-term positions
- **Position Trading**: 34-period confirmation for long-term holds
- **Confluence Trading**: Maximum edge when all signals align
## 🚀 Key Benefits
✅ **Fibonacci Precision** - Mathematical accuracy of golden ratio sequences
✅ **Multi-Timeframe Edge** - Complete market perspective in one indicator
✅ **Natural Market Rhythm** - Fibonacci numbers reflect market psychology
✅ **Versatile Application** - Works across all markets and timeframes
✅ **High Probability Setups** - Triple confirmation reduces false signals
✅ **Professional Grade** - Institution-quality analysis tools
## 💡 Pro Trading Tips
- Wait for triple alignment for highest probability trades
- Use fast signal for entries, slow signal for trend bias
- Monitor divergences between timeframes for reversal opportunities
- Combine with support/resistance for confluence trading
- Scale position sizes based on timeframe agreement strength
## 🔢 Fibonacci Magic
The periods 5, 14, and 34 are not random - they represent consecutive Fibonacci numbers that naturally resonate with market movements and trader psychology, providing optimal market timing and trend analysis.
---
*Perfect for traders seeking mathematical precision combined with multi-timeframe market analysis.*

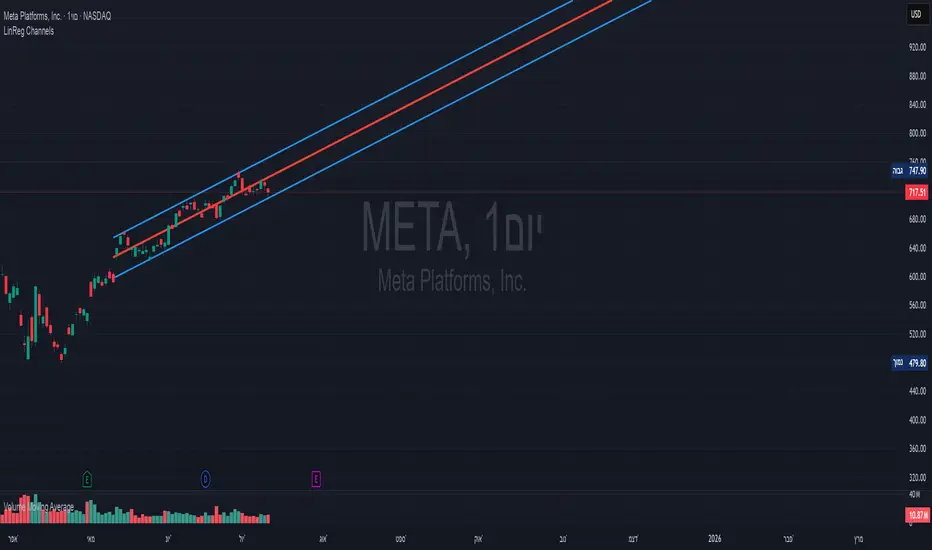
Linear Regression Channels📈 Linear Regression Channels
🌟 Overview
A professional dual linear regression channel indicator designed for comprehensive trend analysis. This powerful tool provides simultaneous short-term and long-term trend perspectives through two independent regression channels with customizable standard deviation bands.
🔧 Core Features
📊 Dual Channel System
Channel 1: 43-period regression analysis for long-term trend identification
Channel 2: 20-period regression analysis for short-term momentum tracking
Independent Configuration: Each channel fully customizable with separate parameters
Real-Time Updates: Dynamic calculations with every new candle
📐 Standard Deviation Bands
Multiple Levels: Configurable deviation bands (1σ, 2σ, 3σ)
Dynamic Support/Resistance: Automatically calculated price levels
Trend Boundaries: Clear visualization of trend strength and direction
Statistical Precision: Mathematically accurate regression calculations
🎨 Customization Options
🎭 Visual Styling
Individual Colors: Separate color schemes for each channel
Line Styles: Choose between Solid, Dashed, or Dotted lines
Line Width: Adjustable thickness (1-5 pixels) for optimal visibility
Extension Options: Project lines into the future for analysis
⚙️ Technical Parameters
Period Length: Fully adjustable lookback periods
Source Selection: Choose from Close, Open, High, Low, or custom sources
Deviation Levels: Customizable standard deviation multipliers
Display Control: Toggle individual channels on/off
📈 Trading Applications
🎯 Trend Analysis
Dual Timeframe Perspective: Simultaneous short and long-term view
Trend Confirmation: When both channels align in direction
Trend Strength: Measured by price position within channels
🔍 Support & Resistance
Dynamic Levels: Standard deviation bands as S/R zones
Channel Boundaries: Natural support and resistance areas
Confluence Trading: Multiple level confirmations
⚡ Entry & Exit Signals
Channel Breakouts: Trend continuation opportunities
Mean Reversion: Trades back to center line
Channel Crossovers: When price moves between timeframes
🚀 Key Benefits
✅ Multi-Timeframe Analysis - Complete market perspective
✅ Mathematical Precision - Least squares regression accuracy
✅ High Customization - Adaptable to any trading style
✅ Clean Interface - Professional chart appearance
✅ Performance Optimized - Smooth real-time operation
✅ Versatile Application - Works on all markets and timeframes
💡 Professional Usage
Combine both channels for confluence signals
Use longer channel for overall trend bias
Trade shorter channel signals within longer trend
Monitor channel width for volatility analysis
Essential tool for traders seeking precise trend analysis and dynamic support/resistance levels.
Recent Swing High/Low Linesit gives the recent swing highs and lows.
for options buyers, they can simply enter on a trade when an opposite option (at the money) goes below the recent swing low.

Japanese Candlestick PatternsCandlestick Pattern Detector – Your Smart Market Insight Tool
Unlock the hidden language of price action with the Candlestick Pattern Detector, an advanced TradingView indicator meticulously crafted to identify powerful candlestick formations in real time. Whether you are a day trader seeking sharp reversals, a swing trader scouting for trend continuations, or an investor who values precise entry signals, this indicator is your indispensable trading companion.
The Candlestick Pattern Detector continuously scans every bar on your chart and highlights over 30 classic and advanced candlestick patterns, including dojis, engulfing candles, hammers, shooting stars, morning stars, evening stars, haramis, and more. Each detected pattern is labeled directly on the chart, providing crystal-clear visual signals without clutter. Customizable settings allow you to choose which patterns to monitor, fine-tune sensitivity, and adjust label colors and styles to match your personal trading aesthetic.
Beyond merely spotting patterns, this indicator empowers traders to understand the psychological forces driving the market. Bullish and bearish signals help you gauge potential trend reversals, momentum shifts, or periods of consolidation. By integrating these time-tested price action signals into your strategy, you gain a powerful edge in anticipating market moves before they unfold.
Key Features:
Detects 30+ popular candlestick patterns in real time
Clear on-chart labels and color-coded signals
Customizable alerts for immediate trading opportunities
Adjustable sensitivity for noise reduction
Perfect for intraday, swing, or long-term trading
Elevate your trading precision and confidence with the Candlestick Pattern Detector. Let the market’s story reveal itself, candle by candle.

Robbin hoodsomething good, this is ewrfiwevdcbdkjsdbvkj vasfdkjvsdvkjae dk;v asd vk;jsbdvkaeskv jkjsD v.kj awerekrv

Stochastic Trend Signal with MultiTF FilterIndicator Overview – Multi-Timeframe Stochastic Signal
This custom TradingView indicator combines multi-timeframe Stochastic analysis to generate high-probability, trend-following trading signals. It integrates:
Stochastic on the current timeframe to identify potential entry zones (overbought/oversold).
Stochastic on the 1D (daily) timeframe to confirm short-term trend direction.
Stochastic on the 1W (weekly) timeframe to filter out signals that go against the broader market trend.
🔔 Buy signals are triggered only when:
1D Stochastic > 50 (bullish bias),
Current timeframe Stochastic ≤ 20 (oversold),
After the first bullish candle,
And 1W Stochastic does not contradict the direction (must not be bearish).
🔻 Sell signals are triggered only when:
1D Stochastic < 50 (bearish bias),
Current timeframe Stochastic ≥ 80 (overbought),
After the first bearish candle,
And 1W Stochastic does not contradict the direction (must not be bullish).
The indicator also includes visual highlights:
✅ Green or red background when 1D and 1W trends align clearly.
⚠️ Gray background when 1D and 1W trends conflict — a warning to avoid low-probability setups.
📌 This indicator works best on the 4-hour (H4) timeframe, offering a balanced view between short-term signals and higher timeframe trend filters.

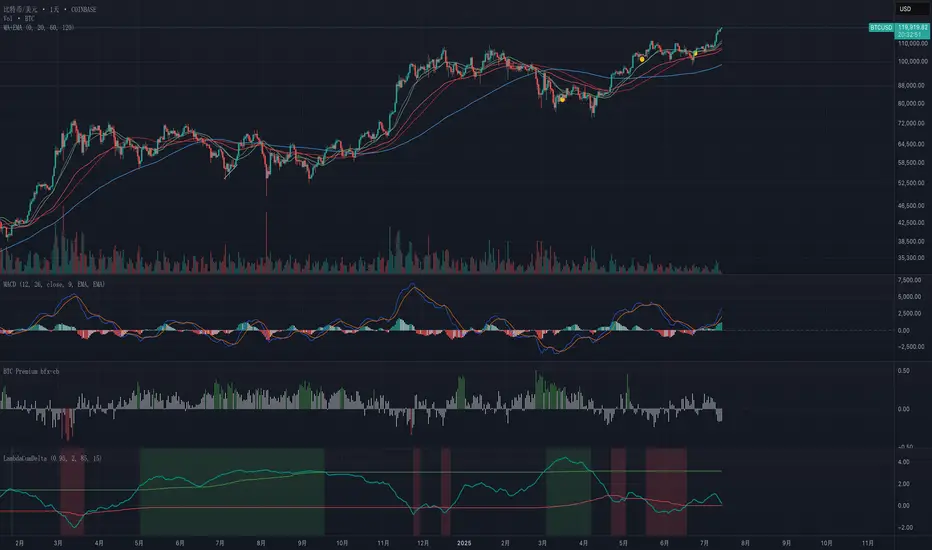
Exponential-Decay Cumulative Spread (Cycle-Tuned)## Indicator Overview
**Exponential-Decay Cumulative Spread (Cycle-Tuned)** – short title **LambdaCumDelta** – tracks the percentage spread between CEXs BTC spot prices.
By clipping outliers, applying an exponential-decay running sum, and comparing that sum to rolling percentile bands, the script flags potential **cycle bottoms** and **cycle tops** whenever the cumulative spread stays beyond extreme thresholds for three consecutive bars.
---
### Core Logic
1. **Price Spread**
`spread_pct = (cexA – cexB) / cexB × 100`.
2. **Outlier Suppression**
* Calculates the **90-day standard deviation σ** of `spread_pct`.
* Uses a **clip coefficient `k_clip`** (0.5–5.0) to cap the spread at `±k_clip × σ`, damping single-day anomalies.
3. **Exponential-Decay Sum**
* Applies a decay factor **λ** (0.50–0.999):
```
CumΔₜ = spread_clipₜ + λ × CumΔₜ₋₁
```
* Larger λ → longer memory half-life.
4. **Rolling Percentile Bands**
* Uses a **365-bar window** to derive dynamic percentile thresholds.
* Upper / Lower bands are set by **perc\_hi** and **perc\_lo** (e.g., 85 % and 15 %).
5. **Signal Definition**
* **Bullish** (cycle bottom): `CumΔ` above the upper band for **3 straight bars**.
* **Bearish** (cycle top): `CumΔ` below the lower band for **3 straight bars**.
---
### Chart Elements
| Plot | Style | Meaning |
| --------------- | ----------------- | ----------------------------------- |
| **CumΔ** | Teal thick line | Exponential-decay cumulative spread |
| Upper Threshold | Green thin line | Rolling upper percentile |
| Lower Threshold | Red thin line | Rolling lower percentile |
| Background | Faded green / red | Bullish / bearish signal zone |
---
### Key Inputs
| Input | Default | Purpose |
| -------------------- | ------- | ------------------------------- |
| **Decay factor λ** | 0.95 | Memory length of CumΔ |
| **Clip coefficient** | 2.0 | Multiple of σ for outlier cap |
| **Upper percentile** | 85 | Cycle-bottom trigger percentile |
| **Lower percentile** | 15 | Cycle-top trigger percentile |
---
### Practical Tips
1. **Timing bias**
* Green background often precedes mean-reversion of the spread – consider scaling into longs or covering shorts.
* Red background suggests stretched positive spread – consider trimming longs or lightening exposure.
2. **Combine with volume, trend filters (MA, MACD, etc.)** to weed out false extremes.
3. Designed for **daily charts**; ensure both exchange feeds are synchronized.
---
### Alerts
Two built-in `alertcondition`s fire when bullish or bearish criteria are met, enabling push / email / webhook notifications.
---
### Disclaimer
This script is for educational and research purposes only and is **not** financial advice. Test thoroughly and trade at your own risk.
Momentum Candle V2 by Sekolah Trading📌 Momentum Candle V2 by Sekolah Trading – Pair-Based Volatility & Wick Ratio Filter
This script provides a structured and adaptive approach to detecting high-probability momentum candles in intraday markets. It dynamically adjusts pip thresholds and wick filtering conditions based on the selected symbol and timeframe, making it highly practical for real-time trading.
🔍 Concept and Originality
Momentum Candle V2 by Sekolah Trading implements a custom-built methodology combining:
Dynamic Pip Calibration
For each supported instrument (e.g., XAUUSD, USDJPY, GBPUSD, AUDUSD, EURUSD, BTCUSD), the user can define a pip threshold that determines the minimum valid body size for momentum candles. These thresholds are tailored for each pair and timeframe (M5, M15, H1), ensuring the logic adjusts to different volatility profiles.
Wick-to-Body Ratio Filtering
The script filters out candles with large wicks by requiring that total wick length (upper + lower) be no more than 30% of the full candle range. This helps identify decisive candles with minimal rejection.
Directional Validation
Bullish momentum is defined as: Close > Open with a shorter upper wick.
Bearish momentum is: Close < Open with a shorter lower wick.
Real-Time Timing Filter
Alerts are only triggered when the current candle is between 20 and 90 seconds from closing, which reduces noise and encourages confirmation-based entry.
Non-Repainting Logic
All calculations run in real-time with confirmed candles only — no lookahead or future leak.
📊 Visual Output – How to Read the Chart
When the conditions above are met, the script displays triangle markers on the chart:
🔺 Red downward triangle above the candle: valid bearish momentum signal
🔻 Blue upward triangle below the candle: valid bullish momentum signal
These shapes appear on live bars during the final moments of the candle to alert traders to potential confirmed momentum.
🔔 Alert Conditions
Two alert types are provided:
Momentum Bullish: Large bullish candle with small upper wick, during last 20–90s of bar
Momentum Bearish: Large bearish candle with small lower wick, same timing window
Alerts are designed for precision entries at candle close.
🧭 How to Use
Apply the script to a 5m, 15m, or 1h chart.
Configure pip thresholds for your preferred pairs from the input settings.
Watch for triangle markers near the close of each candle:
Blue = potential bullish momentum
Red = potential bearish momentum
Set alerts:
Go to Alerts → Select Momentum Bullish or Momentum Bearish
Frequency: Once Per Bar
Customize message: e.g. “Momentum Bullish on XAUUSD M15”
Combine signals with:
EMA, S/R, or trend filters
Volume/Order Flow
Liquidity zone or breakout context
🛡️ Why This Script Is Closed-Source
This script uses proprietary logic developed by Sekolah Trading, including:
Custom pip calibration engine
Adaptive wick filtering
Real-time entry validation with triangle plots
While the code is protected, the methodology has been explained transparently here in accordance with TradingView publishing rules.
⚠️ Disclaimer
This script is provided for educational and technical analysis purposes only.
It does not guarantee results or provide financial advice. Always verify trades with your own strategy and risk controls.
Author: Sekolah Trading
Version: Momentum Candle V2
Built with Pine Script v6

DEMA/EMA 20-50-200 Cross AlertPhương pháp giao dịch cùng dema, thuận theo xu hướng, vào lệnh tuyệt đối

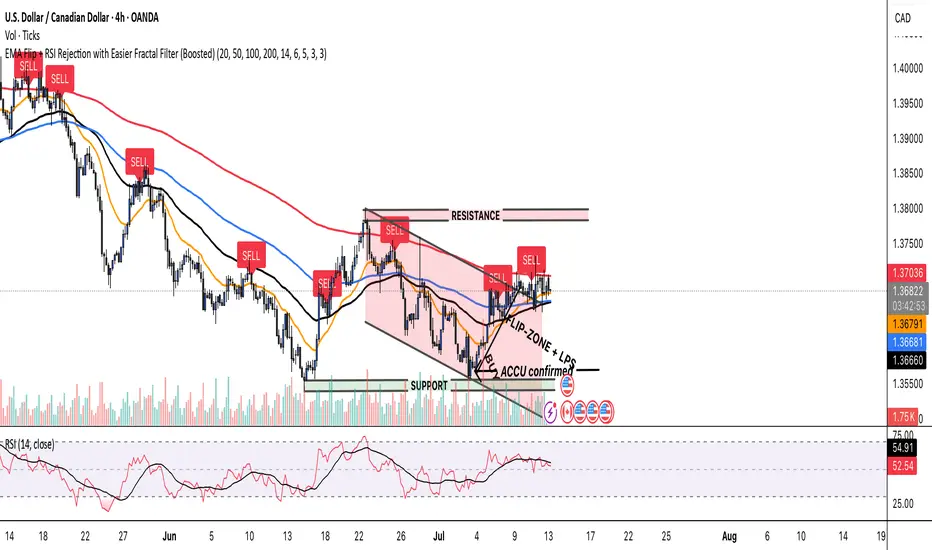
EMA Flip + RSI Rejection with Easier Fractal Filter (Boosted)SQUEEZE & FLIP for spotting LPSs and LPSYz. This Indicator identifies LPS and LPSYS
Major League Pro IndicatorUna estrategia la cual llevo annos utilizando la cuel me daa muy buenas oportunidades

Tnup Zones 2025This indicator marks zones where price has a high probability of rejection/bouncing off of


Profitable Loser Model [MMT]Profitable Loser Model
Overview
The Profitable Loser Model is a powerful PineScript v6 indicator designed to enhance your trading by visualizing key price levels, session open zones, Fibonacci retracements, and premium/discount zones. This overlay indicator provides traders with a customizable toolkit to analyze market structure across any timeframe, making it ideal for intraday and swing trading strategies.
Features
Open Zone Visualization
- Plots a box based on the open and close of the first candle in a user-defined timeframe (default: 5-minute).
- Customizable box color, projection offset, and label size (Tiny, Small, Normal, Large).
- Displays a timeframe label (e.g., "5m Open Zone") for quick reference, toggleable on/off.
Session Open Lines
- Optionally draws horizontal lines at key session opens (8:30 AM, 9:30 AM, 1:30 PM, Midnight, New York time).
- Customize line color, style (Solid, Dashed, Dotted), width, and label size for each session.
- Perfect for identifying critical intraday price levels.
Premium and Discount Zones
- Highlights premium (above midpoint) and discount (below midpoint) zones based on session high/low.
- Toggleable with customizable colors and projection offsets.
- Helps traders spot overbought/oversold areas for potential mean-reversion trades.
Fibonacci Retracement Levels
- Plots user-defined Fibonacci levels (default: 0.23, 0.35, 0.5, 0.62, 0.705, 0.79, 0.886, 1, 1.1).
- Customizable line style, width, color, and labels (showing percentage and/or price).
- Dynamically adjusts based on price movement relative to the open zone.
Take Profit (TP) and Stop Loss (SL) Levels
- Highlights TP (default: 0.23) and SL (default: 1.1) Fibonacci levels with distinct colors.
- Fully customizable to align with your risk-reward strategy.
How It Works
- Session Detection : Resets daily (or per user-defined timeframe) to capture the first candle's open, high, low, and close.
- Open Zone : Draws a box between the open and close, extended forward by the projection offset.
- Session Lines : Plots lines at specified session opens with customizable styles and labels.
- Fibonacci Retracement : Adjusts levels dynamically based on session high/low and price action.
- Premium/Discount Zones : Calculated from the session range midpoint, updated in real-time.
Settings
- Open Zone :
- Timeframe (default: 5m), Calculate Timeframe (default: Daily).
- Toggle label, adjust size, box color, and projection offset.
- Session Open Lines :
- Enable/disable lines for 8:30 AM, 9:30 AM, 1:30 PM, Midnight.
- Customize color, style, width, label size, and vertical offset.
- Premium/Discount Zones :
- Toggle visibility, set colors, and adjust projection offset.
- Fibonacci Retracement :
- Toggle visibility, set custom levels, line style, width, color, and label options.
- Adjust projection offset.
- TP/SL :
- Set TP/SL Fibonacci levels and colors.
Use Cases
- Intraday Trading : Use session open lines and open zones to trade key market hours.
- Swing Trading : Leverage Fibonacci levels for potential reversal or continuation zones.
- Risk Management : Set precise TP/SL levels based on Fibonacci retracements.
- Market Structure : Identify overbought/oversold zones with premium/discount areas.
Notes
- Optimized with `dynamic_requests = true` for efficient real-time data handling.
- Visual elements (boxes, lines, labels) are cleaned up at the start of each new session.
- Session lines use New York time (`America/New_York`) for alignment with major markets.
