Simple EMA Trend Strategy (No Filters)The Simple EMA Trend Indicator identifies bullish and bearish market trends using two exponential moving averages (EMAs) and a confirmation period. When a bullish trend is detected, it highlights candles in blue and prints a "BUY" signal. When the trend reverses to bearish, candles turn purple and a "SELL" signal is printed.
The trend direction remains active until a confirmed reversal is detected, helping traders stay in position during extended moves while reducing noise from short-term fluctuations. It’s optimized for clarity and simplicity—ideal for trend-following strategies.
⚙️ Key Features:
EMA Crossover Trend Detection
Buy/Sell Signals on Trend Reversals
Color-coded Candles: Blue for bullish, purple for bearish
Signal Persistence: Buy/sell remains active until trend reverses
Adjustable settings for EMAs and trend confirmation sensitivity
Candlestick analysis

Phiên Forex (UTC+7, nền cũ, cờ rõ)Time giao dịch Forex khớp với các phiên theo từng khung giờ cho cả tuần

option LevelsCollect ETF and futures options data to analyze intraday short-term support/resistance levels for guiding intraday trading take-profit/stop-loss decisions.
采集指数ETF和期货期权数据,分析日内短线支撑/阻力位置,用于指导日内交易止盈/止损。

option Levels采集指数ETF和期货期权数据,分析日内短线支撑/阻力位置,用于指导日内交易止盈/止损。
Collect ETF and futures options data to analyze intraday short-term support/resistance levels for guiding intraday trading take-profit/stop-loss decisions.

Tiny HA Candle - AmithMark tiny HA candles on Forex pairs and XAU pairs.
For Forex, all candles less than 100 pips and for XAU, all candles less than 500 pips are marked on the chart.

THEDU RSI VIP 999fva fsdcsdvs d vfsdvcsdffws d dsfsdfsfedfzcesfzxdcsedf fsadfef è szdcsdfsdfwec szc fdssdfddddđ

Pithis is pi cycle indicator for bitcoin
blue triangle indicates price higher than a week ago and higher than yesterday
orange one indicates price higher than a week ago but lower than yesterday
fuchsia one indicates price lower than a week ago but higher than yesterday
red one indicates price lower than a week ago and lower than yesterday

Samrat Alert with HalfTrendThis script used Halftrend Price and SMA combination to generate buy signal on multiple timeframes on various intruments

Hourly Markers 09:00 - 20:00 Adjusted for UTC+2A line for every hour from 0900 to 2200
Description:
This TradingView Pine Script plots small red markers (downward arrows) at the top of the chart for every full hour between 09:00 AM and 08:00 PM (20:00) based on UTC+2 time. The markers appear precisely at the opening minute of each hour within the defined range, helping traders visually track key time intervals during the day.
Features:
✔ Displays markers from 09:00 to 20:00 local time (UTC+2 adjustment)
✔ Only plots markers at the first minute of each hour
✔ Uses clear, unobtrusive triangle-down symbols above the bars
✔ Works on any chart timeframe that captures hourly intervals
Use Case:
Ideal for traders who want a quick visual reference of hourly intervals during the main trading hours, especially when working with charts set to UTC or different time zones.

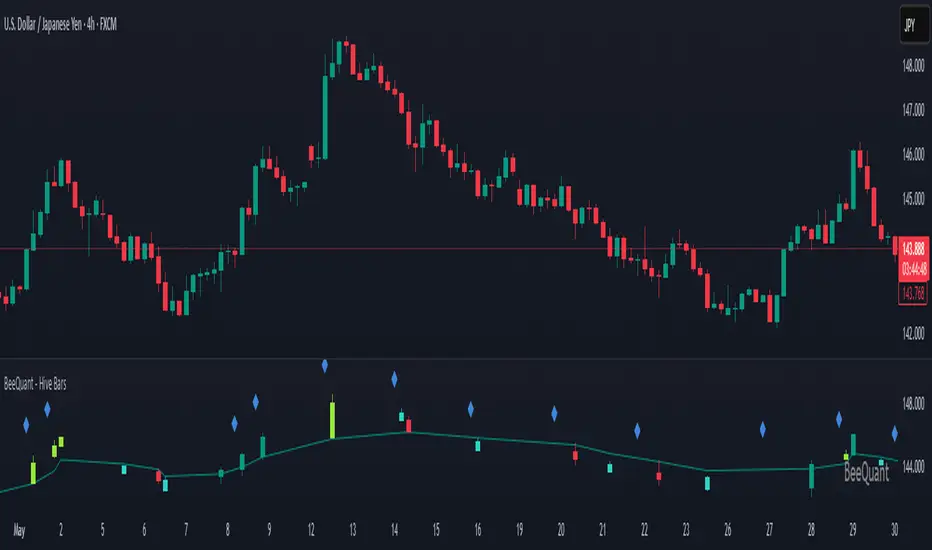
BeeQuant - Hive Bars🔶 OVERVIEW
The "Hive Bars" indicator is a truly revolutionary analytical instrument, meticulously engineered to transcend the limitations of conventional price charting and unveil the profound, underlying essence of market dynamics. Imagine possessing a sophisticated visual engine that intelligently reconstructs raw price data into unique, dynamically consolidated "Hive Bars." These specialized constructs intuitively reveal the dominant market momentum and highlight high-conviction signals often obscured by the ubiquitous noise of traditional candlesticks. This indicator acts as a precision filter, illuminating exactly when pivotal shifts are occurring by coloring these reconstructed units with an adaptive, unparalleled accuracy. It is expertly crafted for the discerning trader seeking an undeniable analytical advantage, offering a fresh, meticulously refined perspective that enables the discernment of concealed patterns, fostering more decisive and confident trading actions. Crucially, "Hive Bars" now feature proactive, real-time alert capabilities, ensuring no critical market inflection point ever goes unnoticed.
__________________________________________________________________________
🧠 CONCEPTS
At its intellectual core, the "Hive Bars" indicator operates upon an advanced, proprietary framework that fundamentally reinterprets market data. It presents this refined information through its unique "Hive Bars"—specialized visual constructs that dynamically encapsulate the consolidated spirit and true directional bias of price action, delivering unparalleled clarity.
⬜ Smart Bar Reconstruction: Hive Bars don’t follow time, they follow the market. They are derived through a sophisticated, multi-faceted internal process that precisely captures the dominant price influence and momentum over variable periods. This structure adapts dynamically to changing conditions, letting you see the real pressure behind price moves with consistency that time-based candles can’t match. This proprietary reconstruction creates a new, inherently consistent, and highly focused visual narrative of underlying market flow, effectively stripping away extraneous "noise" and revealing the market's authentic directional intent.
⬜ Multi-Layered Internal Analysis: A dynamic and live, adaptive line powers the core of Hive Bars. It recalibrates constantly, tracking market structure in real time. Every bar is formed in relation to this internal baseline, giving immediate context to price behavior. You choose the data that drives this line—open, close, high, low, or custom blends—to match your style.
⬜ Intelligent Bar Formation Sequences: Bars are created when the market speaks, not when the clock ticks. A built-in pattern engine reads the flow and waits for real structure to form. This allows the indicator to autonomously consolidate price action, presenting a cleaner, more coherent visualization of trend development as it truly unfolds, rather than fragmented snapshots based on time.
⬜ Visual Signal Precision: "Hive Bars" spring to life with an intuitively powerful coloring system. While primary colors (Green for upward bias, Red for downward bias) denote the prevailing market direction, the "Hive Bars" indicator introduces distinctively colored "Signal Hive Bars". These specialized bars emerge when the market price exhibits a particularly robust, high-conviction interaction with the adaptive internal baseline, standing out instantly and often mark key turning points or breakouts you want to act on.
⬜ Daily Reset Option: For intraday traders, there’s a reset feature that clears the internal build-up at the start of each new trading day. This ensures fresh, unbiased perspectives that are meticulously tailored to the distinct market dynamics and cyclic rhythms of the current trading day.
⬜ Adjustable Sensitivity: With Hive Smoothing, you’re in full control. This setting lets you fine-tune how sensitive the bars are to price movement. Want tighter, faster signals? Dial it down. Prefer broader, more filtered setups? Turn it up. You decide when a new Hive Bar forms—and when a Signal Bar confirms. It’s all based on how you trade and how your asset moves. No guesswork, no one-size-fits-all defaults. Hive Bars adapts to your strategy and trading style, not the other way around.
__________________________________________________________________________
✨ FEATURES
The "Hive Bars" indicator is equipped with a comprehensive suite of cutting-edge features, designed for unparalleled clarity, adaptive responsiveness, augmented analytical depth, seamless interoperability with your broader analytical toolkit, and proactive real-time notifications:
🔹Proprietary Hive Bar Reconstruction
Experience a uniquely advanced visual representation of price action that dynamically consolidates market data, leading to enhanced trend and momentum clarity that goes beyond standard charting and candlestick data.
🔹Customizable Internal Analysis Line
Gain precise control over the underlying adaptive baseline's calculation by selecting various internal price source options, ensuring its alignment with your specific analytical focus.
🔹 Smart Alerts for Key Events 🔔
Get notified in real time when:
◦ A new Hive Bar completes – signaling a fresh structural range reset
◦ A new Signal Hive Bar closes – identifying a potential overbought or oversold condition
Built-in alert conditions make it easy to stay ahead of shifts without watching every candle manually.
🔹Intelligent Bar Formation Sequencing
Diamond-shaped markers clearly indicate the start of the indicator's internal combination logic for enhanced visual understanding.
🔹High-Conviction "Signal Hive Bars" (Distinct Colors)
Receive specialized, uniquely colored visual alerts when Hive Bars exhibit strong, decisive movements relative to the adaptive baseline, indicating moments of heightened market conviction and potential opportunity.
🔹Session-Based Reconstruction
Opt for the "Daily New Start" to intelligently reset the indicator's perspective with each new trading day, providing fresh, session-aligned insights tailored for intraday precision.
🔹Unrivaled External Indicator Collaboration
A truly unique and powerful advantage of "Hive Bars" is its capability to seamlessly integrate and profoundly enhance the performance of other external indicators. By outputting clean, smoothed price data, it lets you feed a higher-quality source into tools like RSI, MACD, moving averages etc. Use close for indicators like RSI, and close for moving averages. The result is better clarity, fewer false signals, and a stronger edge across your setup. Hive Bars isn’t just an indicator, it’s an upgrade for everything you use.
🔹Non-Repainting Historical Integrity
Hive Bars never repaints. Each bar is locked in only after all internal conditions are fully met. This means you can trust every historical signal—it won’t shift or vanish after the fact. What you see in hindsight is exactly what was shown in real time.
🔹Universal Timeframe Compatibility
Whether you're scalping on the 1-minute chart or analyzing multi-month trends, Hive Bars delivers consistent, clean insights. Its architecture adapts to any timeframe without losing fidelity, making it a reliable tool for any strategy or style.
🔹Cross-Market Versatility
Hive Bars is engineered to perform with precision across all major markets—whether you're trading forex, commodities, stocks, or indices. Its adaptive logic automatically aligns with the unique volatility and structure of each asset class, delivering consistently reliable insights no matter where you trade.
__________________________________________________________________________
⚙️ USAGE
Integrating the "Hive Bars" indicator into your daily analytical regimen is an intuitive process that will profoundly enhance your ability to discern crucial market dynamics and spot high-conviction opportunities with unprecedented clarity:
💁 Effortless Application
Simply add the "Hive Bars" indicator to any chart within your TradingView platform. Note that it plots on a separate panel below your main price chart to provide its unique visual output without obscuring the primary price action.
📊 Strategic Calibration
Access the indicator's comprehensive settings panel to meticulously calibrate its powerful engines and unlock its full potential:
⚙ "Internal EMA Config"
Configure the internal adaptive baseline by choosing its source (e.g., CLOSE, HL/2) and its specific EMA length. This shapes the core reference point for the dynamic formation of the "Hive Bars."
🤖 "CONFIG Group"
Here, you decide if you want "Daily New Start" for session-based analytical resets (particularly beneficial for intraday strategies). The "Hive Smoothing" input allows you to control a further layer of consolidation for the "Hive Bars."
🟩🟥 "Color": Customize the appearance of both standard "Hive Bars" and "Signal Hive Bars" to suit your visual preferences, enhancing their immediate interpretability.
🧭 Empirical Exploration
Experimentation with these parameters is paramount. Dedicate time to exploring different combinations across various assets and timeframes to discover the optimal configuration that resonates with your unique trading methodology and the inherent volatility of the market being analyzed.
👀 Interpreting the Unveiled Market Reality: Once calibrated, the "Hive Bars" will present a strikingly clear and actionable picture of market dynamics:
+ Green/Red Hive Bars: These visually denote the consolidated directional bias of the market over the reconstructed period. A sustained sequence of Green "Hive Bars" suggests pervasive bullish pressure and an upward path of least resistance, while a series of Red "Hive Bars" indicates dominant bearish control and a clear downward momentum.
+ "Signal Hive Bars" (Distinct Colors): Pay close attention to these specially colored "Hive Bars." They signify critical moments where the reconstructed price action exhibits a particularly strong, high-conviction interaction with its adaptive internal baseline. These often precede or confirm significant market movements and serve as your clearest, most reliable visual triggers for potential shifts in market control.
⛓️ Intermittent Appearance: Observe that "Hive Bars" do not necessarily appear for every single native time unit of your chart. They are intelligently reconstructed and consolidated representations of price action, appearing only when specific internal conditions are met to present a coherent, high-impact view of distinct market phases.
🔗 Harnessing Advanced External Synergy: To unlock a new dimension of analytical power, profoundly enhance your existing indicator suite by integrating the output of "Hive Bars" as the data source for other external indicators. When adding or configuring indicators such as RSI, Stochastic Oscillators, various Moving Averages (EMA, SMA), or any other indicator that prompts for a 'source' input, you can now select the purified output of the "Hive Bars" as your desired data stream.
For oscillators (e.g., RSI, MACD), select the close or a similar relevant output from "Hive Bars" as your source. This allows the oscillator to react to the purified, consolidated momentum of the "Hive Bars" rather than the potentially noisy raw price data, leading to smoother and more meaningful oscillator signals.
For moving averages (e.g., EMA, SMA), utilize the close or other pertinent "Hive Bar" output as your source. This provides an exceptionally smooth, highly responsive, and less choppy average that precisely tracks the true underlying trend as identified by "Hive Bars." This unique capability allows for the construction of powerfully layered and synergistic trading strategies.
📢 Setting Up Proactive Alerts for Critical Events: Leverage the newly incorporated alert capabilities to maintain real-time awareness of pivotal market developments, even when not actively monitoring your charts.
You can now choose to be alerted specifically when a "New Hive Bar Closed" (signifying the definitive completion of a major market phase as identified by the indicator) or when a "New Signal Hive Bar Closed" (highlighting a high-conviction market event that warrants immediate attention due to its pronounced significance).
__________________________________________________________________________
⚠️ LIMITATIONS
While the "Hive Bars" indicator is an incredibly powerful and advanced tool for dissecting market dynamics, it is vital to understand its inherent design parameters and the prevailing platform-specific constraints for optimal and informed utilization:
👉 Visual Gaps in Plotting: Due to current platform limitations pertaining to custom candle plotting functionality, you may occasionally observe visual gaps or intermittent non-contiguous plotting between "Hive Bars" on the chart. They’re not missing data, but a result of strict plotting rules. A bar is only drawn when all internal conditions are met. This ensures accuracy, even if the chart shows some spacing.
👉 Complementary Tool: This indicator excels at providing high-conviction directional insights and identifying significant market phases. However, it is fundamentally designed as a sophisticated complementary tool to a broader trading strategy, not as a standalone, all-encompassing system. Its true power is unlocked when integrated with other analytical methods.
👉 Input Calibration Essential: The efficacy and depth of insights derived from the "Hive Bars" are highly dependent on the careful and thoughtful calibration of its input parameters, including the "Internal EMA Config," "Hive Smoothing" setting. Optimal results necessitate empirical user experimentation and fine-tuning to discover the configurations best suited for specific assets, analytical objectives, and market conditions.
👉 Exclusion of Auxiliary Data: The "Hive Bars" indicator's primary focus is exclusively on transforming and presenting price data. It does not natively incorporate other vital market information such as fundamental economic data, or news events. Integrating these additional analytical layers remains an essential aspect of constructing a truly comprehensive and robust trading strategy.
█ ▒▒▒▒▒▒▒▒▒▒▒▒▒▒▒▒▒▒▒▒▒▒▒ 『•••• ✎ ••••』 ▒▒▒▒▒▒▒▒▒▒▒▒▒▒▒▒▒▒▒▒▒▒▒▒ █
🎯 CONCLUSION
The "Hive Bars" indicator offers an unparalleled, intuitively accessible, and highly adaptable framework for instantly grasping true price momentum and direction through its intelligent, non-repainting reconstruction of market data. By transforming chaotic raw data into strikingly clear, high-conviction "Hive Bars" and dynamic signals, and now with proactive alerts to highlight critical moments, it empowers you to cut through distractions and identify market currents with unprecedented ease. Think of it as a custom lens for the market. It filters out the clutter and shows you the real structure—bars formed not by time, but by intent. It's about seeing the unseen, with enhanced clarity and a deeper understanding of market forces, now with the power to supercharge all your other tools and keep you informed. No fluff. No hype. Just an edge you can actually see—and use.
▣▣▣▣▣▣▣▣▣▣▣▣▣▣▣▣▣▣▣▣▣▣▣▣▣▣▣▣▣▣▣▣▣▣▣▣▣▣▣▣▣▣▣▣▣▣▣▣▣▣▣
🚨 RISK DISCLAIMER
Engagement in financial market speculation inherently carries a substantial degree of inherent risk, and the potential for capital diminution, potentially exceeding initial deposits, is a pervasive and non-trivial consideration. All content, algorithmic tools, scripts, articles, and educational materials disseminated by "Hive Bars" are exclusively purposed for informational and pedagogical objectives, strictly for reference. Historical performance data, whether explicitly demonstrated or implicitly suggested, offers no infallible assurance or guarantee of future outcomes. Users bear sole and ultimate accountability for their individual trading decisions and are emphatically urged to meticulously assess their financial disposition, risk tolerance parameters, and conduct independent due diligence prior to engaging in any speculative activity.
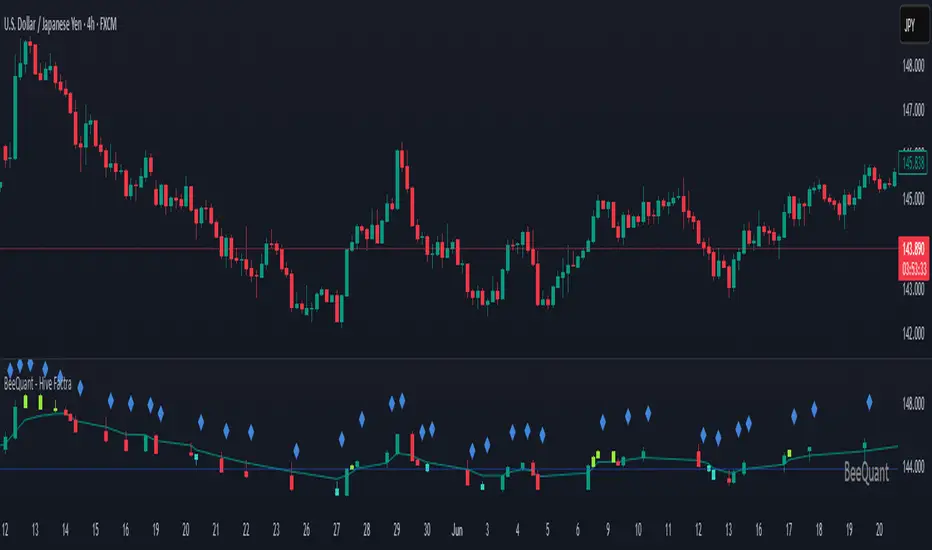
BeeQuant - Hive Factra🔶 OVERVIEW
The "Hive Factra" is a groundbreaking analytical instrument designed to unveil the true essence of market movement, transforming complex price action into powerfully consolidated insights. Imagine having a specialized lens that intelligently reconstructs market periods into unique "Hive Factra Bars," revealing underlying momentum and high-conviction signals often obscured in traditional charts. This indicator cuts through the noise, showing you precisely when significant shifts are occurring by coloring these reconstructed bars with an adaptive precision. It's built for traders who seek unfiltered perspective that helps see hidden patterns and make more decisive moves.
__________________________________________________________________________
🧠 CONCEPTS
Markets move in impulses and compressions. Most trend indicators rely on single-frame slope logic, which often flips during minor pullbacks. Hive Factra takes a different route. At its core, the "Hive Factra" operates on a sophisticated framework that reinterprets market data, presenting it through its proprietary "Hive Factra Bars", unique visualizations that capture the consolidated spirit of price action.
⬜ The "Hive Factra" Reconstruction: Unlike standard candles, "Hive Factra Bars" are intelligently re-engineered representations of market activity. They are derived through a proprietary process that captures the dominant price influence over specific periods, presenting a clearer, more focused view of underlying momentum. These unique bars visually consolidate information, making the core directional bias immediately apparent.
⬜ The Adaptive Baseline: An internal, dynamic analysis line constantly adjusts to market flow, serving as a crucial reference point for the "Hive Factra Bars." This adaptive baseline provides real-time context, helping the indicator precisely determine the significance of each reconstructed bar's movement.
⬜ High-Conviction Coloring & Signal Bars: The "Factra Bars" come to life with a discerning coloring system. While they reflect the primary market direction (Green for upward bias, Red for downward bias), the "Hive Factra" introduces specialized "Signal Hive Bars" with distinct colors. These unique bars appear when the consolidated price action exhibits a particularly strong, high-conviction interaction with the adaptive baseline, acting as powerful visual alerts for moments of heightened significance.
⬜ Session-Aligned Insights: For intraday traders, the "Daily New Start" option provides a unique advantage. When enabled, the indicator can reset its internal reconstruction process with each new trading session, offering fresh, unbiased perspectives tailored to the day's distinct market dynamics.
⬜ Dynamic Sensitivity: A configurable "Offset" allows you to fine-tune the indicator's responsiveness and the thresholds for initiating these "Hive Factra Bars" and "Signal Hive Bars." This ensures the indicator aligns perfectly with your individual trading style and the volatility of the asset you're analyzing.
__________________________________________________________________________
✨ FEATURES
The "Hive Factra" is equipped with a suite of cutting-edge features, all meticulously designed for unparalleled clarity, adaptive responsiveness, and augmented analytical depth:
🔹 Proprietary Hive Factra Bars
Experience a unique visual representation of price action that consolidates market data for enhanced trend and momentum clarity.
🔹 Customizable Internal Analysis Line
Control the underlying adaptive baseline's calculation for precise alignment with market flow, utilizing various price source options.
🔹 High-Conviction "Signal Hive Bars" (Distinct Colors)
Receive specialized visual alerts when Factra Bars exhibit strong, decisive movements relative to the adaptive baseline, indicating moments of heightened market conviction.
🔹 Overbought/Oversold Visuals
Signal Hive Bars highlight areas of potential exhaustion, providing intuitive insight into stretched conditions
🔹 Session-Based Reconstruction
Opt for the "Daily New Start" to reset the indicator's perspective with each new trading day, providing fresh, session-aligned insights.
🔹 Dynamic Offset Control
Adjust the "Offset" parameter to fine-tune the sensitivity of the Factra Bar reconstruction and signal generation thresholds, tailoring the indicator to specific market conditions.
🔹 Non-Repainting Logic for Historical Reliability
Each "Hive Factra Bar" is plotted only when its internal reconstruction conditions are fully met and confirmed. This ensures that the historical display of Factra Bars does not repaint, providing a high degree of reliability and trust in past signals and visualizations.
🔹 Cross-Market Versatility
This indicator is engineered to perform with precision across all major markets—whether you're trading forex, commodities, stocks, or indices. Its adaptive logic automatically aligns with the unique volatility and structure of each asset class, delivering consistently reliable insights no matter where you trade.
🔹 Custom Range Start Marker
A subtle diamond-shaped symbol is plotted to indicate the start of the Hive Factra logic cycle. This marks the bar from which the internal price range begins accumulating until a new Hive Factra Bar is confirmed and displayed. Helps visualize the dynamic evaluation period used in Factra’s structural detection.
🔹 Smart Alerts for Key Events
Get notified in real time when:
◦ A new Hive Factra Bar completes – signaling a fresh structural range reset
◦ A new Signal Hive Bar closes – identifying a potential overbought or oversold condition
Built-in alert conditions make it easy to stay ahead of shifts without watching every candle manually.
🔹 Universal Timeframe Compatibility: The "Hive Factra" is meticulously engineered to perform flawlessly across all timeframes, from rapid intraday charts to long-term weekly and monthly views. This universal compatibility ensures you receive consistent, high-quality insights regardless of your analytical horizon.
🔹 Unrivaled External Indicator Collaboration: A truly unique advantage of the "Hive Factra" is its capability to seamlessly integrate and enhance the performance of other external indicators. Its meticulously processed output, can serve as a highly purified and consolidated 'source' for indicators that accept such inputs (e.g., RSI, StochRSI, moving averages), which allows for more insightful data stream into your favorite indicators, potentially unlocking new levels of responsiveness and signal accuracy for your entire analytical setup.
__________________________________________________________________________
⚙️ USAGE
Integrating the "Hive Factra" into your daily analytical regimen is intuitive and will profoundly enhance your ability to discern crucial market dynamics and spot high-conviction opportunities:
💁 Effortless Application
Simply add the "Hive Factra" indicator to any chart within your TradingView platform. Note that it plots on a separate panel below your main price chart to provide its unique visual output without obscuring price.
📊 Tailored Calibration: Access the indicator's settings to unlock its full potential:
⚙ "Internal EMA Config"
Configure the internal adaptive baseline by choosing its source (e.g., Close, HL/2) and length. This shapes the core reference point for the Factra Bars.
⚙ "Hive Factra"
Decide if you want "Daily New Start" for session-based analysis and choose the "Source" type for how the Factra Bars are built.
🤖 "Offset"
Experiment with the "Offset" percentage to adjust the sensitivity of the Factra Bar's reconstruction. A smaller offset will make the Factra Bars appear more frequently, while a larger one will highlight only more significant movements.
🟩🟥 Green/Red Hive Factra Bars
These indicate the consolidated directional bias of the market over the reconstructed period. A sequence of Green bars suggests sustained bullish pressure, while Red bars point to dominant bearish control.
🚀 "Signal Hive Bars" (Unique Colors)
Pay close attention to these specially colored Hive Factra Bars. They signify moments where the reconstructed price action exhibits a high-conviction interaction with its adaptive baseline, often preceding or confirming significant market moves. These are your clearest signals for potential shifts.
✨ Appearance of Hive Factra Bars
Notice that these Bars do not necessarily appear for every single time unit. They intelligently reconstruct and consolidate price action, appearing only when conditions align to present a coherent, high-impact view of market phases.
🪢 Harnessing External Synergy
To unlock a new dimension of analysis, consider integrating "Hive Factra" as the data source for other indicators:
1. When adding indicators like RSI, StochRSI, or others that prompt for a 'source' input, you can select the "Hive Factra" as the input.
2. For oscillators (e.g., RSI, Stochastic), choose the close or similar output from "Hive Factra" as your source. This allows the oscillator to react to the purified, consolidated momentum of the Factra Bars rather than raw price.
For moving averages (e.g., EMA, SMA), use the close or other relevant Factra Bar output as your source. This provides an exceptionally smooth and responsive average that tracks the true underlying trend.
__________________________________________________________________________
⚠️ LIMITATIONS
While the "Hive Factra" is an incredibly powerful tool for dissecting market dynamics, it's vital to understand its design parameters for optimal use. It does not attempt to front-run reversals or predict market turns. Instead, it focuses on framing price behavior so traders can react with context.
👉 Visual Gaps in Plotting: Due to Tradingview platform limitations with custom candle plotting functionality, you may observe visual gaps between "Hive Factra Bars" on the chart. This occurs because the indicator only plots a Hive Factra Bar when its internal conditions for reconstruction are fully met, and there isn't an 'offset' parameter for custom candles to bridge these visual discontinuities. Importantly, this behavior ensures that each plotted Factra Bar is confirmed and does not repaint, providing reliable historical analysis.
👉 Reconstructed Data, Not Raw Price: It's crucial to remember that "Hive Factra Bars" are not traditional candles. They are a derived visualization that intelligently consolidates price data.
👉 Complementary Tool: This indicator excels at providing high-conviction directional insights and identifying significant market phases. However, it is designed as a sophisticated complement to a broader trading strategy, not a standalone system.
👉 Input Calibration Essential: The effectiveness of the "Hive Factra" is highly dependent on careful calibration of its input parameters, especially the "Offset" and internal EMA settings. Optimal results require user experimentation to find settings best suited for specific assets and timeframes.
👉 Exclusion of Auxiliary Data: The "Hive Factra" focuses solely on transforming price data. It does not incorporate other vital market information such as trading volume, market breadth, or fundamental news. Integrating these additional analytical layers remains essential for a comprehensive trading strategy.
█ ▒▒▒▒▒▒▒▒▒▒▒▒▒▒▒▒▒▒▒▒▒▒▒ 『•••• ✎ ••••』 ▒▒▒▒▒▒▒▒▒▒▒▒▒▒▒▒▒▒▒▒▒▒▒▒ █
🎯 CONCLUSION
The "Hive Factra" offers an unparalleled, intuitive, and highly adaptable framework for instantly grasping true price momentum and direction through its intelligent reconstruction of market data. By transforming chaotic raw data into strikingly clear, high-conviction "Factra Bars" and dynamic signals, it empowers you to cut through distractions and identify critical market currents with ease. Its revolutionary capability for seamless collaboration with external indicators (like RSI, EMA, etc., by using its purified output as their source) means you can elevate the performance of your entire analytical suite to new levels of precision and clarity. Seamlessly integrate this advanced visual tool within your analytical framework to gain a sharper, more confident perspective, and elevate your strategic decision-making in the markets. It's about seeing the unseen, with enhanced clarity and a deeper understanding of market forces, now with the power to supercharge all your other tools.
▣▣▣▣▣▣▣▣▣▣▣▣▣▣▣▣▣▣▣▣▣▣▣▣▣▣▣▣▣▣▣▣▣▣▣▣▣▣▣▣▣▣▣▣▣▣▣▣▣▣▣
🚨 RISK DISCLAIMER
Engagement in financial market speculation inherently carries a substantial degree of inherent risk, and the potential for capital diminution, potentially exceeding initial deposits, is a pervasive and non-trivial consideration. All content, algorithmic tools, scripts, articles, and educational materials disseminated by "Hive Factra" are exclusively purposed for informational and pedagogical objectives, strictly for reference. Historical performance data, whether explicitly demonstrated or implicitly suggested, offers no infallible assurance or guarantee of future outcomes. Users bear sole and ultimate accountability for their individual trading decisions and are emphatically urged to meticulously assess their financial disposition, risk tolerance parameters, and conduct independent due diligence prior to engaging in any speculative market activity.
indicador de pips y lotesThis is an indicator that displays pips based on the current full candle, and you can also measure risk by changing the amount of money you risk to convert it to how many lots you will enter into the position.


first 5 minutes NY session)I created this indicator myself to identify the first 5 minutes of the New York session, during which it automatically draws the lines. It's a strategy that has helped me a lot.

Highlight Highest Volume CandleHow it works:
lookback: how many bars to look back for highest volume (default 50).
highestVol: the maximum volume in that range.
isHighestVol: true if the current candle’s volume equals that maximum.
plotcandle: draws the candle in bright yellow.
plotshape: adds a small triangle below the bar for extra visibility.

EMA Crossover with DiamondsGreen diamond when 20 exponential moving average crosses over 50 exponential moving average, and shows a red diamond when 50 moving average crosses over 20 exponential moving average

THE WICKLESS CANDLE By [VXN]The Wickless Candles Strategy - Comprehensive Analysis
Core Concept
The "Wickless Candles" strategy is a technical analysis approach that identifies specific candlestick formations where one side of the candle has no wick, indicating strong directional momentum and potential support/resistance levels.
What Are Wickless Candles?
Bullish Wickless Candles
Meaning: A green candle where the opening price equals the lowest price
Significance: Shows that buyers immediately took control and never let price fall below the opening level
Implication: The opening price becomes a strong support level
Bearish Wickless Candles
Meaning: A red candle where the opening price equals the highest price
Significance: Shows that sellers immediately dominated and never let price rise above the opening level
Implication: The opening price becomes a strong resistance level
Visual Strategy Elements
Support/Resistance Lines
Bullish Lines: Green horizontal lines drawn at the low (open) price of wickless bullish candles
Bearish Lines: Red horizontal lines drawn at the high (open) price of wickless bearish candles
Extension: Lines project forward for 5 bars (configurable) to highlight key levels
Purpose: These levels often act as future support/resistance zones
Advanced Volume Analysis (4:00 AM - 9:29 AM Session)
Volume Calculations
Market Dominance Indicators
🟢🟢🟢🔴: Buyer dominance (more buying pressure)
🔴🔴🔴🟢: Seller dominance (more selling pressure)
🟢🟢🔴🔴: Balanced market (equal pressure)
Comprehensive Statistics Monitor
Wickless Candle Metrics
Bullish Count: Total number of bullish wickless candles detected
Bearish Count: Total number of bearish wickless candles detected
Total Wickless: Combined count of all wickless formations
Max Scanned: Total number of candles analyzed
Percentages: Bullish vs bearish distribution ratios
Volume Intelligence
Current Volume: Real-time session volume in millions
Buyer/Seller Percentages: Relative strength of each side
Market Dominance: Visual representation of controlling force
Strategic Applications
Entry Signals
Long Entries: Near bullish wickless candle support lines
Short Entries: Near bearish wickless candle resistance lines
Confirmation: Use volume dominance to confirm directional bias
Market Context
Institutional Interest: Wickless candles often indicate large player activity
Price Rejection: Shows where market participants strongly defended levels
Momentum Confirmation: Volume analysis validates the strength behind moves
Key Advantages
Objective Identification: Clear mathematical criteria for wickless formations
Real-Time Monitoring: Live statistics and volume analysis
Multi-Timeframe Application: Works across different chart intervals
Alert System: Automatic notifications when new levels are established
Visual Clarity: Easy-to-spot support/resistance lines on chart
This strategy combines traditional candlestick analysis with modern volume profiling to identify high-probability trading zones where institutional and retail sentiment align at specific price levels.

Opening Candle Indicator FinalAll previous versions were subject to bugs after review, so this final version has been released with the same features as previous versions and is error-free.
Note for those trading outside the Saudi and US markets: You can track any market with a specific trading session start and end time by selecting "Custom" from the settings menu and then setting the start and end times for the trading session.
جميع الاصدارات الماضية كانت بعد الفحص تصدر بعض الأخطاء البرمجية لذلك تم إصدار هذا الاصدار النهائي بنفس المميزات للإصدارات الماضية ولا يوجد بها أخطاء.
ملاحظة لكل من يتدوال خارج السوق السعودي والأمريكي : يمكن متابعة أي سوق له وقت بداية ونهاية جلسة تدوال وذلك عن طريق إختيار مخصص من قائمة الاعدادت ثم وضع وقت بداية ونهاية جلسة التدوال

reversalthis is a simple ema indicator. i specifically set my fast ema to 4 and my slow ema to 13. i only turn on signals after 9;30 am and wait for the ema cross signal to fire once a swing point has been sweeped. i follow the daily. If the daily high has been sweep the previous day and or closed then we are taking highs therefor bullish bias. vice versa for sells. if bullish then only take bullish 4/13 ema cross.THIS CROSS IS MY SIGNAL THAT THERE IS A POTENTIAL CHANGE OF ORDERFLOW, YOU MUST VERIFY THAT THERE IS INDEED A BREAKER BLOCK BEFORE ENTERING. i dont actually just follow a simple ema cross. it means something.

Pro Scalping Strategy [1Min | No Repaint | High Precision]Pro Scalping Strategy
Dual-Mode Precision Scalping System | EMA Trend + RSI + ATR | Non-Repainting
🔍 Overview
This indicator is a precision-engineered scalping tool optimized for lower timeframes (1–5 min), offering stable Buy/Sell signals without repainting.
Built on a robust trend-following framework, this system gives you the choice of two operating modes:
🔒 High Accuracy: Strict filters, fewer but stronger signals
⚡ More Signals: Looser filters, more frequent entries
🧠 How It Works
The logic is based on a multi-filter engine applied on closed candles only, ensuring non-repainting, clean, and confirmed entries.
⚙️ Technical Filters Used
1. EMA Trend Stack
Defines market trend using 3 EMAs (9, 21, 50)
Buy: EMA9 > EMA21 > EMA50
Sell: EMA9 < EMA21 < EMA50
2. EMA Crossover Filter
A confirmed crossover or crossunder is required from 2 candles back
Ensures trend momentum is validated before signal appears
3. EMA Slope Filter
Only accepts signals if mid EMA (EMA21) is sloping in trend direction
4. RSI Filter
Filters out signals when RSI is too extreme
RSI < overbought for Buy / RSI > oversold for Sell
5. ATR Filter
Confirms market has enough volatility
ATR must exceed a minimum threshold
✅ Modes Comparison
Feature High Accuracy Mode More Signals Mode
Min EMA Gap 0.1 0.05
Min ATR 0.2 0.1
RSI Range 30–70 25–75
Entry Frequency Lower Higher
Signal Quality Tighter + Stronger Looser + Flexible
🔔 Features
🔁 No repaint logic
⚙️ Adjustable settings with simple mode switch
⚡ Real-time alerts via alertcondition()
✅ Visual confirmation with BUY/SELL labels
💹 Suitable for scalping crypto, forex, gold, indices, and more
📌 Author: ALIP FX
“Success Elevated, Trade Smarter.”

VolatilityGuard Scalper (Sin Restricciones Horarias)(Trend Reversals)
Description:
VolatilityGuard Scalper is a scalping strategy designed to capture retracements in strong trends, optimized for volatile markets such as cryptocurrencies (BTC, ETH), gold (XAU/USD), S&P 500 and DAX 40 futures. It uses a 30-period EMA to identify the trend, retracement zones based on price action, and volume filters (1.2x 30-bar SMA) and spread (maximum 15 pips) to trade only in optimal conditions. With a robust risk management (stop-loss 2x ATR, take-profit 1.8x ATR, trailing stop), it is ideal for intraday traders without time restrictions.
Main Features:
Indicators:
30-period EMA to define up/down trends.
Recoil zones calculated with maximum/minimum of 3 bars.
Above average volume (1.2x 30-bar SMA).
ATR (14) for stop-loss, take-profit and trailing stop.
Maximum spread filter (15 pips).
Tickets:
Buy: Uptrend (price > EMA, EMA going up), price in retracement zone, high volume, acceptable spread.
Sell: Downtrend (price < EMA, EMA going down), price in retracement zone, high volume, acceptable spread.
Risk Management:
Stop-loss: 2x ATR from the entry price.
Take-profit: 1.8x ATR from the entry price.
Trailing stop: 1x ATR with 0.5x ATR offset.
Risk per operation: 0.5% of the capital (adjustable).
Dynamic position size based on ATR and spread.
Markets and Time Frames:
BTC: 2H (86% correct) to 4H (90% correct, recommended)
DAX40:https://www.tradingview.com/x/vGlk1lxG/


