SMA Smooth Market Structure (Multi-Timeframe)SMA Market Structure (Multi-Timeframe) is a powerful tool for tracking structural price action, using simple moving averages across any higher timeframe (HTF). It blends Smart Money Concepts with clean swing logic to reveal trend shifts, breaks of structure, and supply/demand zones.
This indicator highlights key structure features:
• Break of Structure (BOS) – Automatic detection of bullish or bearish swing breaks
• Internal Shifts – Early clues that the market is building toward a reversal
• Liquidity Sweeps (LS) – Detects swing failures that may trap traders
• Zigzag Swing Lines – Cleanly connects swing highs and lows
• Dynamic Zones – Demand (green) and supply (red) blocks drawn from engulfing breakouts
How to Use:
• Set your preferred HTF (e.g. 1H on a 15m chart) to view structure in proper context and
adjust SMA to smooth out market structure for directional consistency
• Watch BOS lines and swing labels like HH, HL, LH, LL for directional clarity
• Use the MS (Market Shift) label to identify full reversals after internal shifts + BOS
• Demand/Supply zones mark areas of previous strength and will update or mitigate automatically
• Alerts notify you of every BOS, MS, HH, LL, and LS event — no need to monitor manually
Customization Features:
• Toggle visibility of market shift markers, internal shifts, and zones
• Choose how internal shifts are calculated (High/Low or Open)
• Customize line style, width, and colors for BOS and zigzag lines
• Control zone duration and how mitigated zones behave (fade or delete)
• Built-in safety for Pine Script’s history limits using smart offset caps
Best Use Tips:
• Combine with price action patterns or volume for confirmation
• MS + BOS + zone tap often marks a high-probability reversal setup
• Use it to align lower timeframe entries with higher timeframe structure
For traders who want structure clarity without clutter, this tool is built to keep your chart actionable and adaptive.
Candlestick analysis

Z-Score Volume with CVD ConfirmationZ-Score Volume with CVD Confirmation is a volume-based confluence tool that enhances traditional volume analysis by combining Z-Score volume anomalies with Cumulative Volume Delta (CVD) confirmation. This indicator helps traders identify unusual volume activity that aligns with directional order flow, offering a cleaner signal for potential breakout or reversal scenarios.
🔍 Key Features:
Z-Score Calculation: Measures how extreme current volume is relative to its recent average, highlighting statistically significant surges or drops.
CVD Confirmation: Uses Cumulative Volume Delta candles (open/high/low/close) to assess buying vs. selling pressure in lower timeframes.
Bar Color Logic:
Green: High Z-Score volume confirmed by CVD bullish candle
Red: High Z-Score volume confirmed by CVD bearish candle
Other color bands show progressively strong or weak volume outliers
Real Volume Bar Heights: Volume bars retain true scale while color reflects underlying order flow strength and direction.
💡 Use Cases:
Breakout validation: Confirm price range breaks when volume surge is supported by CVD direction
Fade setups: Detect unsustainable high-volume moves lacking CVD support
Trend continuation: Spot momentum when both Z-Score and CVD align in the direction of the trend
⚙️ How to Use:
Adjust the Z-Score length to define how far back to measure average and deviation.
Select your anchor timeframe (typically 1D) and a lower timeframe for CVD calculations (e.g., 1-minute).
Use color-coded volume bars to assess volume significance and directional flow at a glance.
Add the standard volume indicator to the chart so one can compare the difference between the standard volume indicator and the Z-Score Volume with CVD Confirmation script. Useful at specific price levels and exiting ranges or not.

Opening candle indicator
The indicator only works in the US and Saudi markets. Its idea is to draw a line for the highest and lowest prices of the first opening candle on a five-minute frame. A break of the highest price of the candle means a buy, while a break of the lowest price of the candle means a sell. Three lines are drawn as price targets calculated at twice the length of the opening candle... The lines in the previous trading session disappear when the current session begins.
Exponential moving averages can be used to help decide whether to stay in the trade or sell.
When using the indicator, you must go to the indicator settings and change the market.
يعمل هذا المؤشر فقط في السوقين الأمريكي والسعودي. وتتمثل فكرته في رسم خط لأعلى وأدنى سعرين للشمعة الافتتاحية الأولى على إطار زمني مدته خمس دقائق. كسر أعلى سعر للشمعة يعني الشراء، بينما كسر أدنى سعر للشمعة يعني البيع. تُرسم ثلاثة خطوط كأهداف سعرية محسوبة بضعف طول الشمعة الافتتاحية... تختفي خطوط جلسة التداول السابقة عند بدء الجلسة الحالية.
يمكن استخدام المتوسطات المتحركة الأسية للمساعدة في تحديد ما إذا كان ينبغي الاستمرار في التداول أم البيع. عند الرغبة في استخدامه يجب الذهاب لإعدادت المؤشر وتحديد السوق إما الأمريكي أو السعودي.

NF Liquidity Sweep TrackerNF Liquidity Sweep Tracker
A tool for detecting stop hunts, reversals, and liquidity grabs
Built for Smart Money Concepts (SMC) and ICT-style trading
🔧 Full Features Usage -
🔹 1. Lookback Period
How it works: Automatically finds recent swing highs and lows using a configurable Swing High/Low Detection.
Forms the foundation for detecting liquidity levels. These are potential areas where price may reverse or sweep.
🔹 2. Liquidity Sweep Detection
Detects price movements that break through swing points, often used by institutions to trigger stops.
Modes Available:
Wick-Based Sweeps: Price wicks above/below a swing but closes back inside.
Indicates a possible stop hunt or false breakout. Shown as Label: LS
Break- Retest Based Sweeps: Price breaks the swing level and continues or retests the zone.
Helps confirm continuation or retest setups. Shown as Labels: BO (Breakout), R (Retest)
All Types of Sweeps:
Enables both wick-based and breakout/retest sweeps.
🔹 3. Liquidity Zones (Boxes)
Draws boxes around swept areas to highlight liquidity zones.
Color-coded:
🟩 Green for bullish sweeps (below swing lows)
🟥 Red for bearish sweeps (above swing highs)
Usage: These zones act as temporary support/resistance and help traders spot: Reversals, Breakout continuations, Entries after retests.
🔹 5. Visual Labels
Helps quickly identify the type of liquidity event.
LS – Liquidity Sweep
Triggered when price wicks above/below a level and closes back inside.
BO – Breakout
Triggered when price cleanly breaks above/below a zone.
R – Retest
Triggered when price revisits a broken level.
Note: In a strong trending market, using a wick-based liquidity sweep (LS) strategy is often ineffective because the liquidity sweeps triggered by breakouts (BO) and breakdowns tend to dominate price action, making wick-based setups less reliable. However, liquidity sweeps ( LS ) tend to work very well when they occur near strong liquidity zones—areas where a significant concentration of buy or sell orders exist—because these zones act as natural support or resistance levels, increasing the likelihood of price reacting strongly and providing better trading opportunities.
📌 Usage Tip: These labels help with entry zone, trend confirmation, and trap detection.
🔹 6. Liquidity Lines
What it does: Draws horizontal lines from each swing high/low.
Usage: Acts as a visual reference for where liquidity lies. Great for planning take-profits, stop placements, or sniper entries.
🔹 8. Customization Options
Turn on/off:
Labels (LS, BO, R)
Liquidity lines
Breakout/retest zones
Set your own:
Line and box colors
Detection mode (Wick/Breakout/All)
Lookback period for swing points
🧠 Many Trader's use this concept to -
Identify high-probability reversal points (after sweeps)
Trade stop hunts and traps like institutions
Use zones for breakout and retest entries
Avoid false signals by waiting for sweeps and mitigations.

Aftershock Playbook: Stock Earnings Drift EngineStrategy type
Event-driven post-earnings momentum engine (long/short) built for single-stock charts or ADRs that publish quarterly results.
What it does
Detects the exact earnings bar (request.earnings, lookahead_off).
Scores the surprise and launches a position on that candle’s close.
Tracks PnL: if the first leg closes green, the engine automatically re-enters on the very next bar, milking residual drift.
Blocks mid-cycle trades after a loss until the next earnings release—keeping the risk contained to one cycle.
Think of it as a sniper that fires on the earnings pop, reloads once if the shot lands, then goes silent until the next report.
Core signal inputs
Component Default Purpose
EPS Surprise % +0 % / –5 % Minimum positive / negative shock to trigger longs/shorts.
Reverse signals? Off Quick flip for mean-reversion experiments.
Time Risk Mgt. Off Optional hard exit after 45 calendar days (auto-scaled to any TF).
Risk engine
ATR-based stop (ATR × 2 by default, editable).
Bar time stop (15-min → Daily: Have to select the bar value ).
No pyramiding beyond the built-in “double-tap”.
All positions sized as % of equity via Strategy Properties.
Visual aids
Yellow triangle marks the earnings bar.
Diagnostics table (top-right) shows last Actual, Estimate, and Surprise %.
Status-line tool-tips on every input.
Default inputs
Setting Value
Positive surprise ≥ 0 %
Negative surprise ≤ –5 %
ATR stop × 2
ATR length 50
Hold horizon 350 ( 1h timeframe chart bars)
Back-test properties
Initial capital 10 000
Order size 5 % of equity
Pyramiding 1 (internal re-entry only)
Commission 0.03 %
Slippage 5 ticks
Fills Bar magnifier ✔ · On bar close ✔ · Standard OHLC ✔
How to use
Add the script to any earnings-driven stock (AAPL, MSFT, TSLA…).
Turn on Time Risk Management if you want stricter risk management
Back-test different ATR multipliers to fit the stock’s volatility.
Sync commission & slippage with your broker before forward-testing.
Important notes
Works on every timeframe from 15 min to 1 D. Sweet spot around 30min/1h
All request.earnings() & request.security() calls use lookahead_off—zero repaint.
The “double-tap” re-entry occurs once per winning cycle to avoid drift-chasing loops.
Historical stats ≠ future performance. Size positions responsibly.

Intraday & Annual CAPM AlphaIntraday & Annual CAPM Alpha
This TradingView™ Pine v6 indicator computes and plots a stock’s CAPM α (alpha) on both intraday and daily/annualized timeframes, allowing you to monitor relative performance against a chosen benchmark (e.g. SPX, NDX).
⸻
Key Outputs
1. Intraday α per Bar (blue line)
• Calculates α from a rolling-window linear regression of the last N bars’ returns (default 60).
• Expressed as “extra return per bar” vs. the benchmark.
2. Intraday α Daily-Equivalent (stepped blue line)
• Scales the per-bar α to a full trading day (390 minutes), showing “if this pace held all day, outperformance (%)”.
3. Annualized α (yellow line)
• Performs the same CAPM regression on daily returns over a D-day lookback (default 252), then annualizes α by multiplying by 252.
• Indicates longer-term relative strength/weakness vs. the benchmark.
⸻
Inputs
• Benchmark Symbol: Choose any index or ETF (e.g. “SPX”, “NDX”).
• Intraday Lookback Bars: Number of bars for intraday α regression (default 60).
• Daily Lookback Days: Number of trading days for daily CAPM regression (default 252).
• Use Log Returns?: Toggle between arithmetic vs. log returns.
⸻
How to Use
• Short-Term Signals:
• Watch the blue α/bar line on 1–15 min charts. A cross from negative to positive suggests intraday outperformance; a reversal warns of weakening momentum.
• The blue daily-equivalent α gives a smoother view—e.g. > +1% signals strong intraday bias, < –1% signals underperformance.
• Long-Term Trends:
• On daily charts, focus on the yellow annualized α. A sustained positive α implies this stock has historically beaten the benchmark; sustained negative α implies the opposite.
• Combining Timeframes:
• Use intraday α for timing entries/exits within the session, and annualized α to confirm whether you want a bullish or bearish bias over days to weeks.
⸻
Install & Configure
1. Copy the Pine v6 script into the TradingView Pine Editor.
2. Set your favorite benchmark, lookback periods, and returns type.
3. Add to your chart to start visualizing real-time CAPM α signals!
Feel free to adjust the lookback windows and threshold levels to suit your trading style.

FeraTrading Pattern Recognition Engine🧠 Overview:
The FeraTrading Pattern Recognition Engine (PRE) is a lightweight, adaptive model that transforms raw chart data into pattern signatures and tracks their performance in real time.
Instead of relying on fixed formulas or lagging indicators, it learns from what has worked before on your chart—highlighting bull and bear patterns that have a track record of hitting a profit target within a specified number of bars.
This system is ideal for traders who want evolving entries that reflect live market behavior without repainting or hardcoding.
⚙️ How It Works:
🔹 Pattern Encoding:
The script monitors recent price action and builds a unique pattern ID using selected features:
Up to 10 feature toggles (detailed below)
Each feature is converted into a categorical value
The combination of features over a lookback window defines the pattern signature
Bullish and bearish patterns are tracked separately.
🔹 Pattern Evaluation & Learning:
As each pattern appears:
A unique ID is generated.
The script checks if price reaches the required % move within N bars.
If successful, it logs the pattern as a win.
Accuracy and sample size are updated.
Only patterns with 10+ past samples are eligible for live signals.
🔹 Signal Generation:
When today's pattern matches one of the top historically successful bull or bear patterns:
🟢 Green Triangle (below bar) = Bullish pattern match
🔴 Red Triangle (above bar) = Bearish pattern match
Signals are confirmed one bar after pattern completion to avoid repainting.
🧶 Feature Toggles:
Each of the following can be turned on/off to customize the pattern logic:
Candle Type: Bullish, Bearish, or Doji classification.
RSI > 50: Adds momentum context.
Higher High / Lower Low: Tracks continuation or breakout structure.
Volume Spike: Flags volume > 1.5x 20-bar average.
Relative Range: True if bar range > 5-bar average.
Body-to-Range > 60%: Filters for full-bodied candles.
Wick Dominance: Flags wicky/exhaustion candles.
EMA Alignment: Checks if price is in directional alignment with fast/slow EMAs.
Gap From Prior Close: Flags price gaps from previous close.
RSI Slope: Captures trend acceleration or deceleration in RSI.
Tip: 2–3 features = broader learning. 5+ features = more selective precision.
🤷 Inputs & Customization:
Target Move %: How far price must move to qualify as a win.
Lookback Bars: How far back to check for pattern definition.
Bars Forward: How much time the pattern has to hit target.
Signal Toggles: Enable/disable bullish and bearish signals.
🎯 What Makes It Original:
Learns from live data—no static formulas or preset patterns.
Signals only appear if historical accuracy + sample size threshold is met.
One-bar delayed confirmation = no repainting.
Configurable features allow full user control of complexity.
Works on any asset, any timeframe.
✅ How to Use:
Add to any intraday chart (1m–30m ideal).
Start with 2–3 features toggled on.
Let the script learn as data comes in.
Watch for triangle signals (green = bullish, red = bearish).
Combine with other tools for added confluence.
Over time, the engine becomes more selective and accurate.
💎 Why It’s Worth Paying For
The PRE isn’t a repackaged signal script—it’s a real-time learning engine. It provides:
A dynamic model that evolves with your chart
Customizable pattern encoding across 10 behavioral features
Verified, statistically accurate signals
Confirmed, non-repainting outputs
Applicability to any asset or market condition
This isn't theoretical—it's performance-driven signal logic trained by your own chart.
✅ Compliance & Originality This tool was developed from scratch by FeraTrading using fully original logic. No open-source logic or reused libraries were used. All detection methods, signal logic, and pattern encodings are unique and built with compliance in mind. This is absolutely an original script, one we think may be unique to TradingView completely and never seen before.
⚠️ Risk Disclaimer & Access Policy
This script is a historical pattern tracker—not a forecasting engine. No prediction of future price behavior is implied or guaranteed.
Use with proper risk management and trade discretion.
To protect the core pattern engine, this script is invite-only and closed-source. Opening the source would allow cloning of its real-time pattern encoding and filtering logic.
Restricting access ensures:
Proper use by qualified traders
Prevention of misuse or unauthorized distribution
Protection of the tool’s proprietary logic and long-term value
The PRE is designed to be part of a professional workflow, and its access model reflects that goal.

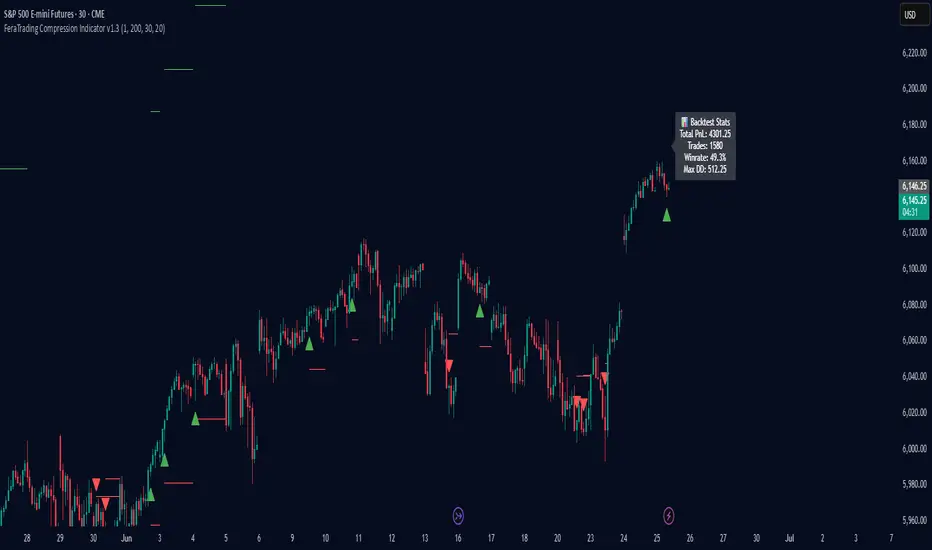
FeraTrading Compression Indicator v1.3🧠 Overview:
The FeraTrading Compression Indicator v1.3 identifies early-stage directional breakouts that follow periods of volatility contraction. This tool is built for intraday traders looking to catch clean breakouts out of tight consolidations. It doesn’t just detect compression—it confirms when that compression is being forcefully released with directional intent.
By combining volatility filtering, trend structure via EMAs, body dominance checks, and an optional session filter, the indicator isolates breakout signals with a high degree of confluence. Users can optionally enable a Signal Flip mode to invert long/short logic—useful in mean-reverting environments or inverse structures.
⚙️ How It Works:
🔹 Volatility Compression Detection:
Compression is detected using a relative ATR comparison between short-term and long-term range averages.
When the short-term range falls below a threshold, the market is considered to be compressing.
This approach is fully adaptive—self-scaling across different asset types and timeframes.
🔹 Breakout Confirmation Logic:
A breakout is confirmed only when the following conditions align:
Range Expansion:
The breakout candle must exceed the long-term average range—confirming actual price expansion.
Strong Candle Body:
The body must represent a significant portion of the candle’s range, confirming momentum and directionality.
EMA Trend Alignment:
The script checks that a fast EMA is properly aligned with a slower EMA and that the candle closes beyond the fast EMA in the correct direction.
Optional Session Filter (08:30–11:30 EST):
Focuses signals to the high-volume portion of the day, increasing reliability. Can be disabled for full-session use.
Signal Flip Option:
Reverses signal logic for assets that often fade breakouts or move counter to structural expectations.
🧪 Built-In Backtester:
The script includes a bar-level backtester, enabling users to simulate SL/TP outcomes and visualize strategy performance directly on the chart.
🧮 Logic & Assumptions:
Trades enter at the open of the signal bar.
SL/TP levels are applied immediately.
If both are hit on the same bar, SL is assumed to hit first (for realism).
An optional setting closes trades at the end of day.
📊 Visual Feedback:
TP and SL levels are plotted in real time.
A stats box displays:
Win rate
Total trades
Max drawdown
Cumulative PnL
This provides an instant read on strategy behavior using your exact market view.
🎯 What Makes It Original:
Compression breakout logic without oscillators: Signals are built from candle structure, EMA alignment, and raw volatility—no lagging tools required.
Real-time SL/TP backtesting: Built-in engine allows traders to test performance without switching tools or exporting data.
Modular logic design: Session filters, signal flip, and compression strictness can be tailored to different markets and conditions.
Minimal input, deep logic: Two volatility filters, two EMAs, and a candle body check combine into a layered signal system that adapts in real time.
This balance of simplicity and structural precision makes it highly versatile for active day traders across asset classes.
✅ How to Use:
Add the script to any chart (1m–15m ideal).
Watch for triangle signals:
Green = bullish breakout
Red = bearish breakout
Toggle session filters or signal flip as needed.
Enable the backtester to visualize edge over time.
Combine with structure, liquidity zones, or volume tools for confluence.
This indicator is best deployed during active market hours when breakout momentum has the highest chance of follow-through.
💎 Why It’s Worth Paying For
The FeraTrading Compression Indicator v1.3 is not just another breakout tool—it is a modular signal system with embedded trade testing logic, built specifically for real-world trading environments.
What makes it premium:
Live confluence-based signals with real volatility and momentum context
Custom-built SL/TP backtester with chart-based visual performance feedback
Non-repainting, directional logic with trend and structure confirmation
Adaptive signal behavior via session and flip toggles
Designed for real execution, not just visual alerts
The blend of signal accuracy, trade simulation, and structural adaptability makes this script more than an entry indicator—it’s a breakout testing and execution framework, ready to plug into any strategy.
✅ Compliance & Originality
This script was written entirely from scratch using original compression logic, trend structure filtering, and trade simulation. It does not reuse any public code, open-source snippets, or repackaged modules. All calculations, condition checks, visuals, and stats logic are unique to this tool. EMA's and ATR were used in filter logic, yet they are only 2 of many filters used, all of the others being fully custom built.
⚠️ Risk Disclaimer & Access Policy
This tool does not predict market direction or guarantee trade results. It provides a rule-based breakout signal structure designed to align with price expansion logic.
Always use your own risk management practices and trade plans. This script is meant as a supportive tool, not a financial advisory system.
🔒 Why This Script Is Invite-Only and Closed-Source
To preserve the tool’s edge and prevent unauthorized replication, the script is invite-only and closed-source.
The following features are proprietary:
Compression zone and range expansion filter logic
Real-time SL/TP backtesting engine
Signal flip and session filtering integration
Confluence layering using structure, volatility, and body-based validation
Opening the source would expose key mechanics and reduce the integrity of the strategy’s edge. Closed access ensures the system remains performant, exclusive, and trusted by serious traders.
FeraTrading Breakout Indicator v2🧠 Overview:
The FeraTrading Breakout Indicator v2 is a momentum-based opening range breakout (ORB) tool built around a fixed intraday structure. It captures price behavior shortly after the market opens and then projects custom breakout levels above and below a calculated midpoint.
Signals are only generated when price breaks one of these projected zones with confirmation from multiple aligned indicators, including RSI momentum, candle body strength, and volatility acceleration.
Unlike traditional ORB tools that plot breakout lines directly on the high and low of the session, this script does not use session highs/lows for its breakout levels. Instead, it creates a central zone based on internal range logic and projects breakout bands dynamically from that midpoint.
⚙️ How It Works:
🔹 Session Zone Setup:
After the first part of the New York session, the script captures the initial price structure.
From this structure, a midpoint zone is established.
Using this midpoint, the script projects upper and lower breakout bands that remain fixed for the rest of the day.
🔹 Breakout Signal Conditions:
To trigger a signal, all of the following must be met:
Price Engagement with Projected Zones:
The prior candle must break through the upper or lower projected level, showing clean directional intent.
Directional Candle Structure:
The breakout candle must have a clear and strong body (not dominated by wicks), confirming that the move had conviction.
RSI-Based Momentum Alignment:
A short-term RSI is calculated and smoothed.
Bullish signals require RSI to be above its average.
Bearish signals require RSI to be below its average.
This ensures breakouts occur with momentum support.
Volatility Spike Filter (Optional):
Checks if the breakout candle is significantly larger than recent candles to eliminate soft or passive breakouts.
All filters must align to print a signal, avoiding noisy or conflicting trades.
🎨 Visuals:
Midpoint Line: Central anchor for the breakout zone (drawn after the session range is complete).
Upper/Lower Breakout Bands: Custom levels projected from midpoint—not drawn on session highs/lows.
Signal Arrows:
Green triangle below the candle = bullish breakout
Red triangle above the candle = bearish breakout
🔒 What Makes It Original:
Uses a fixed custom range derived from structural behavior—not highs/lows—to define breakout levels
Integrates RSI and trend-following behavior with raw price structure for more precise entries
Requires candle anatomy, directional momentum, and volatility conditions to all confirm
Universally applicable across instruments and timeframes—no tuning required
Fixed levels provide a consistent reference point for traders throughout the session
This multi-layered, confirmation-based approach is unique to this script and justifies closed-source protection.
✅ How to Use:
Add to any intraday chart (3m–15m ideal)
After the session range is set, custom zones will appear and remain unchanged for the day
Watch for triangle signals and enter at the open of the signal candle
Use your own stop loss/take profit or trailing exit logic
Best used during high-volume, active market hours
💎 Why It’s Worth Paying For
The FeraTrading Breakout Indicator v2 elevates traditional ORB logic by blending a fixed, midpoint-based breakout structure with live confirmation from RSI, candle anatomy, and volatility filters.
Unlike generic mashups or open-source breakouts, this system:
Filters breakouts using real momentum alignment, not just price movement
Applies structural logic with consistent visual zones that don’t recalculate intraday
Eliminates noise by only triggering when force, structure, and trend all agree
Delivers repeatable, high-clarity signals that adapt to market tempo without parameter tweaking
This type of structured, confluence-validated breakout logic is not available in public indicators or simple ORB clones. It reflects custom engineering and real-world trader experience, resulting in a premium-grade breakout tool.
✅ Compliance & Originality
This script was built fully from scratch using original logic and structure. All visual zones, signal filters, and confirmation layers were designed and implemented internally. No open-source components or cloned calculations are used. RSI is used as a filter, although the thresholds should remain confidential.
All inputs, filters, and breakout mechanics were developed to be asset-agnostic and do not rely on any third-party libraries, code reuse, or recycled logic.
⚠️ Risk Disclaimer & Access Policy
This tool is not financial advice and does not predict future price direction. It visualizes structural and momentum conditions that have historically preceded breakouts. Use in combination with your own trade management system.
All trades carry risk. Past performance does not guarantee future results.
🔒 Why This Script Is Invite-Only and Closed-Source
This script contains proprietary logic that combines structural breakout detection with multi-layered signal validation. Releasing the source would expose the system to replication and diminish its uniqueness and value.
Access is restricted to protect:
The original breakout zone generation logic
The combined RSI-candle-volatility signal filter
The pattern structure and visual consistency framework
Keeping the script closed-source ensures the integrity of the design and preserves the edge for serious users.
We plan on implementing our Pattern Recognition Engine (PRE) into this indicator in the future to add more reliability to the signals.

Obsession.FX Sessions IndicatorSession & Fractal Structure Tool — for Market Phases and Microstructure Analysis
This script combines session timeframes with local fractal identification to help traders analyze market context and structural shifts. It is designed for those applying Smart Money Concepts, where precise session boundaries and reactions to key levels are critical.
Session Zones
The script visualizes the three main trading sessions: Asia, London, and New York. It helps to:
– identify active phases of market participation;
– track each session’s Highs and Lows;
– interpret price behavior in relation to intraday liquidity shifts.
Each session is fully customizable — including start/end time, background and border colors, and display style (box, high/low lines, filled zones).
Fractal Structure
Fractals are shown as local highs and lows, supporting:
– detection of BOS/CHOCH on lower timeframes;
– building A→B ranges for structural flow;
– confirming short-term directional changes.
The fractal algorithm is optimized for responsiveness and clarity, with no repainting and minimal delay.
Purpose and Usage
This tool is intended for contextual reading of price action: determining the active session and monitoring price behavior within its boundaries, with a focus on microstructural reactions. It supports building precise entry logic based on the interaction between session ranges and fractal structure.
Closed Source Justification
The script is closed-source due to its use of proprietary logic for fractal detection and session integration, developed as part of a private trading methodology not available in public libraries.

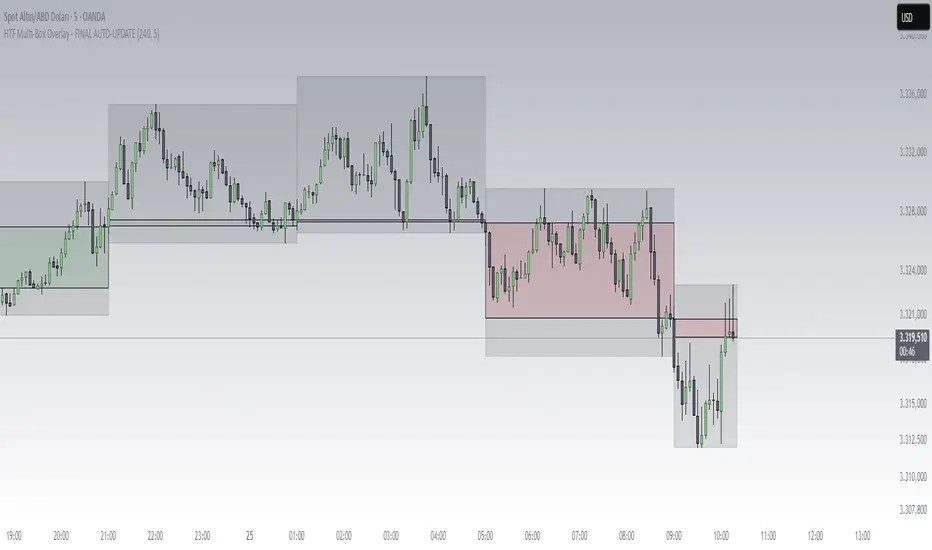
HTF Box Range Overlay - FIXEDThis script overlays higher timeframe candles (e.g. 4H) onto lower timeframe charts (e.g. 5min), showing both the body and wick ranges of the last N HTF candles.
Features:
✔ Displays both candle body and wick as separate shaded boxes
✔ Fully customizable for bullish/bearish colors and wick appearance
✔ Supports any higher timeframe (15m, 1H, 4H, 1D, etc.)
✔ Clean overlay with no performance lag
✔ Automatically adjusts in real-time as new candles form
Great for traders using HTF zones, supply/demand, or structure-based confluence. Works best when used on intraday charts.
Simple Sessions & LevelsWhat this indicator does:
This script marks out two essential types of price levels for intraday and swing traders:
The high and low of a customizable 15-minute opening range after the market/session open.
The previous day’s high, midpoint (“halfback”), and low.
How it works:
The script lets you set the session start time (hour and minute) to match your market.
It then calculates the high and low of the first 15 minutes after the session opens and plots those as solid lines.
It also plots the prior day’s high, halfback (midpoint), and low on your chart for easy reference.
Each line and each label can be toggled on or off independently in the settings for maximum customization.
Colors for each level are also fully customizable.
How to use it:
Add the script to your chart.
Set the session start hour and minute to match the open of the market or instrument you trade.
Choose which levels and labels you want displayed by using the toggles in the settings.
The indicator will automatically draw the session range and prior day levels for you.
Use these lines as reference for key support, resistance, and potential trade entry/exit points.
What makes it unique and useful:
This tool combines a flexible session opening range with classic daily reference levels in one package. You have complete control over which levels and labels are shown, making it adaptable for any trading style. It’s especially useful for day traders who want to quickly identify volatility windows and the most important price levels from the previous session.

Hodie Smart Inside BarThe Hodie Smart Inside Bar indicator automatically detects and visually highlights inside bars — candles fully contained within the range of the previous (parent) candle.
How the indicator works:
Inside Bar Identification:
The indicator analyzes each candle and checks if its high is lower than the previous candle’s high, and its low is higher than the previous candle’s low. If this condition is met, the candle is considered an inside bar.
Size Filtering:
To filter out small and insignificant consolidations, the indicator compares the size of the parent candle’s range to the inside bar’s range. Only if the parent candle is significantly larger (2 times or more — adjustable parameter), the inside bar is considered significant.
Zone Drawing:
For each detected inside bar, the indicator draws a rectangular zone bounded by the parent candle’s high and low. This zone automatically extends to the right as new bars appear until the price moves outside the parent candle’s range.
Zone Completion:
Once the price closes above the parent candle’s high or below its low, the zone is considered complete and stops extending.
Visual Aids:
If enabled, the indicator can shade the background of the current inside bar for additional visual emphasis.
A label with the text "IB" appears above the inside bar candle on the chart for easier identification.
Alerts:
Supports alerts when a new inside bar forms.
Alerts help traders notice important signals promptly.
To activate, create an alert on the indicator with the condition “New Inside Bar”.
Benefits of the Indicator:
Inside bars often signal consolidation and potential liquidity accumulation, which may be followed by a strong impulsive breakout. This indicator helps traders quickly identify consolidation zones and prepare for possible price moves.

Daily Candle BoxDaily candle overlay, high, low, and candle color based on open and close
Charts included in script: '3m', '5m', '15m', '1H'
1. Visualizes Key Daily Levels on Lower Timeframes:
The indicator overlays the previous day’s high and low as a box on a lower timeframe chart (e.g., 5-minute). This highlights critical support and resistance levels from the daily timeframe, making it easier to see where price might react without switching to a daily chart.
Use Case: Traders can identify potential reversal or breakout zones on intraday charts, aligning lower timeframe trades with higher timeframe structure.
2. Simplifies Intraday Trading Decisions:
By showing the previous day’s range (high to low) as a box, it provides a clear context for intraday price action. For example, if the price approaches the box’s top (previous day’s high), traders might anticipate resistance or a breakout.
Use Case: Useful for scalpers or day traders who need to quickly assess whether the price is near significant daily levels for entries, exits, or stop-loss placement.
3. Highlights Daily Candle Direction:
The box’s color (green for bullish, red for bearish) indicates whether the previous day’s close was above or below its open. This provides a quick visual cue about the prior day’s market sentiment.

First 15-min Candle High/LowFirst 15-Min Candle High/Low – Intraday Range Indicator
This script plots the High and Low of the first 15-minute candle of the trading day using:
🟢 Green horizontal line for the first 15-min High
🔴 Red horizontal line for the first 15-min Low
These levels are commonly used by intraday traders as:
Breakout zones
Support/resistance levels
Entry/exit reference points
The script is designed to reset daily and is especially helpful for index and equity traders operating during market open volatility.
⏰ Optimized for markets operating in IST (Indian Standard Time), such as NSE/BSE, starting at 09:15 AM.
🛠️ How to Use:
Apply on 15-minute or lower timeframes
Ideal for breakout strategies, opening range setups, or volatility scalping

Intraday BUY/SELL & AUTO SL (5-min timeframe only) by chaitu50c)Intraday BUY/SELL & AUTO SL (5-min timeframe only) by chaitu50c
This indicator provides intraday traders with BUY/SELL reversal signals and automated SL (Stoploss) tracking, based on a 3-candle reversal block logic — designed to work exclusively on the 5-min timeframe.
Key Features:
• 3-Candle Reversal Logic — Signals are generated when a defined 3-candle reversal pattern is detected (body-close breakout).
• Current Session Only — All signals and SL lines are valid only for the current session and automatically reset at session start.
• BUY/SELL Signal Labels — Visual ▲ and ▼ labels mark valid reversal signals on the chart.
• Dynamic Auto SL Lines — Plots dashed SL lines based on the reversal block's low/high.
• SL HIT Tracking — If SL is broken, the line stops extending and a ‘SL HIT’ label is displayed at the midpoint of the SL line.
• Adjustable Visual Settings — Customize signal label size, SL line width, colors, and more.
• Clean & Lightweight — Optimized for intraday use without cluttering the chart.
How to Use:
You can trade this indicator in two ways:
1. Direct Signal Entry — Take a BUY or SELL trade when a valid ▲/▼ reversal signal forms.
2. SL HIT Re-entry — If an existing SL line is broken and ‘SL HIT’ appears, you can optionally take an opposite side trade in the direction of the SL HIT.
Example:
A BUY signal is generated and an SL line is plotted below.
If price breaks the SL (SL HIT appears), you may consider entering a SELL trade at that point — as it indicates weakness.
Important Notes:
• Works only on 5-min timeframe — Set your chart to 5-min for correct behavior.
• Designed for intraday trading — all signals and SL levels reset at session start.
• Does not carry signals between sessions.
• SL lines and HIT labels provide a clear and simple visual aid for trade management.
---

Inside Bar Candle Color with Bullish/Bearish AlertTitle:
Inside Bar Candle Color with Bullish/Bearish Alerts
Description:
This indicator highlights Inside Bars based on candlestick structure and colors them according to bullish or bearish sentiment. It also includes real-time alerts for both bullish and bearish inside bars.
Key Features:
Detects inside bars (including equal highs/lows)
Bullish inside bars are highlighted in green (customizable)
Bearish inside bars are highlighted in red (customizable)
Alerts included:
Bullish inside bar alert
Bearish inside bar alert
Works on all timeframes and instruments
What is an Inside Bar?
An inside bar is a candlestick whose high and low are completely within the range of the previous candle. It often signals market consolidation or a potential breakout setup.
How to Use:
Use inside bars as part of a breakout or continuation strategy
Combine with trend direction, support/resistance, or volume for confirmation
Customize the candle colors to match your chart theme
Note: This indicator does not provide buy or sell signals. It's a visual tool designed to support price action traders in identifying low-volatility zones and potential setups.

Engulfing Bar AggressiveEngulfing Bar Aggressive
Engulfing Bar Aggressive is a precise price action indicator designed to detect strong bullish and bearish engulfing patterns in an aggressive way. This tool is perfect for traders who want early and confirmed signals based purely on candle formations, without relying on any indicators or moving averages.
🔍 Core Logic
The indicator scans for 2-bar engulfing patterns with additional strict conditions:
Bullish Engulfing
Current candle closes bullish (close > open).
Previous candle closes bearish (close < open ).
Current close completely engulfs previous open and high.
Current open is below previous close.
Signal triggers only after bar closure (confirmed pattern).
Bearish Engulfing
Current candle closes bearish (close < open).
Previous candle closes bullish (close > open ).
Current close completely engulfs previous open and low.
Current open is above previous close.
Signal triggers only after bar closure (confirmed pattern).
🛠 Features
Clear visual markers on the chart (green for bullish, red for bearish).
Configurable generic alert to receive notifications for any engulfing pattern detected.
Dedicated alerts for bullish and bearish engulfing setups.
Works on any timeframe and any market.
🎯 Use Case
Ideal for breakout traders, reversal traders, or as part of a multi-factor strategy.
Can be combined with support/resistance zones, ATR exhaustion levels, or trend filters for enhanced accuracy.

Candle Closer Levels & TP Zones📝 Description:
This indicator is designed to provide intrabar trade levels for high-speed execution strategies, such as scalping and intraday momentum trading.
🧩 Key Features:
Plots High, Low, Mid, and two Quarter Levels on the current candle only, keeping charts clean
Take Profit (TP) lines are calculated as a percentage of candle range, not fixed ticks — this makes it highly adaptable for futures like NQ/ES or volatile markets like crypto
Supports both long and short setups via a simple toggle
Customizable colors, line thickness, and length
Each TP level can be enabled or muted individually
📈 Use Case:
Apply this tool to spot candle-based breakouts or rejections. You can scale TPs dynamically based on the strength of the current candle. This is especially helpful in assets where volatility fluctuates greatly intrabar.
This is not a repackaged built-in indicator — it’s purpose-built for real-time tactical level plotting without historical noise.

Previous Daily High/LowThe previous day’s high and low are critical price levels that traders use to identify potential support, resistance, and intraday trading opportunities. These levels represent the highest and lowest prices reached during the prior trading session and often act as reference points for future price action.
Why Are Previous Daily High/Low Important?
Support & Resistance Zones
The previous day’s low often acts as support (buyers defend this level).
The previous day’s high often acts as resistance (sellers defend this level).
Breakout Trading
A move above the previous high suggests bullish momentum.
A move below the previous low suggests bearish momentum.
Mean Reversion Trading
Traders fade moves toward these levels, expecting reversals.
Example: Buying near the previous low in an uptrend.
Institutional Order Flow
Market makers and algos often reference these levels for liquidity.
How to Use Previous Daily High/Low in Trading
1. Breakout Strategy
Long Entry: Price breaks & closes above previous high → bullish continuation.
Short Entry: Price breaks & closes below previous low → bearish continuation.
2. Reversal Strategy
Long at Previous Low: If price pulls back to the prior day’s low in an uptrend.
Short at Previous High: If price rallies to the prior day’s high in a downtrend.
3. Range-Bound Markets
Buy near previous low, sell near previous high if price oscillates between them.
Example Trade Setup
Scenario: Price opens near the previous day’s high.
Bullish Case: A breakout above it targets next resistance.
Bearish Case: Rejection at the high signals a pullback.

Quantum Reversal# 🧠 Quantum Reversal
## **Quantitative Mean Reversion Framework**
This algorithmic trading system employs **statistical mean reversion theory** combined with **adaptive volatility modeling** to capitalize on Bitcoin's inherent price oscillations around its statistical mean. The strategy integrates multiple technical indicators through a **multi-layered signal processing architecture**.
---
## ⚡ **Core Technical Architecture**
### 📊 **Statistical Foundation**
- **Bollinger Band Mean Reversion Model**: Utilizes 20-period moving average with 2.2 standard deviation bands for volatility-adjusted entry signals
- **Adaptive Volatility Threshold**: Dynamic standard deviation multiplier accounts for Bitcoin's heteroscedastic volatility patterns
- **Price Action Confluence**: Entry triggered when price breaches lower volatility band, indicating statistical oversold conditions
### 🔬 **Momentum Analysis Layer**
- **RSI Oscillator Integration**: 14-period Relative Strength Index with modified oversold threshold at 45
- **Signal Smoothing Algorithm**: 5-period simple moving average applied to RSI reduces noise and false signals
- **Momentum Divergence Detection**: Captures mean reversion opportunities when momentum indicators show oversold readings
### ⚙️ **Entry Logic Architecture**
```
Entry Condition = (Price ≤ Lower_BB) OR (Smoothed_RSI < 45)
```
- **Dual-Condition Framework**: Either statistical price deviation OR momentum oversold condition triggers entry
- **Boolean Logic Gate**: OR-based entry system increases signal frequency while maintaining statistical validity
- **Position Sizing**: Fixed 10% equity allocation per trade for consistent risk exposure
### 🎯 **Exit Strategy Optimization**
- **Profit-Lock Mechanism**: Positions only closed when showing positive unrealized P&L
- **Trend Continuation Logic**: Allows winning trades to run until momentum exhaustion
- **Dynamic Exit Timing**: No fixed profit targets - exits based on profitability state rather than arbitrary levels
---
## 📈 **Statistical Properties**
### **Risk Management Framework**
- **Long-Only Exposure**: Eliminates short-squeeze risk inherent in cryptocurrency markets
- **Mean Reversion Bias**: Exploits Bitcoin's tendency to revert to statistical mean after extreme moves
- **Position Management**: Single position limit prevents over-leveraging
### **Signal Processing Characteristics**
- **Noise Reduction**: SMA smoothing on RSI eliminates high-frequency oscillations
- **Volatility Adaptation**: Bollinger Bands automatically adjust to changing market volatility
- **Multi-Timeframe Coherence**: Indicators operate on consistent timeframe for signal alignment
---
## 🔧 **Parameter Configuration**
| Technical Parameter | Value | Statistical Significance |
|-------------------|-------|-------------------------|
| Bollinger Period | 20 | Standard statistical lookback for volatility calculation |
| Std Dev Multiplier | 2.2 | Optimized for Bitcoin's volatility distribution (95.4% confidence interval) |
| RSI Period | 14 | Traditional momentum oscillator period |
| RSI Threshold | 45 | Modified oversold level accounting for Bitcoin's momentum characteristics |
| Smoothing Period | 5 | Noise reduction filter for momentum signals |
---
## 📊 **Algorithmic Advantages**
✅ **Statistical Edge**: Exploits documented mean reversion tendency in Bitcoin markets
✅ **Volatility Adaptation**: Dynamic bands adjust to changing market conditions
✅ **Signal Confluence**: Multiple indicator confirmation reduces false positives
✅ **Momentum Integration**: RSI smoothing improves signal quality and timing
✅ **Risk-Controlled Exposure**: Systematic position sizing and long-only bias
---
## 🔬 **Mathematical Foundation**
The strategy leverages **Bollinger Band theory** (developed by John Bollinger) which assumes that prices tend to revert to the mean after extreme deviations. The RSI component adds **momentum confirmation** to the statistical price deviation signal.
**Statistical Basis:**
- Mean reversion follows the principle that extreme price deviations from the moving average are temporary
- The 2.2 standard deviation multiplier captures approximately 97.2% of price movements under normal distribution
- RSI momentum smoothing reduces noise inherent in oscillator calculations
---
## ⚠️ **Risk Considerations**
This algorithm is designed for traders with understanding of **quantitative finance principles** and **cryptocurrency market dynamics**. The strategy assumes mean-reverting behavior which may not persist during trending market phases. Proper risk management and position sizing are essential.
---
## 🎯 **Implementation Notes**
- **Market Regime Awareness**: Most effective in ranging/consolidating markets
- **Volatility Sensitivity**: Performance may vary during extreme volatility events
- **Backtesting Recommended**: Historical performance analysis advised before live implementation
- **Capital Allocation**: 10% per trade sizing assumes diversified portfolio approach
---
**Engineered for quantitative traders seeking systematic mean reversion exposure in Bitcoin markets through statistically-grounded technical analysis.**

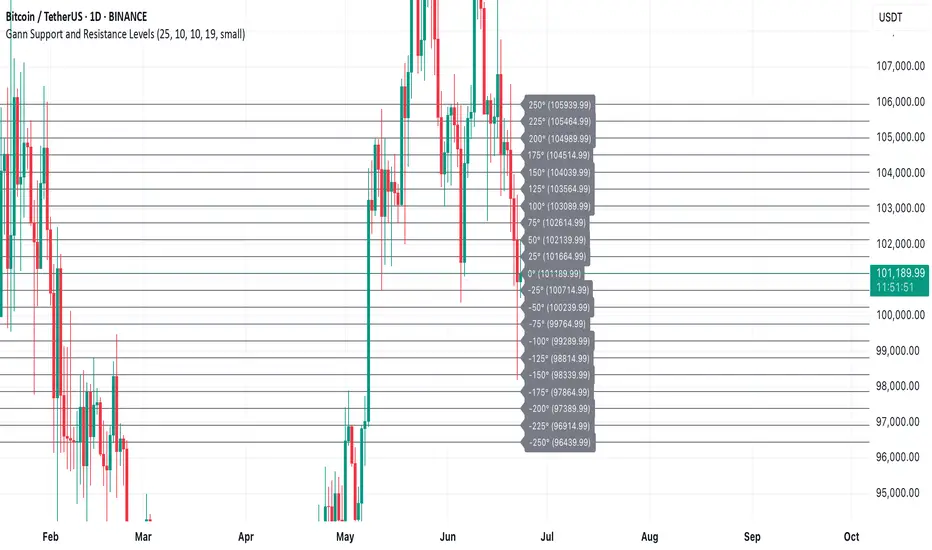
Gann Support and Resistance LevelsThis indicator plots dynamic Gann Degree Levels as potential support and resistance zones around the current market price. You can fully customize the Gann degree step (e.g., 45°, 30°, 90°), the number of levels above and below the price, and the price movement per degree to fine-tune the levels to your strategy.
Key Features:
✅ Dynamic levels update automatically with the live price
✅ Adjustable degree intervals (Gann steps)
✅ User control over how many levels to display above and below
✅ Fully customizable label size, label color, and text color for mobile-friendly visibility
✅ Clean visual design for easy chart analysis
How to Use:
Gann levels can act as potential support and resistance zones.
Watch for price reactions at major degrees like 0°, 90°, 180°, and 270°.
Can be combined with other technical tools like price action, trendlines, or Gann fans for deeper analysis.
📌 This tool is perfect for traders using Gann theory, grid-based strategies, or those looking to enhance their visual trading setups with structured levels.