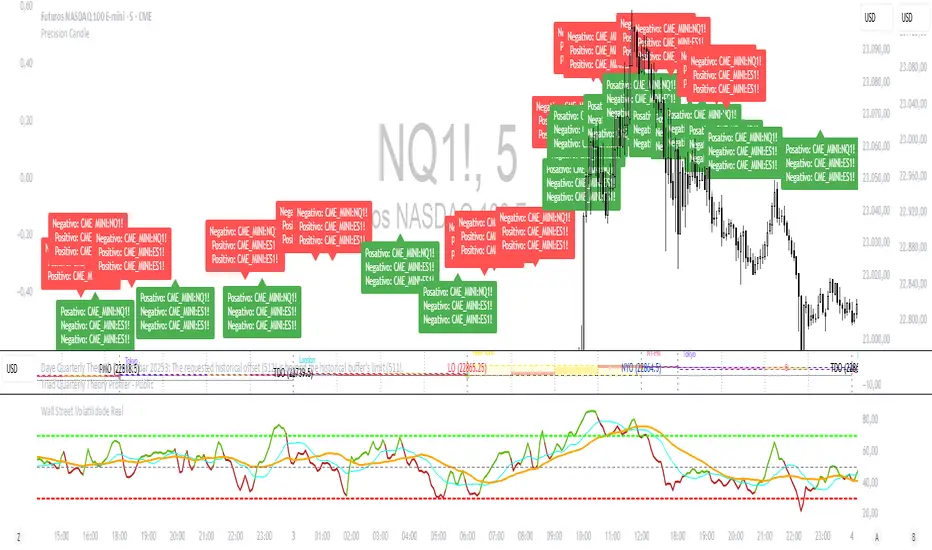
Precision CandleThis Pine Script is designed to help you uncover hidden divergences among multiple assets by tracking how their candles close. Imagine you're analyzing three different assets — they could be indices, currencies, or even cryptocurrencies — and you want to know when one of them is moving out of sync with the others. That’s where this script comes into play.
First, it gives you the flexibility to choose custom ticker symbols or rely on predefined ones based on different asset classes like metals, bonds, or altcoins. Once the symbols are set, the script continuously monitors the opening, high, low, and closing prices of each asset.
The magic happens when it determines the nature of each candle: is it bullish or bearish? By comparing these closing behaviors, the script checks for any discrepancies — situations where at least one asset diverges from the trend of the others. When this happens, the script plots a red "PC" marker below the bar on your chart, drawing your attention to these moments of divergence.
This tool can be invaluable for traders looking to spot unique market dynamics, identify potential trading opportunities, or simply get insights into how different assets behave in relation to each other. It's a simple but powerful way to keep an eye on correlations and anticipate shifts in market sentiment.
Candlestick analysis
ICT Daily BiasSimple indicator for Daily Chart using ICT principles to suggest Reversal or Continuation, with next day suggested Draw on Liquidity.
USAGE: In AM session, go into 1m chart / Replay mode and back up to 11:59pm of prior trading day for projected draw on liquidity for current day trading session.

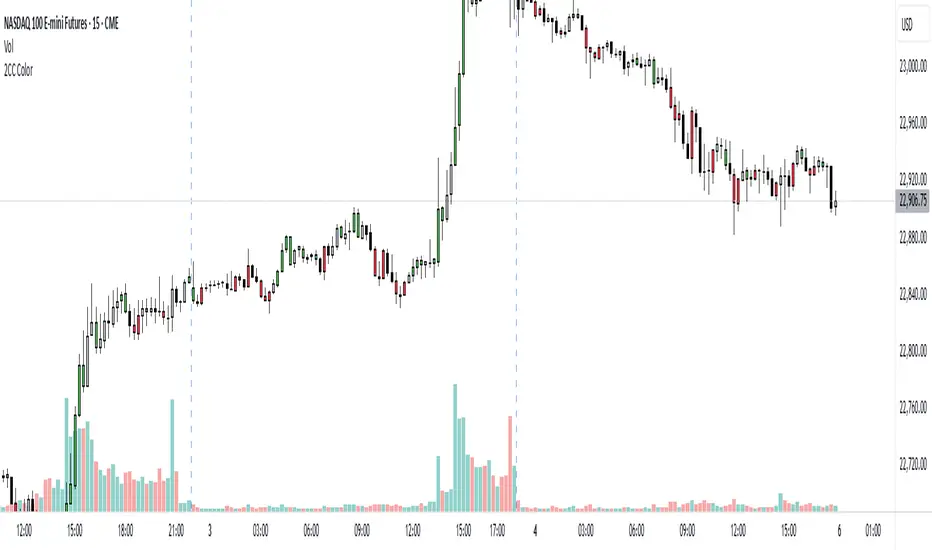
Candlesticks MTF + Prev Daily RangeCandlesticks MTF + Previous Daily Range
This TradingView script displays higher timeframe candlesticks on a lower timeframe chart and optionally projects the previous day's high, low, and close levels. The user can define the timeframe from which the candles are taken, typically a higher timeframe like daily. A specified number of historical candles are drawn on the chart using boxes for candle bodies and lines for wicks. The color of each candle indicates its direction: bullish candles use a "long" color (default teal), and bearish candles use a "short" color (default red).
An optional feature allows the projection of the previous daily range. When enabled, the script draws horizontal lines extending across the chart to mark the high, low, and close of the second most recent higher timeframe candle. These lines are color-coded for easy visual identification and can help identify potential support and resistance zones.
All visual elements, including the number of candles, their width, and the colors of candles and projection lines, can be customized through the settings. The script dynamically updates in real time, clearing outdated boxes and lines to avoid visual clutter. This makes it a useful tool for traders who want to incorporate multi-timeframe analysis and key price levels directly into their intraday charting.

Second Pullback Finderlion pull back rocks, by using a familiar trend trading strategy, i have enhance a little more to this. correct positioning of market structure will help make these signals come alive

Silver Bullet🎯 Silver Bullet Macro Time & Bias Framework
The Silver Bullet script is a complete framework for identifying high-probability trading windows and directional bias, inspired by ICT concepts.
✅ Key Features:
• Macro Sessions Detection – Automatically identifies key time windows (ICT Killzones or custom hours) on any timeframe.
• Dynamic Session Boxes – Visual boxes marking each session’s high/low range.
• Bias Calculation – Determines Long or Short bias using price action within the session.
• Fibonacci Levels – Automatically draws Fibonacci retracements and extensions relative to session ranges.
• Adaptive Labels & Tables – Clear labels showing session range, bias, entry, target, and stop levels.
• Customizable Timezones & Styles – Supports all chart timezones, different text sizes, and flexible display positions.
⸻
📈 Optimized for the 5-Minute Chart, but can be applied to other intraday timeframes.
🌐 Learn more & contact support: www.macrobullet.trade

EMAs 60/125/250 + Swing-Struktur + CCI-AlertsEMAs 60/125/250 + Swing-Points + CCI-Alerts / crossover 100 /-100

Sanuja nuwanThe Zero Fear Indicator is a custom-built trading tool designed for confident and precise entries. Powered by real-time market structure, volume pressure, and volatility logic, it filters out noise and shows clear buy/sell signals with zero hesitation. Perfect for both beginners and experienced traders looking to trade without fear.


Swing High & Low MarkerMarks swing high and low candles
Swing high candle:
A candle whose high is higher than the highs of the candles immediately before and after it.
Swing low candle:
A candle whose low is lower than the lows of the candles immediately before and after it.

SuperPerformance_V1.2📊 SUPER PERFORMANCE INDICATOR
A comprehensive performance analysis tool that compares your stock against selected indices and tracks sector performance across multiple timeframes.
🎯 MAIN FEATURES
✅ Stock Performance Table
• Compares stock vs index performance across 1D, 5D, 10D, 20D, 50D, 200D periods
• Shows ✓/✗ indicators for outperformance tracking
• Displays percentage gains/losses with color coding (green=positive, red=negative)
• Calculates conviction score based on outperformance across timeframes
• Provides performance difference between stock and index
✅ Sector Performance Table
• Ranks top 5 performing sectors across different timeframes
• Shows real-time sector performance with percentage changes
• Tracks 19 major Indian market sectors
• Customizable time periods (1D, 5D, 10D, 20D, 60D)
✅ Sector Display Box
• Shows current stock's sector classification
• Customizable positioning and styling
• Optional sector abbreviations
🔧 CUSTOMIZATION OPTIONS
📋 Display Settings
• Dark/Light mode toggle
• Show/hide individual tables
• Mini mode for compact view
• Index selection (default: NIFTYMIDSML400)
📊 Table Controls
• Enable/disable specific columns and rows
• Adjustable table size (tiny/small/normal/large)
• 9 positioning options for each table
• Color customization for backgrounds and text
🎨 Advanced Features
• Conviction scoring system (Perfect/Solid/Good/Ok/Weak/Poor)
• Real-time performance tracking
• Multi-timeframe analysis
• Sector rotation insights
📈 CONVICTION LEVELS
• Perfect: Outperforms in all periods
• Solid: Outperforms in 67%+ periods
• Good: Outperforms in 50%+ periods
• Ok: Outperforms in 33%+ periods
• Weak: Outperforms in some periods
• Poor: Underperforms in all periods
⚙️ HOW TO USE
1. Add indicator to your chart
2. Select comparison index in Display Settings
3. Customize visible columns/rows as needed
4. Position tables on screen
5. Analyze green ✓ (outperforming) vs red ✗ (underperforming)
6. Use conviction score for overall performance assessment
🎯 IDEAL FOR
• Relative strength analysis
• Sector rotation strategies
• Performance benchmarking
• Indian equity markets
Note: Designed specifically for NSE/Indian market analysis with pre-configured sector indices.

The Essa System V1.5The Essa System V1.5
Overview
The Essa System is a comprehensive trading strategy and backtesting tool designed for traders who use market structure and Fibonacci retracements. It automatically identifies significant trading ranges, calculates key retracement levels, and then backtests a complete trading strategy based on entries at these levels.
This is more than just an indicator; it's a full suite of analytical tools designed to help you develop, test, and analyze a complete trading plan directly on your chart.
How It Works
The system's logic is based on a classic price action concept:
Range Detection: First, it automatically identifies a significant trading range by finding the highest high and lowest low based on pivot points over a user-defined lookback period.
Fibonacci Analysis: Once the range direction (bullish or bearish) is established, the script calculates and displays key Fibonacci retracement levels (50%, 61.8%, 70.5%, and 78.6%).
Trade Execution: The system then looks for historical and live trading opportunities, entering a trade when the price pulls back to one of the enabled Fibonacci levels. All trades are managed with a predefined Stop Loss and Take Profit in pips.
Key Features
Automatic Range & Fibonacci Analysis: Automatically draws the primary trading range and key Fib levels, updating as market structure evolves.
Historical Backtesting: Plots all historical trade entries based on the strategy rules, allowing for a complete performance review over the chosen chart history.
Detailed Trade Visuals: Displays active trades on the chart with clear lines and boxes for entry, stop loss, and take profit zones.
Advanced Session Filtering: Allows you to isolate trades to specific market sessions (London, New York, Asia) with timezone support and daily trade limits.
Built-in Risk Management: A cornerstone of the system. It automatically calculates the required position size for each trade based on your specified Account Size, Risk Percentage, and Stop Loss.
Comprehensive Performance Tables: The script includes two powerful analytical tables:
Trade Helper Table: Shows the status of live or potential upcoming trades, including entry/SL/TP prices and the calculated position size.
History Table: Logs all recent trades and calculates key statistics like Profit Factor, Win Rate, and the overall PnL impact on your account balance.
Customizable Strategy: Fine-tune every aspect of the strategy with inputs for the lookback period, SL/TP in pips, which Fib levels are tradable, and a cooldown timer to prevent over-trading.
How to Use
Add the indicator to your chart.
Navigate to the settings and, under "Account Settings," configure your Account Size and Risk Per Trade (%). This is essential for the PnL and position sizing calculations to be meaningful.
Under "Session Filter Settings," adjust the sessions you wish to trade.
Analyze the historical trades and the performance tables to understand the strategy's behaviour on your chosen asset and timeframe.
Disclaimer: This is a tool for strategy analysis and backtesting. It is not financial advice. Past performance is not indicative of future results. Always use proper risk management.

Momentum Candlestick TerakhirThis indicator helps traders identify where the last momentum candle occurred.
It also provides a Multi-Timeframe Table that displays the most recent momentum candle for each timeframe

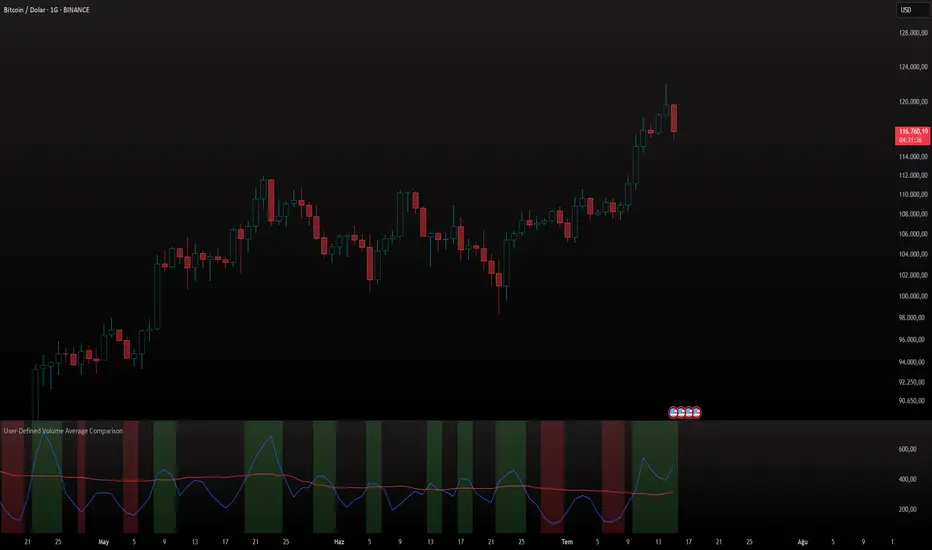
User-Defined Volume Average ComparisonThe User-Defined Volume Average Comparison indicator empowers traders to analyze volume trends by comparing short-term and long-term volume moving averages. With customizable periods, visual cues, and built-in alerts, it’s a versatile tool for identifying volume-driven market shifts across any timeframe, ideal for stocks, forex, crypto, and more.Key Features: Customizable Periods: Set short and long periods (in bars) to match your trading strategy.
Conditional Highlighting:
Green Background: Short-period volume average ≥ long-period volume average, signaling strong short-term volume.
Red Background: Short-period volume average < long-period volume average / 2, indicating low short-term volume.
Optional Labels: Toggle labels to display conditions on the chart (default: off).
Alerts: Receive notifications for key conditions: “Short ≥ Long Alert” for high volume periods.
“Short < Long/2 Alert” for low volume periods.
Visualized Averages: Plots short-period (blue) and long-period (red) volume moving averages for easy analysis.
How It Works:
The indicator calculates the simple moving average (SMA) of volume over user-defined short and long periods, then compares them: A green background and alert trigger when the short-period average meets or exceeds the long-period average, suggesting increased volume activity.
A red background and alert trigger when the short-period average falls below half of the long-period average, indicating reduced volume.
Labels (if enabled) display “Short ≥ Long” or “Short < Long/2” for clarity.
Settings: Short Period (Bars): Number of bars for the short-term volume average (default: 3).
Long Period (Bars): Number of bars for the long-term volume average (default: 50).
Show Labels: Enable or disable condition labels (default: off).
Use Cases: Trend Confirmation: Use green alerts to confirm high volume during breakouts or trend continuations.
Divergence Detection: Identify low volume periods with red alerts to spot potential reversals or weak trends.
Multi-Timeframe Analysis: Apply on any timeframe (e.g., 4H, 1D), with periods based on bars (e.g., 3 bars on 4H = 12 hours).
Notes: Periods are based on the chart’s timeframe (bars). For shorter timeframes, consider increasing period values for more significant results.
Set alerts to “Once Per Bar Close” for reliable notifications.
Combine with price-based indicators to enhance trading decisions.
Why Use This Indicator?
This indicator offers a flexible, alert-driven approach to volume analysis, helping traders of all levels make informed decisions. Its intuitive design and customizable settings make it a valuable addition to any trading setup.
Impulse & Terminal Detector [DEV]I am studying Elliott Waves,
and I am verifying the knowledge I have learned by applying it to indicators.
This may be right or wrong, but I think people studying Elliott Waves will find it fun to use this indicator together and see how it interacts with my learning, so I am sharing the indicator.
1. There is a blind spot in that it is pivot-based. This needs more research.
So the shape found varies depending on the length of the pivot.
2. A triangle indicates a normal impulse, and a diamond indicates a terminal.
We often confuse them, and the book tells us to distinguish between them.

TitansAlgo Sureshots v3This TradingView script, "TitansAlgo Sureshots", is a precision-based breakout scalping indicator designed for intraday trading. It captures the high and low of the first candle after the market opens at 9:30 AM and waits for a breakout in either direction to trigger a trade. Once triggered, it calculates Take Profit (TP) and Stop Loss (SL) based on a customizable Risk-Reward Ratio.
It visually plots buy/sell signals using colored dots and labels, and draws TP/SL levels directly on the chart for easy reference. The script also includes optional real-time alerts and can highlight the breakout candle with a custom background color.
Perfect for traders looking for simple, rule-based scalping setups with clearly defined entries and exits.

Spot Overlapping FVG - [Fandesoft Trading Academy]🧠 Overview
This script plots Higher Timeframe Fair Value Gaps (FVGs) with full visibility and precise placement on lower timeframe charts. Each timeframe (1D–12M) has its own independent toggle, custom label, and box styling, allowing traders to analyze broader market structures across swing and long-term horizons.
🎯 Features
✅ Identifies Fair Value Gaps using a 3-candle logic (candle 1 high vs candle 3 low, and vice versa).
✅ Plots HTF FVG boxes aligned to lower timeframes for comprehensive multi-timeframe analysis.
✅ Supports custom timeframes: 1D to 12M, with individual toggles.
✅ Full visual customization: border color, bullish/bearish box opacity, label font size and color.
✅ Modular inputs to enable or disable specific timeframes for performance.
✅ Uses barstate.isconfirmed logic for stable, non-repainting plots.
⚙️ How It Works
The script requests higher timeframe data via request.security. For each confirmed bar, it checks for FVGs based on:
Bullish FVG: low >= high
Bearish FVG: low >= high
If a gap is detected, a box is plotted between candle 1 and candle 3 using box.new().
Timeframe toggles ensure calculations remain within the limit of 40 request.security calls.
📈 Use Cases
Swing traders analyzing daily to monthly imbalances for medium-term strategies.
Position traders seeking to identify long-term imbalance zones for entries or exits.
ICT methodology practitioners visualizing higher timeframe displacement and inefficiencies.
Traders layering multiple HTF FVGs to build confluence-based trading decisions.

Overlapping FVG - [Fandesoft Trading Academy]🧠 Overview
This script plots Higher Timeframe Fair Value Gaps (FVGs) with full visibility and precise placement on lower timeframe charts. Each timeframe (30s–15m) has its own independent toggle, custom label, and box styling, allowing traders to analyze market structures in detail.
🎯 Features
✅ Identifies Fair Value Gaps using a 3-candle logic (candle 1 high vs candle 3 low, and vice versa).
✅ Plots HTF FVG boxes aligned to lower timeframes for intraday analysis.
✅ Supports custom timeframes: 30s to 15m, with individual toggles.
✅ Full visual customization: border color, bullish/bearish box opacity, label font size and color.
✅ Modular inputs to enable or disable specific timeframes for performance.
✅ Uses barstate.isconfirmed logic for stable, non-repainting plots.
⚙️ How It Works
The script requests higher timeframe data via request.security. For each confirmed bar, it checks for FVGs based on:
Bullish FVG: low >= high
Bearish FVG: low >= high
If a gap is detected, a box is plotted between candle 1 and candle 3 using box.new().
Timeframe toggles ensure calculations remain within the limit of 40 request.security calls.
📈 Use Cases
Scalpers and intraday traders analyzing microstructure.
ICT methodology practitioners visualizing displacement and inefficiencies.
Traders layering multiple FVG timeframes for confluence.

Meta Bot⚙️ Meta Bot – A Smart System for Custom Bot Creation
Meta Bot is more than just a trading bot – it's a full system for creating customized bots with advanced capabilities, allowing you to build your own unique strategy from thousands of possible combinations of indicators, trends, and entry confirmations.
The bot runs on the TradingView platform and gives you full control over timing, logic, and execution – result-driven and adaptable to any trading style.
🕒 Full Control Over Trading Sessions
The system allows you to define up to 3 sessions per day, select specific days, set start/end times, and automatically block trades outside defined hours.
You can also set profit/loss limits per day, week, or session, as well as limit the number of trades to maintain full control over your performance.
📊 Precision Matching to Your Trading Style
Choose up to 2 core market trends from a variety of options:
True Day/Week Open
Higher Time Frame Sequences
SMT Analysis
Defined Session High/Low
Each trend can be fully customized – including time frame, candle count, open points, and more – to fit any market or trading method.
🧠 Modular Indicator System
Build your entry logic using up to 4 different indicators per direction, with full customization available for each one:
RSI, MACD, STOCHASTIC, VWAP
Volume, MA Ribbon, Bollinger Bands
CHOCH, RSI Divergence, Precision Candle, AMD
You can adjust thresholds, extremes, validation ranges, and more based on your trading preferences and the nature of each indicator.
🎯 Advanced Entry Confirmations
- Market Order – instant execution
Limit Order by ticks
Inside Bar – pattern-based entry
FVG – full control with 3 entry types
Trade Reversal – execute opposite trades based on confirmations
🛡 Precise Exit Conditions
- Stop loss by ticks or market structure (Swing High/Low)
- Take profit by RR ratio, fixed ticks, or pivot levels
- Control over candle structure for identifying valid exit points
🧩 Flexible System to Build Unlimited Bot Variants
Thanks to its modular structure, Meta Bot isn’t just a single bot – it’s a **platform for building your own bots**.
With unlimited combinations of trends, indicators, entry/exit conditions, time filters, and sessions – you can fine-tune every strategy, compare versions, and develop a system that fits your exact needs.
✅ Built for All Trader Levels – Including Evaluation Accounts
Meta Bot is fully compatible with funded account programs (like Apex, FTMO, and others), with built-in risk controls, trading hour limitations, and trade count restrictions.
Its user-friendly interface makes it suitable for beginners, while offering advanced logic control for experienced traders.
✅ What You Get:
Modular system with control over every component
Battle-tested logic for changing market conditions
Maximum flexibility with high execution precision
Easy-to-use interface with intuitive configuration

UT Bot + LinReg Candles (Dual Sensitivity)
Script Description:
This indicator combines the popular UT Bot Alerts system with Linear Regression Candles (open source) for enhanced trend detection and trading signals in one singel script. The UT Bot features independent, then 2 x ATR sensitivity and periods controls for buy and sell signals, allowing you to fine-tune entries and exits to match your strategy. The script also overlays colored Linear Regression Candles with an optional signal line, helping you visually identify trend strength and direction. All calculations are performed on standard chart prices (no Heikin Ashi). Suitable for all asset classes and timeframes.
Eample setting for usdjpy 5 min chart for repeated buy and sell singnals based on trend:
BUY ATR period 300 multiplier 1
SELL ATR period 1 multiplier 2
Disclaimer:
This script is for informational and educational purposes only. It is not financial advice. Use at your own risk; the author assumes no responsibility for any trading results or losses.
Credits goes to to Ugurvu for linreg candles and quantnomad for UT Bot alerts that make this script possible.
Author: Patrick

Daily Macro📈 Indicator Overview: Daily / 4H / 1H Macro Sessions
This TradingView indicator provides a structured and high-precision visualization of key intraday trading sessions based on macro time blocks. It is designed to support institutional-style traders who work with time-based liquidity windows and macro-level decision zones.
🕰️ 1. Daily Macro Session (13:00–21:00 UTC-4)
The Daily Macro session highlights the most relevant institutional trading window, typically associated with high-volume price movements. The indicator plots:
A session box showing the full high-low range of the session
A top line at the session high
A bottom line at the session low
A midline marking the 50% level of the session range
This session is stored historically with adjustable lookback depth, making it easy to reference previous daily ranges for potential areas of interest, liquidity, or reversal.
🕓 2. 4H Macro Windows (5 predefined zones)
The indicator includes five 4H macro sessions, each representing key pre-/post-market institutional trading periods:
Label Time (UTC-4)
Macro Window 1 00:20 – 01:40
Macro Window 2 04:20 – 05:40
Macro Window 3 08:20 – 09:40
Macro Window 4 12:20 – 13:40
Macro Window 5 20:20 – 21:40
Each window:
Is independently toggleable
Draws a live-updating session box during the active window
Captures high/low ranges in real-time
Optionally displays session labels or range metrics
These are particularly useful for identifying accumulation/distribution zones and aligning trades with macro-level time-based liquidity shifts.
🕐 3. 1H Micro Windows (optional extension)
In addition to the macro structure, the indicator can include short 1-hour session boxes (e.g., London Macro 1) for high-resolution tracking of intraday traps, liquidity sweeps, and engineered price moves.
These are:
Strategically aligned with session opens (e.g., Frankfurt, London, NY)
Meant to complement the larger macro structure
Ideal for tracking ICT-style entry models
⚙️ Fully Customizable Features
Session visibility toggles
Box background and border color
Line style and color (top, mid, bottom)
Range labels and text styling
Adjustable lookback history depth
🧠 Use Case
This tool is ideal for traders using concepts such as ICT, inner circle trading models, or macro time-based setups. By structuring the trading day into repeatable session blocks, the indicator helps you anchor bias, manage risk, and identify high-probability setups tied to time-based liquidity.

Candle Emotion Oscillator [CEO]Candle Emotion Oscillator (CEO) - Revolutionary User Guide
🧠 World's First Market Psychology Oscillator
The Candle Emotion Oscillator (CEO) is a groundbreaking indicator that measures market emotions through pure candle price action analysis. This is the first oscillator ever created that translates candle patterns into psychological states, giving you unprecedented insight into market sentiment.
🚀 Revolutionary Concept
What Makes CEO Unique
100% Pure Price Action: No volume, no external data - just candle analysis
Market Psychology: Measures actual emotions: Fear, Greed, Panic, Euphoria
Never Been Done Before: First oscillator to analyze market emotions
Exhaustion Prediction: Detects emotional fatigue before reversals
Fast Response: Perfect for your 2-5 minute scalping setup
The Four Core Emotions
🟢 GREED (Positive Values)
What it measures: Market conviction and decisiveness
Candle Pattern: Large bodies, small wicks
Psychology: Traders are confident and decisive
Oscillator: Positive values (0 to +100)
Trading Implication: Trend continuation likely
🔴 FEAR (Negative Values)
What it measures: Market uncertainty and indecision
Candle Pattern: Small bodies, large wicks
Psychology: Traders are uncertain and hesitant
Oscillator: Negative values (0 to -100)
Trading Implication: Consolidation or reversal likely
🚀 EUPHORIA (Extreme Positive)
What it measures: Excessive optimism and buying pressure
Candle Pattern: Large green bodies with upper wicks
Psychology: Extreme bullish sentiment
Oscillator: Values above +60
Trading Implication: Overbought, reversal warning
💥 PANIC (Extreme Negative)
What it measures: Capitulation and selling pressure
Candle Pattern: Large red bodies with lower wicks
Psychology: Extreme bearish sentiment
Oscillator: Values below -60
Trading Implication: Oversold, reversal opportunity
📊 Visual Elements Explained
Main Components
Thick Colored Line: Primary emotion oscillator
Green: Greed (positive emotions)
Red: Fear (negative emotions)
Bright Green: Euphoria (extreme positive)
Dark Red: Panic (extreme negative)
Thin Blue Line: Emotion trend (longer-term context)
Background Gradient: Emotional intensity
Darker = stronger emotions
Lighter = weaker emotions
Diamond Signals: 🔶 Emotional exhaustion detected
Rocket Signals: 🚀 Extreme euphoria warning
Explosion Signals: 💥 Extreme panic warning
Information Table (Top Right)

IPDA Data Ranges📌 IPDA Data Ranges – Institutional Price Delivery Arrays
The IPDA Data Ranges indicator is a precision tool for identifying institutional price delivery arrays over the most recent market sessions. Designed with ICT (Inner Circle Trader) principles in mind, it dynamically draws key price zones based on the high, low, and 50% equilibrium of the last 20, 40, and 60 valid trading days – excluding weekends and holidays.
✅ Key Features
3 Independent Ranges: Configurable boxes for the last 20, 40, and 60 trading days (excludes weekends & market holidays).
Accurate Market-Based Lookback: All calculations are based on actual trading days, ensuring reliability across timeframes.
Visual Precision: Each range is represented as a box with:
Top = Highest High,
Bottom = Lowest Low,
Midline = 50% of the Range
Custom Styling per Range:
Toggle visibility per session
Adjustable box fill color and border color
Custom text inside the box
Fully customizable midline (color & line style)
Individual text color controls for labels within each box
Multi-Timeframe Compatible: Designed to adapt cleanly across intraday and higher timeframes (e.g. 1H, 4H, 1D).
No Future Drawing or Repainting: All ranges are fixed and updated only at the start of each new trading day.
🎯 Use Cases
Identify potential liquidity zones based on institutional memory
Confluence zones for SMT, FVGs, or order blocks
Anchored bias levels for swing/trend confirmation
Integration with your own ICT trading model or algo logic
This indicator is a foundational visual aid for traders who align with smart money concepts and want to maintain a structured, rule-based approach to tracking historical institutional price behavior.

ITM 2x15// © 2025 Intraday Trading Machine
// This script is open-source. You may use and modify it, but please give credit.
// Colors the current 15-minute candle body green or red if the two previous candles were both bullish or bearish.
This script is designed for traders using the Scalping Intraday Trading Machine technique. It highlights when two consecutive 15-minute candles close in the same direction — either both bullish or both bearish.
For example, if you see two consecutive bearish candles, you might look for a long entry on a break above the high of the first bearish candle. This tool helps you visually identify these setups with clean, directional candle coloring — no clutter.