Last BarLast Bar Color
This indicator highlights only the last (most recent) price bar on the chart using dynamic color logic based on price movement:
🟢 Green if the current price closed higher than the previous bar's close
🔴 Red if the current price closed lower than the previous bar's close
⚪ Gray if the current price is unchanged
This simple yet powerful visual cue helps traders:
Quickly assess short-term price momentum
Monitor real-time candle behavior without clutter
Combine with other indicators or strategies for sharper entry/exit signals
🔧 No inputs required. Lightweight and compatible with all timeframes and chart types.
Candlestick analysis

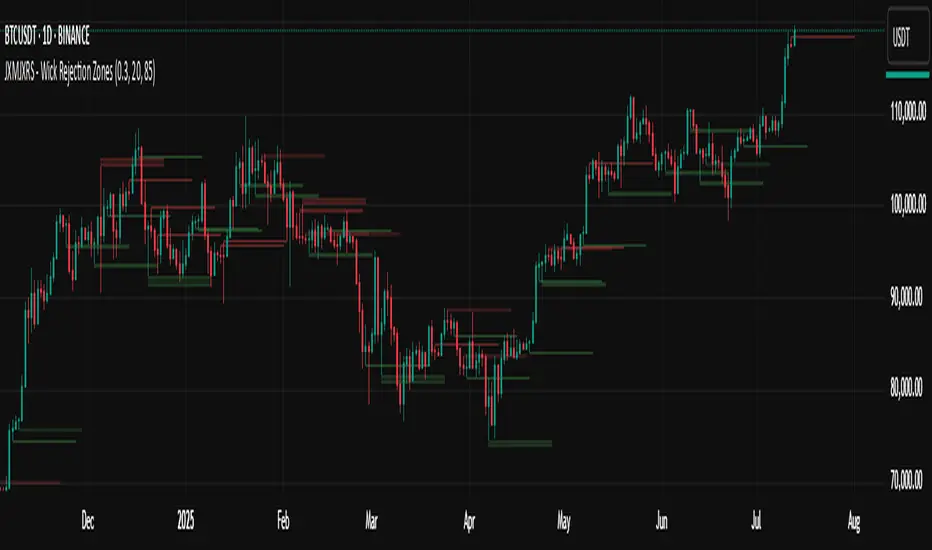
JXMJXRS - Wick Rejection ZonesWick Rejection Zones indicator is designed to identify key price levels where strong rejections occur, typically marked by long wicks and small candle bodies. These zones often signal areas of supply and demand where price was forcefully rejected, making them useful for anticipating potential support or resistance.
The script detects bullish rejection zones when a candle shows a long lower wick, a small body near the top of the candle, and a close above the open. Conversely, bearish rejection zones are identified by long upper wicks, small bodies near the candle low, and a close below the open. This stricter version only highlights the most decisive rejections by enforcing wick dominance and body positioning filters.
When these conditions are met, the indicator draws a colored zone above or below the candle wick to visually represent the rejection area. These zones persist on the chart for a fixed number of bars, allowing traders to reference them for potential reaction levels.
Settings:
Zone Duration (Bars) allows you to control how long each rejection zone remains visible on the chart. A higher number keeps zones active for more bars, while a lower number removes them sooner.
Zone Transparency adjusts the visual opacity of the rejection zones. A lower value makes the zone more visible, while a higher value makes it more transparent.
Bullish Zone Color and Bearish Zone Color let you customize the colors used for bullish and bearish rejection zones, respectively.
This tool is particularly effective in volatile crypto markets where wicks often mark sharp reversals or failed breakout attempts. It can be used as a reference for entries, exits, or stop-loss placement depending on market context.
Relative Volume Candle Shaderthis indicator is based on the work of M0rty's "candle color by volume z-score"
I've taken M0rty's indicator a few steps further to yield a wider range of outputs, showing both extreme high and extreme lows of volume in 2 gradients.
the brightness of the candle is based on the z-score. brighter candles have unusually high volume, and dimmer candles have unusually low volume.


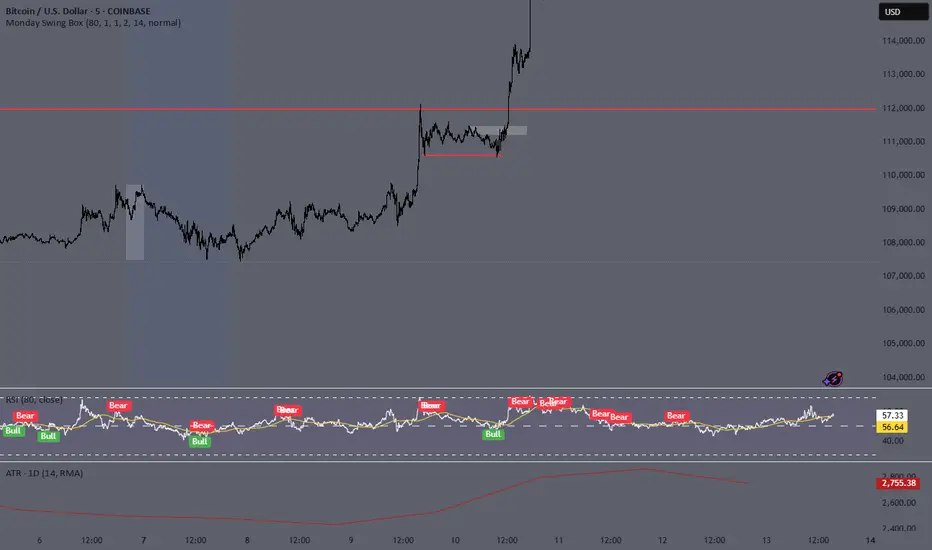
Monday Swing Box# Monday Swing Box Indicator - Trading Applications
This "Monday Swing Box" indicator can be very useful in trading for several strategic reasons:
## 1. **"Monday Effect" Analysis**
* **Concept**: Mondays often have particular characteristics in the markets (opening gaps, weekend catch-up, different volumes)
* **Utility**: Allows visualization and quantification of these Monday-specific movements
* **Application**: Helps identify recurring patterns in your strategy
## 2. **Relative Volatility Measurement with ATR**
* **The ATR percentage tells you**:
* **< 50%**: Low volatility Monday (possible consolidation)
* **50-100%**: Normal volatility
* **> 100%**: Very volatile Monday (important event, potential breakout)
* **Advantage**: Contextualizes the movement relative to historical volatility
## 3. **Practical Trading Applications**
### **For Day Trading**:
* **Entry**: A Monday with >150% ATR may signal a strong movement to follow
* **Stop Loss**: Adjust stop sizes according to Monday's volatility
* **Targets**: Calibrate targets according to the movement's magnitude
### **For Swing Trading**:
* **Support/Resistance**: Monday's high/low often become key levels
* **Breakout**: Breaking above/below Monday's box may signal continuation
* **Retracement**: Return to Monday's box = support/resistance zone
### **For Risk Management**:
* **Sizing**: Adapt position sizes according to measured volatility
* **Timing**: Avoid trading abnormally volatile Mondays if you prefer stability
## 4. **Specific Possible Strategies**
### **"Monday Breakout"**:
* Wait for a break above/below Monday's box
* Enter in the direction of the breakout
* Stop at the other end of the box
### **"Monday Reversal"**:
* If Monday shows >200% ATR, look for a reversal
* The box becomes a resistance/support zone
### **"Monday Range"**:
* Trade bounces off the box limits
* Particularly effective if ATR % is normal (50-100%)
## 5. **Visualization Advantages**
* **Historical**: See past patterns across multiple Mondays
* **Comparison**: Compare current volatility to previous Mondays
* **Anticipation**: Prepare your strategy according to the type of Monday observed
## 6. **Limitations to Consider**
* Monday patterns can vary according to markets and periods
* Don't trade solely on this indicator, but use it as a complement
* Consider macroeconomic context and news
This indicator is therefore particularly useful for traders who want to exploit Monday's specificities and have an objective measure of this day's relative volatility compared to normal market conditions.
CloudHidden - 4H FVG on 15mSee title, plots 4 hour fvg's on the 15 minute chart. ONLY WORKS ON A 15 MINUTE CHART!

NASDAQ Liquidity Breaker Bot1. Define session time (7:20 PM – 7:40 PM BD time / 9:20–9:40 AM EST)
2. Detect 15M swing high/low zones
3. On 1M chart: Detect strong bullish/bearish break
4. Identify breaker candle zone
5. Trigger entry based on break + retest logic
6. Set SL and TP logic (dynamic if needed)
7. Plot everything visually (entries, exits, zones)

Harami After OB/FVG Mitigationupdated harami candlestick pattern provided to plot signals when the OB. and FVG are mitigated

Harami After OB/FVG Mitigationmy strategy with the OB. FVG mitigation and plotting a harami candlestick pattern for possible trade idea
please confirm with the strategy guidelines please

First 15 Min H/L Breakout Signal V3 - Session Aware (Adaptive)this script checks the breakout on 1min time frame as compared to previous breakouts happened on 15min and 5min.

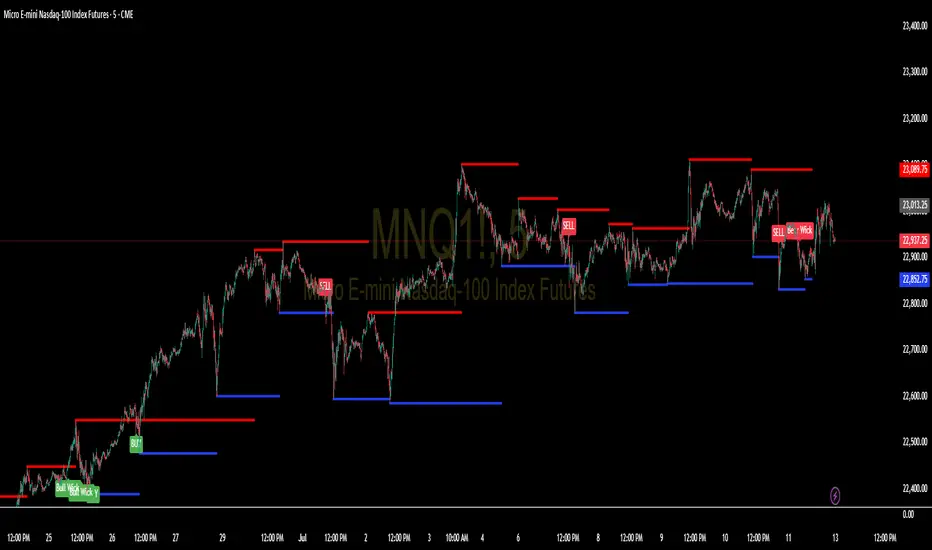
Support and Resistance Levels with BreaksThis indicator identifies dynamic support and resistance levels using pivot point analysis and provides clear trading signals when these levels are broken with volume confirmation. Enhanced version with improved signal clarity for better trading decisions.
## 🔧 Key Features
### Support & Resistance Detection
- Automatically identifies key pivot high and low levels
- Draws clear visual lines (red for resistance, blue for support)
- Configurable sensitivity with left/right bar settings
### Enhanced Trading Signals
- **BUY** signals when resistance is broken with volume confirmation
- **SELL** signals when support is broken with volume confirmation
- **Bull Wick** alerts for potential reversals at resistance
- **Bear Wick** alerts for potential reversals at support
### Volume Confirmation
- Built-in volume oscillator using 5 and 10-period EMAs
- Filters out low-volume false breakouts
- Adjustable volume threshold (default: 20%)
### Complete Alert System
- Support Broken alerts
- Resistance Broken alerts
- Bull Wick reversal alerts
- Bear Wick reversal alerts
## ⚙️ Settings
- **Show Breaks**: Toggle signal display
- **Left Bars**: Pivot detection lookback (default: 15)
- **Right Bars**: Pivot detection lookforward (default: 15)
- **Volume Threshold**: Minimum volume increase for valid signals (default: 20%)
## 📈 Best For
- Swing trading strategies
- Breakout confirmation
- Support/resistance trading
- Volume-based entry signals
## 🔍 How It Works
1. Identifies pivot highs/lows using configurable periods
2. Calculates volume oscillator for confirmation
3. Generates BUY signals on resistance breaks with volume
4. Generates SELL signals on support breaks with volume
5. Detects wick patterns for potential reversals
## 📋 Updates in This Version
- Enhanced BUY/SELL signal clarity (replaced generic "B" labels)
- Added Bull Wick and Bear Wick alert conditions
- Updated to Pine Script v6 compatibility
- Improved signal filtering and accuracy
## ⚠️ Disclaimer
This indicator is for educational and informational purposes only. Always conduct your own analysis and risk management before making trading decisions. Past performance does not guarantee future results.
---
**Original Script**: "Support and Resistance Levels with Breaks" by LuxAlgo
**License**: CC BY-NC-SA 4.0
**Enhanced by**: profitgang
**Version**: Pine Script v6
Daily Price Change (%)Description:
This script displays the percentage change of the last N candles either above each bar or along a shared horizontal line.
You can choose between two calculation methods:
Close vs Previous Close
Open vs Close
Labels are fully customizable:
Adjustable text size
Custom background color
Number of candles to display
Fixed 10% spacing above candles (prevents overlap)
Ideal for visualizing short-term momentum and price action in a clean, non-intrusive format.
Examples:
Disclaimer:
This script is provided for informational and educational purposes only.
The author assumes no liability for any financial losses, software errors, or misinterpretations.
Always do your own research and use trading tools at your own risk.

Essa - Market Structure DetectorA comprehensive tool for identifying real-time market structure patterns using pivot analysis, adaptive volatility filtering, and multi-timeframe confluence. This script highlights higher highs (HH), higher lows (HL), lower highs (LH), and lower lows (LL), while offering intelligent confirmations and optional visual aids.
Key Features:
Dynamic detection of HH, HL, LH, LL based on pivot structures
Adaptive sensitivity using ATR-based volatility filters
Confirmation logic based on breakout alignment
Optional ZigZag line rendering between key pivots
Customisable labels with confluence indicators
Multi-timeframe pattern scanning with auto-scaling timeframes
Info panel showing current pattern, trend bias, mode, and structure across 5 higher timeframes
Built-in alerts for structure shifts and high-confluence setups
This tool is ideal for traders who rely on structure-based entries, multi-timeframe confluence, and precision pattern recognition to anticipate trend reversals or continuations with high confidence.

Essa - Enhanced Fibonacci Confluence ToolkitA precision-engineered trading tool designed to identify high-probability reversal zones using price action alone. This version expands on traditional Fibonacci confluence techniques by integrating a multi-tiered market structure framework and advanced state management.
Key Features:
Fully automated CHoCH (Change of Character) detection
Tiered market structure logic (Short, Intermediate, Long-Term)
Dynamic Area of Interest (AOI) zone rendering
Automatic Fibonacci retracement plotting from swing highs/lows
Customisable Fibonacci levels (0% to 100%, including 23.6%, 61.8%, 65%, 78.6%)
Real-time Fibonacci invalidation logic with on-chart alerts
Bullish and bearish engulfing candle detection with structure-based filtering
Configurable swing labels (◉, △▽, H/L) with size control
Adjustable CHoCH line styles and widths
Optional display of Fibonacci level labels
Modular and efficient codebase with object-oriented architecture
Originally inspired by the LuxAlgo Fibonacci Confluence Toolkit (v5). Credit to LuxAlgo for the foundational concept.

Recent Pullback Percentage//@version=5
indicator("Recent Pullback Percentage", shorttitle="Pullback %", format=format.percent)
// 定義回顧期間
lookbackPeriod = input.int(60, title="Lookback Period")
// 找到近期最高價
highestHigh = ta.highest(high, lookbackPeriod)
// 計算回檔百分比
pullbackPercent = ((close - highestHigh) / highestHigh)
plot(pullbackPercent, title="Pullback Percentage")

Multi-Signal Entry Parachute – Buy ConfirmationMulti-Signal Entry Parachute – StochRSI + ADX + Volatility Confirmation
The Multi-Signal Entry Parachute is a buy-focused tool designed to identify high-probability long setups using a layered confirmation approach. By filtering for momentum exhaustion, trend weakening, and volatility upticks, the indicator aims to act as a supportive “parachute” for more confident entry timing .
It works best on higher time frames , where signals are typically more reliable and less prone to short-term noise. The goal is not to capture every market move, but to enhance the timing and conviction of long entries within broader structures.
Please note that this tool provides buy signals only . It does not include exit conditions or shorting logic. Users are advised to apply their own judgment for managing exits—such as monitoring divergence, volatility shifts, or key resistance levels.
The Entry Parachute is most effective when used as part of a broader trading system, serving as a confirmation layer rather than a standalone signal generator.

Fractal Model [BLAZ]TTrades Fractal Model (TTFM) operates on a foundational principle: price moves in fractal cycles, alternating between consolidation, reversal and expansion. By leveraging this, the model identifies key HTF swing formations following liquidity sweeps and validates directional bias through confirmed HTF candle closures. Once these macro-level cues are established, TTFM monitors the Change in State of Delivery (CISD) on the LTF, highlighting the exact instant momentum shifts in favour of a potential move. This allows traders to position themselves at the optimal point within the broader HTF expansion phase.
Built with versatility in mind, TTFM is compatible across all asset classes—including Indices, Futures, Forex, Commodities, and Crypto—and can be applied effectively on any timeframe, from intraday scalping to position trading. The indicator also offers a high degree of customisation, giving users the ability to tailor timeframes, visual display, and bias filters to match their personal strategy and chart aesthetics.
Developed by a trader, for traders, providing a structured model that transforms complex price action into clear, actionable insight. Whether you're seeking refined entries, greater context behind price movement, or a consistent edge rooted in ICT principles, TTFM delivers a powerful framework to support your trading journey.
Core Functionality
1) Setup Display Control:
Users can customise how many historical setups are shown on the chart, with support for up to 50 combined entries. The indicator displays both bullish and bearish TTFM setups within the selected limit, including invalidated scenarios. As an example in the image below, selecting “4 setups” will plot the most recent mix of bullish and bearish opportunities based on model logic.
2) Bias Filter:
The indicator includes a built-in bias filter that allows you to control which setups are displayed based on your directional outlook. You can choose to view only bullish setups, only bearish setups, or select a balanced mode to show both. This flexibility helps traders align the model's output with their own market bias or broader trading framework.
The previous image demonstrates the balanced setting, while the example below illustrates the same chart but when filtered to show only bearish setups.
3) Custom Timeframe Alignment:
Multi-timeframe analysis is a core principle of ICT methodology, enabling traders to align entries on lower timeframes with structure and bias defined on higher timeframes. The TTFM indicator incorporates this principle by allowing users to manually configure their preferred combination of High Timeframe (HTF) and Low Timeframe (LTF) for setup generation.
While the indicator is designed with optimal default alignments (e.g., 1W–4H, 1D–1H, 4H–15M, 1H–5M), traders can explore and define their own configurations to suit their strategies and market focus. This flexibility allows for more refined trade planning, ensuring entries are framed within meaningful HTF context.
The image below illustrates an example of 4H-based HTF reversals confirmed on the 15-minute LTF, displayed while viewing a 5-minute chart.
4) Invalidated Setups Display:
The indicator provides an option to display or hide setups that have been invalidated. This feature helps traders maintain clarity on the chart while still being aware of historical model behaviour. Invalidated setups are visually marked with distinct labels: amber if invalidated at Candle 3 (C3) and red if invalidated at Candle 4 (C4).
Even when toggled off for visual purposes, invalidated setups remain part of the total setup count, preserving analytical consistency. The images below compare chart views with and without invalidated setups displayed, offering flexibility between comprehensive review and a cleaner, focused display of higher-probability setups.
With invalidated setups:
Without invalidated setups:
5) Visibility Filters:
The indicator includes advanced filtering options that allow traders to control when and where setups appear on the chart. Users can restrict TTFM setups to specific intraday time windows, such as active trading sessions like New York (NY) or London, helping them focus on high-volume, high-opportunity periods.
Additionally, the indicator offers the ability to limit visibility by higher timeframe (HTF), which is particularly useful when conducting macro-level analysis to define market bias or structural narrative.
The examples below show the contrast between a full-day setup display and a filtered view showing only NY session setups on the NQ1! chart.
6) High Timeframe (HTF) Annotations:
The indicator includes a comprehensive HTF annotation system designed to enhance structural clarity directly on lower timeframe charts. It visualises the Power of 3 (PO3) across the most recent five HTF candles, offering detailed insight into HTF price behaviour and key levels of interest.
Displayed elements include:
HTF liquidity sweeps
Current HTF candle open
Previous candle equilibrium level
HTF Fair Value Gaps (FVGs)
Candle-specific labels and a live countdown to HTF closure
LTF open labels within each HTF candle
All components are fully customisable—traders can toggle visibility, adjust colour schemes, thickness, width, spacing, and how far back the HTF annotations appear relative to the current bar. This level of control allows for seamless integration with any charting style while maintaining visual clarity and precision.
In addition to the standard five-candle view, the indicator offers the flexibility to display between five to ten High Timeframe (HTF) candles, empowering traders to broaden their market context and better understand unfolding price action within a structured HTF narrative. By visualizing extended HTF sequences—including liquidity sweeps, Fair Value Gaps (FVGs), and critical reference levels—users are able to identify and react to price activity within defined Premium and Discount Arrays (PDAs). This enhanced visibility allows traders to strategically position themselves in alignment with institutional order flow and capitalize on potential HTF expansions, thereby increasing the probability of trade success through deeper market alignment.
7) Low Timeframe (LTF) Annotations:
To support efficient and precise trade execution, the indicator displays detailed LTF-level annotations derived from the TTFM framework. These visual cues are designed to align entries with the structural context of HTF setups and provide clear reference points throughout the trade.
Key LTF components include:
Vertical separation lines marking each of the 5 HTF candles
Sweeps of prior HTF highs and lows
CISD (Change in State of Delivery) level
Consequent Encroachment (CE) of the CISD
Midpoint of the previous HTF candle
Potential holding zones (T-Spots)
Potential liquidity targets related to each setup
All elements are fully customisable, allowing traders to adjust visibility, colours, and styling preferences to maintain chart clarity while focusing on execution.
Disclaimer & Terms of Use
The concept behind the Fractal Model was originally introduced by TTrades. This indicator, titled Fractal Model , has been independently developed by the author based on their own study, interpretation, and practical application of the model. The code and structure of this indicator are original and were written entirely from scratch to reflect the author's unique understanding and experience.
This tool is provided solely for educational and informational purposes. It is not intended—and must not be interpreted—as financial advice, investment guidance, or a recommendation to buy or sell any financial instrument. The indicator is designed to assist with technical analysis based on market structure theory but does not guarantee accuracy, profitability, or specific results.
Trading financial markets involves significant risk, including the possibility of loss of capital. By using this indicator, you acknowledge and accept that you are solely responsible for any decisions you make while using the tool, including all trading or investment outcomes. No part of this script or its features should be considered a signal or assurance of success in the market.
By subscribing to or using the indicator, you agree to the following:
You fully assume all responsibility and liability for the use of this product.
You release the author from any and all liability, including losses or damages arising from its use.
You acknowledge that past performance—real or hypothetical—does not guarantee future outcomes.
You understand that this indicator does not offer personalised advice, and no content associated with it constitutes a solicitation of financial action.
You agree that all purchases are final. Once access is granted, no refunds, reimbursements, or chargebacks will be issued under any circumstance.
You agree to not redistribute, resell, or reverse engineer the script or any part of its logic.
Users are expected to abide by all platform guidelines while using or interacting with this tool. For access instructions, please refer to the Author's Instructions section or access the tool through the verified vendor platform.

Angle-Momentum-Force v2 [Alex Ko]Angle-Momentum-Force v2 — это пользовательский индикатор, который помогает определить силу и направление рыночного движения, объединяя три параметра:
Угол атаки — рассчитывается на основе наклона скользящей средней (EMA).
Моментум цены — показывает скорость изменения цены за заданный период.
Сила движения (Force) — определяется как произведение объёма на моментум (объём × моментум).
Как пользоваться:
Индикатор строится в отдельной панели под графиком.
Зеленый фон появляется при выполнении сигнала на покупку:
Угол > 20°, Моментум > 0, Сила > порога.
Ты можешь настраивать параметры:
EMA Period,
Momentum Period,
Force Threshold.
Используй как фильтр для входа или подтверждение тренда.
Angle-Momentum-Force v2 is a custom indicator designed to visualize the strength and direction of price movement by combining:
Angle of Attack — calculated based on the slope of the EMA line.
Price Momentum — the rate of price change over a defined period.
Force of Movement — defined as volume × momentum.
How to Use:
The indicator displays in a separate pane below the chart.
A green background highlights a buy signal when all three conditions are met:
Angle > 20°, Momentum > 0, and Force > Threshold.
You can customize:
EMA Period,
Momentum Period,
Force Threshold.
Use it as an entry filter or trend confirmation tool.

Liquidity RushThe “Liquidity Rush - 20D Avg Rupee Volume” indicator is useful for traders and investors who want to quickly assess the trading activity of a stock in value terms — not just volume. It calculates and displays the average daily rupee volume (price × volume) over the last 20 trading days, shown in ₹ Crores on the latest candle.

Weekend Trap
Weekend Trap Indicator
A comprehensive weekend range analysis tool designed to identify and track low-liquidity weekend price movements with advanced market maker detection.
What is the Weekend Trap?
The Weekend Trap refers to price ranges established during low-liquidity weekend periods (Saturday 5:00 AM to Monday 5:00 AM Perth time) when institutional trading is minimal.
Key Features
📊 Weekend Range Detection
Automatically identifies weekend periods based on Perth timezone
Creates visual rectangles showing weekend high/low ranges
Displays 50% midline for key pivot levels
Configurable range cutoff (default: Sunday 3:00 PM)
🎯 Advanced Market Maker Detection
PVSRA-style volume analysis for institutional activity identification
4-color coding system:
🟢 Lime: 200% Bull volume (Peak volume + bullish candle)
🔴 Red: 200% Bear volume (Peak volume + bearish candle)
🔵 Blue: 150% Bull volume (Rising volume + bullish candle)
🟣 Fuchsia: 150% Bear volume (Rising volume + bearish candle)
Weighted volume calculation for better peak detection
Circles positioned above bars for clear visualization
📈 Range Analytics
Clean range labels showing:
Absolute price range
Percentage movement
Historical analysis with configurable lookback period
Current weekend tracking with real-time updates
Settings Overview
Core Settings
Weeks to Backtest (1-52): Number of completed weekends to display
Show Weekend Trap Rectangles: Toggle rectangle visibility
Use Wicks for Rectangle Height: Include wicks vs. body-only ranges
Sunday Range Cutoff Hour: When to stop updating weekend range
Visual Customization
Rectangle colors and borders
Market maker marker sizes (tiny to large)
PVSRA color scheme for different volume levels
Label display options
Market Maker Detection
Automatic PVSRA analysis during weekend periods
150% threshold: Volume ≥ 150% of 10-period average
200% threshold: Volume ≥ 200% of average OR weighted volume peak
Real-time detection with immediate visual feedback
How to Use
Add to your chart (works on any timeframe, recommended: 1H-4H)
Set your preferred lookback period (default: 4 weeks)
Observe weekend ranges and note market maker activity
Monitor volume spikes indicated by colored circles
Analysis Applications
Weekend Range Analysis
Identify price ranges during low-liquidity periods
Track historical weekend price movements
Analyze range size and frequency patterns
Market Maker Detection
Identify institutional accumulation/distribution
Spot manipulation during low-liquidity periods
Analyze volume patterns and anomalies
Historical Pattern Recognition
Weekend range comparison across multiple periods
Multiple timeframe analysis capability
Volume pattern identification
Technical Details
Timezone: Australia/Perth (GMT+8)
Weekend Period: Saturday 5:00 AM → Monday 5:00 AM
Volume Analysis: 10-period moving average baseline
Weighted Volume: Volume × (High - Low) for peak detection
Object Management: Automatic cleanup based on lookback period
Best Practices
Use on liquid markets (major forex pairs, crypto, indices)
Adjust lookback period based on analysis timeframe
Monitor during Asia-Pacific trading hours for best results
Consider fundamental events that may affect weekend gaps
Credits
Volume analysis inspired by PVSRA (Price Volume Spread Range Analysis) methodology for institutional activity detection.
This indicator is designed for educational and analysis purposes.

SuperPerformance_V1.24SuperPerformance V1.24 - Advanced Performance Analysis Indicator
🎯 CORE FEATURES
📊 Performance Analysis
• Stock vs Index comparison across 6 timeframes (1D to 200D)
• Conviction scoring system (Perfect/Solid/Good/Ok/Weak/Poor)
• Real-time outperformance tracking with ✓/✗ indicators
🏢 Sector Analysis
• Top 5 sector ranking with live performance data
• 10 Indian market sectors tracking (PHARMA, TECH, FINANCE, etc.)
• Automatic sector identification for current stock
📈 Technical Tools
• Triple Moving Averages (SMA/EMA/WMA/HMA)
• Distance from MA analysis with percentage/spread calculations
• Enhanced hover tooltips showing distance info
🔔 Smart Alerts
• Dynamic Circuit Breakers (20%/10%/5%/2%) that adapt to volatility
• Extreme distance alerts when price deviates significantly from MA
🎨 Visual Interface
• 4 customizable tables: Stock Performance, Sector Performance, Distance Analysis, Sector Display
• Dark/Light themes with professional styling
• Flexible positioning - place tables anywhere on chart
• Mini mode for compact display
⚡ Advanced Features
• Real-time data from 10+ Indian indices
• Granular controls - show/hide any columns or rows
• Multiple tooltip methods (Labels/Data Window)
• Professional color coding for quick analysis
🎯 PERFECT FOR:
Indian stock traders, sector rotation analysis, performance monitoring, and technical analysis with institutional-grade features.
📌 KEY BENEFITS:
✅ Multi-timeframe performance tracking
✅ Sector rotation insights
✅ Advanced moving average analysis
✅ Professional-grade visualization
✅ Customizable alerts and notifications
✅ Indian market focus with NSE data integration
🔧 TECHNICAL SPECIFICATIONS:
• Pine Script v5 compatible
• Overlay indicator
• Real-time data processing
• Memory optimized
• Multi-security data support
• Professional color schemes

[Gadatas] Smart BOS Dual TFSmart Liquidity Levels Dual TF - BOS Confirmation Tool
This indicator helps traders identify Break of Structure (BOS) signals confirmed across two timeframes — ideal for smart money strategies and high-probability trade setups.
Key Features
Dual Timeframe Structure Detection: Plots liquidity levels (swing highs/lows) for both the chart timeframe (LTF) and a higher timeframe (HTF) of your choice.
Smart BOS Signal: Generates a signal only when a BOS occurs on both LTF and HTF — reducing false breakouts.
Customizable Volume Spike Filter: Optionally require a volume surge to confirm strength behind the move.
Clean Chart Visuals:
HTF Levels: Bold Red/Green lines.
LTF Levels: Thin Orange/Teal lines.
Signal Arrows when conditions align.
User Inputs
Structure Sensitivity – Number of bars used to detect swing highs/lows.
HTF Selection – Choose any higher timeframe (e.g., 1H on a 15M chart).
Volume Spike Filter – Optional confirmation using SMA-based volume threshold.
Alerts – Trigger alerts only when both LTF and HTF confirm BOS with (optional) volume spike.
Best Used For
Identifying high-confidence breakout zones.
Avoiding traps caused by weak structure breaks.
Supporting entry/exit decisions within a smart money framework.
