CipherMatrix Dashboard (MarketCipher B)Pre-compute MarketCipher-B values for each fixed timeframe (5 m, 15 m, 30 m, 60 m, 4 H, Daily).
Pass those values into plotRow() instead of calling request.security() inside the helper—removes the style warning.
Added explicit range parameters to table.clear(dash, 0, 0, 2, 6) to satisfy v6’s argument requirement.
This version should compile without the previous warnings/errors. Swap in your real MarketCipher-B histogram when you’re ready, and the dashboard is good to go!
Candlestick analysis

CipherMatrix Dashboard (MarketCipher B)does it work. A lightweight, multi-time-frame overlay that turns MarketCipher B data into an at-a-glance dashboard:
Time-frames shown: current chart TF first, then 5 m, 15 m, 30 m, 1 H, 4 H, Daily.
Bias icons:
🌙 = bullish (MCB > 0)
🩸 = bearish (MCB < 0)
Signal icons:
⬆️ = histogram crosses above 0 (potential long)
⬇️ = histogram crosses below 0 (potential short)
Table location: bottom-right of chart; updates on every confirmed bar.

Supports & Resistances with MomentumSupports & Resistances with Momentum is an advanced indicator for scalping and intraday trading It shows dynamic support and resistance levels, clear BUY/SELL signals with TP targets and stop-loss lines, plus optional RSI and volume plots Fully customizable and designed for quick, precise trade decisions.

DS FLUXO 1.0# 🔥 DS FLUXO 1.0 - Flow Analysis and Zone Indicator
## 📋 **OVERVIEW**
DS FLUXO is an advanced indicator that identifies trend changes and operational zones based on price flow analysis. It combines structural breakout detection with automatic support/resistance zone creation, offering a comprehensive approach to technical analysis.
## 🎯 **KEY FEATURES**
### **Breakout Detection**
- Identifies trend changes through structural breakouts
- Clear BUY/SELL signals at flow change points
- Breakout line history control (1-10 lines)
- Customizable reference lines (color, thickness, style)
### **Dynamic Zones**
- Automatic creation of support zones (uptrend) and resistance zones (downtrend)
- Zones based on candle wicks and bodies
- Central line (50%) for additional reference
- Visual zone filling with adjustable transparency
### **Complete Alert System**
- 🟢🔴 Breakout alerts for trend changes
- 🎯 First touch alerts on zones
- Individual control for each alert type
- Controlled frequency (no spam)
## ⚙️ **AVAILABLE SETTINGS**
### **🔥 Breakout**
- Maximum number of lines in history
- Visual customization (color, thickness, style)
- Line extension control
### **🏷️ Labels**
- Customizable colors for BUY/SELL
- Adjustable font size
- Configurable text color
### **🎯 Zones**
- Line colors (top, middle, bottom)
- Zone filling and borders
- Temporal displacement of zones
- Line thickness and style
### **🔔 Alerts**
- General alert control
- Specific alerts by type (breakout/zones)
- Clean messages with timeframe
## 🎨 **HOW TO USE**
### **Trend Identification**
1. Wait for BUY/SELL signals for flow changes
2. Observe breakout lines as reference
3. Use zones for entry/exit points
### **Zone Trading**
1. **Uptrend**: Wait for touches on buy zone (green)
2. **Downtrend**: Wait for touches on sell zone (red)
3. **First Touch**: Higher probability of reaction
### **Alert Configuration**
1. Enable desired alerts in settings
2. Configure notifications in TradingView
3. Receive real-time alerts for opportunities
## 📊 **RECOMMENDED TIMEFRAMES**
- **Swing Trade**: 4H, 1D, 1W
- **Day Trade**: 15M, 30M, 1H
- **Scalp**: 1M, 3M, 5M
## 🔧 **TECHNICAL CHARACTERISTICS**
- Compatible with Pine Script v5
- Overlay: Yes (draws over chart)
- Alerts: Yes (complete system)
- Configurable: Highly customizable
- Performance: Optimized for multiple timeframes
## 💡 **SUGGESTED STRATEGIES**
### **Breakout Strategy**
- Enter in direction of confirmed breakout
- Use zones as targets or support/resistance
- Manage risk with structural stop loss
### **Zone Strategy**
- Wait for first touch on zone for entry
- Confirm with other indicators
- Use central line (50%) as partial reference
## ⚠️ **IMPORTANT NOTICE**
This indicator is a technical analysis tool and does not constitute investment advice. Always conduct your own analysis and properly manage risk in your trades.
---
**Developed by**: Diogo Stefani
**Version**: 1.0
**Last Update**: 2025

Breakout LabelsThis script labels the highest price of the lowest candle over a period of time. It then labels any bullish breakouts where the close price is higher than the high of the lowest candle.

Top 3 Largest RTH CandlesThis simply marks the top three sized candles to show potential momentum changes or swings.

RelicusRoad - Gold & Bitcoin90% of traders lose money because they do not know what they are doing. They do not have a system in place that works. They do not have a mentor to guide them. They do not have a community to support them. They do not have the right tools to help them make better decisions.
RelicusRoad is the ultimate trading system that will help you make better decisions and become a better trader. It is the result of years of research and development by a team of professional traders who have been in the market for over 10 years.

Bullish & Bearish Wick MarkerMarks bullish and bearish engulfing candles
Bullish engulfing candle:
when the low is lower than the previous candle low and the body close is higher than the previous candle body
Bearish engulfing cande:
when the high is higher than the previous candle high and the body close is lower than the previous candle body


Engulfing Pattern LineThe "Engulfing Pattern Line" is a custom TradingView indicator designed to identify and visualize engulfing candlestick patterns on a price chart, which are commonly used in technical analysis to predict potential reversals or continuations in market trends. This indicator specifically detects bullish and bearish engulfing patterns and draws a line extending from the engulfed candle for a user-defined number of candles.

SnD SCANNER V 1.0This is a test script, will update on going.
This Indicator will help you find the unfilled order in the market.
Such as RBR DBR or DBD RBD.
Still on going test, so I will update this on the run.

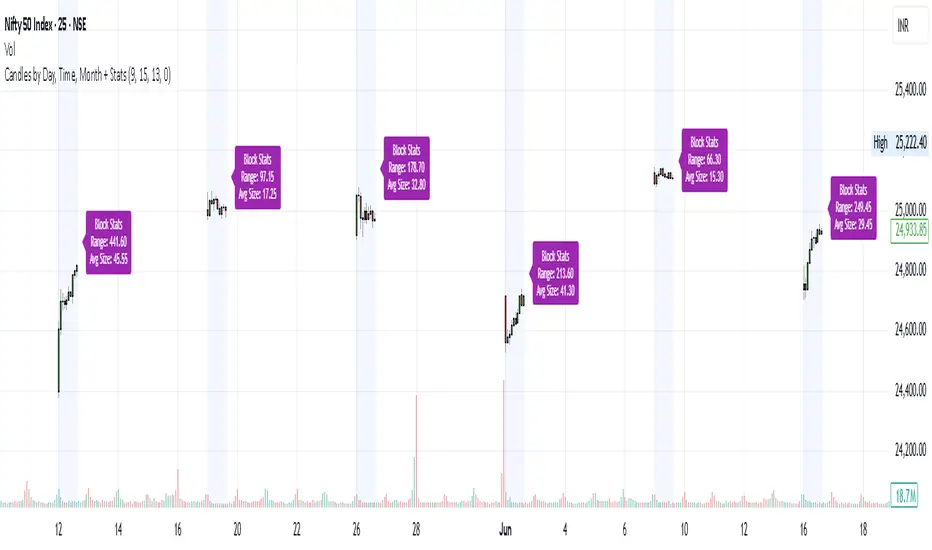
Candles by Day, Time, Month + StatsThis Pine Script allows you to filter and display candles based on:
📅 Specific days of the week
🕒 Custom intraday time ranges (e.g., 9:15 to 10:30)
📆 Selected months
📊 Shows stats for each filtered block:
🔼 Range (High – Low)
📏 Average candle body size
⚙️ Key Features:
✅ Filter by day, time, and month
🎛 Toggle to show/hide the stats label
🟩 Candles are drawn only for selected conditions
📍 Stats label is positioned above session high (adjustable)
⚠️ Important Setup Instructions:
✅ 1. Use it on a blank chart
To avoid overlaying with default candles:
Open the chart of your preferred symbol
Click on the chart type (top toolbar: "Candles", "Bars", etc.)
Select "Blank" from the dropdown (this will hide all native candles)
Apply this indicator
This ensures only the filtered candles from the script are visible.
Adjust for your local timezone
This script uses a hardcoded timezone: "Asia/Kolkata"
If you are in a different timezone, change it to your own (e.g. "America/New_York", "Europe/London", etc.) in all instances of:
time(timeframe.period, "Asia/Kolkata")
timestamp("Asia/Kolkata", ...)
Use Cases:
Opening range behavior on specific weekdays/months
Detecting market anomalies during exact windows
Building visual logs of preferred trade hours
TVI-3 Z-Score: MA + VWAP + BB Composite🔧 Overview:
It combines:
Z-score of price relative to the 200-period simple moving average (MA)
Z-score of price relative to the 200-period VWAP (volume-weighted average price)
Z-score of Bollinger Band width
The result is an average of these three Z-scores, plotted as a composite indicator for identifying overvalued and undervalued conditions.

Filtered FVG - Impulsive Only📌 Filtered Fair Value Gap (FVG) — Impulse-Based Detection Only
This indicator detects Fair Value Gaps (FVGs) that occur only after strong, impulsive price moves, helping traders avoid false signals during sideways or choppy markets.
🔍 Key Features:
• ✅ Filters out weak FVGs formed in ranging conditions.
• ✅ Marks only FVGs where the candle body is ≥ your defined % of total range (default: 60%).
• ✅ Plots bullish and bearish FVGs as colored boxes.
• ✅ Optional display of unmitigated levels for tracking.
• ✅ Clean and lightweight for intraday or swing setups.
🎯 Why Use This?
Not all FVGs carry institutional intent. This script narrows focus to only those gaps that emerge after displacement candles, improving quality of setups and reducing chart noise.
⚙️ Customizable Inputs:
• Minimum body size for impulsive move.
• Extend length for FVG zone display.
• Color settings and unmitigated level tracking.

Normalized Reserve Risk (Proxy Z-Score)normalised version of the reserve risk indicator on btc magazine because the btc magazine one is poo .

minchang volume tradingCondition
Point color
Volume ≥ 3× MA(24)
Violet
Volume ≥ 1.5× MA(24)
Red
Volume < 1.5× MA(24) & bullish
White
Volume < 1.5× MA(24) & bearish
Black

Nến Tô Màu Theo Volume / MA(21)Condition
Point color
Volume ≥ 3× MA(24)
Violet
Volume ≥ 1.5× MA(24)
Red
Volume < 1.5× MA(24) & bullish
White
Volume < 1.5× MA(24) & bearish
Black

ASK $🚀 My Exclusive Indicator on TradingView
Carefully designed to capture the best entry and exit opportunities, combining smart analysis with user-friendly simplicity.
Now available only for premium users – message me to get access and have your username added!

Volume Impulse Order Blocks | InvrsROBINHOODWhat the Indicator Does
The Volume Impulse Order Blocks indicator is designed to automatically identify and highlight key price zones where significant trading activity occurs, particularly after the market has made a potential bottom. Its primary goal is to visually distinguish between the initial, often institutional-driven market moves ("Smart Money") and the subsequent reactions from the broader market ("Retail").
The indicator watches for two specific volume patterns:
Paired Impulses: After identifying a significant swing low in price, the indicator looks for the first major spike in volume. It marks this as a "Smart Money" zone. It then watches for the next volume spike, which it labels as a "Retail" zone.
Singular Impulses: Sometimes, a single, powerful volume spike occurs on a candle that is the opposite color of the bars immediately surrounding it. The indicator identifies this as a standalone "Smart Money" event, suggesting a strong, isolated market action.
How to Use It in Trading
This indicator provides visual cues that can be interpreted as potential areas of future support or resistance.
Identifying Key Zones (The Boxes):
Smart Money Box (White/Black): This is the most important signal. It highlights a price range where large players may have initiated positions. A white box marks a bullish (up) candle, and a black box marks a bearish (down) candle. Traders often watch these zones closely, as price may react strongly if it returns to test them in the future.
Retail Box (Red): This box shows where the general market likely followed the initial smart money move. While still significant, it represents a secondary reaction.
Extending Boxes: All boxes automatically extend to the right and will only disappear once the price has traded completely through them. This allows you to see which zones have been "respected" and which have been "broken."
Confirmation Signals:
Blue Vertical Line: This thin blue line is a simple pointer that marks the exact candle of the initial "Smart Money" impulse, helping you pinpoint the event in time.
Trend Reversals: The appearance of a Smart Money box after a prolonged downtrend and a pivot low can be an early signal that the trend may be losing momentum and that significant buyers are entering the market.
In practice, a trader might use these boxes as high-probability zones to look for entries, exits, or to simply understand the underlying market dynamics. As with any tool, it is most effective when used in conjunction with other forms of analysis, such as market structure and trend analysis.

RSI For LoopTitle: RSI For Loop
SurgeQuant’s RSI with Threshold Colors and Bar Coloring indicator is a sophisticated tool designed to identify overbought and oversold conditions using a customizable Relative Strength Index (RSI). By averaging RSI over a user-defined lookback period, this indicator provides clear visual signals for bullish and bearish market conditions. The RSI line and price bars are dynamically colored to highlight momentum, making it easier for traders to spot potential trading opportunities.
How It Works
RSI Calculation:
Computes RSI based on a user-selected price source (Close, High, Low, or Open) with a configurable length (default: 5). Optional moving average smoothing refines the RSI signal for smoother analysis.
Lookback Averaging:
Averages the RSI over a user-defined lookback period (default: 5) to generate a stable momentum indicator, reducing noise and enhancing signal reliability.
Threshold-Based Signals:
Long Signal: Triggered when the averaged RSI exceeds the upper threshold (default: 52), indicating overbought conditions.
Short Signal: Triggered when the averaged RSI falls below the lower threshold (default: 48), indicating oversold conditions.
Visual Representation
The indicator provides a clear and customizable visual interface: Green RSI Line and Bars: Indicate overbought conditions when the averaged RSI surpasses the upper threshold, signaling potential long opportunities.
Red RSI Line and Bars: Indicate oversold conditions when the averaged RSI drops below the lower threshold, signaling potential short opportunities.
Neutral Gray RSI Line: Represents RSI values between thresholds for neutral market conditions.
Threshold Lines: Dashed gray lines mark the upper and lower thresholds on the RSI panel for easy reference.
Customization & Parameters
The RSI with Threshold Colors and Bar Coloring indicator offers flexible parameters to suit
various trading styles: Source: Select the input price (default: Close; options: Close, High, Low, Open).
RSI Length: Adjust the RSI calculation period (default: 5).
Smoothing: Enable/disable moving average smoothing (default: enabled) and set the smoothing length (default: 10).
Moving Average Type: Choose from multiple types (SMA, EMA, DEMA, TEMA, WMA, VWMA, SMMA, HMA, LSMA, ALMA; default: ALMA).
ALMA Sigma: Configure the ALMA smoothing parameter (default: 5).
Lookback Period: Set the period for averaging RSI (default: 5).
Thresholds: Customize the upper (default: 52) and lower (default: 48) thresholds for signal generation.
Color Settings: Transparent green and red colors (70% transparency) for bullish and bearish signals, with gray for neutral states.
Trading Applications
This indicator is versatile and can be applied across various markets and strategies: Momentum Trading: Highlights strong overbought or oversold conditions for potential entry or exit points.
Trend Confirmation: Use bar coloring to confirm RSI-based signals with price action on the main chart.
Reversal Detection: Identify potential reversals when RSI crosses the customizable thresholds.
Scalping and Swing Trading: Adjust parameters (e.g., RSI length, lookback) to suit short-term or longer-term strategies.
Final Note
SurgeQuant’s RSI with Threshold Colors and Bar Coloring indicator is a powerful tool for traders seeking to leverage RSI for momentum and reversal opportunities. Its combination of lookback-averaged RSI, dynamic threshold signals, and synchronized RSI and bar coloring offers a robust framework for informed trading decisions. As with all indicators, backtest thoroughly and integrate into a comprehensive trading strategy for optimal results.

First Opposite Candle After 3+ (Yellow & Streak Alerts)This overlay tracks consecutive candle direction: when three or more bars run the same way, the very next opposite-color candle is spotlighted in yellow. Two built-in alert events keep you hands-free:
“First Opposite Candle After 3+” – fires the moment that yellow reversal prints.
“3+ Candle Streak” – pings every bar while a bullish-or-bearish run is ≥ 3 candles long.

xGhozt Wickless Candle Streak ProbabilityThe xGhozt Wickless Candle Streak Probability is a custom Pine Script indicator designed to identify and quantify the occurrence of consecutive "wickless" candles of the same trend (either bullish or bearish).
Key Features:
Wickless Candle Detection: It first identifies candles that lack an upper or lower wick (meaning their open/close is equal to their high/low, respectively).
Consecutive Streak Tracking: The indicator tracks how many wickless bullish candles occur in a row, and similarly for wickless bearish candles.
User-Defined Streak Length: You can specify a Streak Length in the indicator's settings. This defines how many consecutive wickless candles are needed to register a "streak."
Probability Calculation: For the chosen Streak Length, the indicator calculates the historical probability (as a percentage) of encountering such a streak for both bullish and bearish wickless candles. This is done by dividing the number of times a streak of that length has occurred by the total number of candles scanned.
On-Chart Display: The results, including the total wickless candles, total scanned candles, and the calculated streak probabilities, are displayed in a convenient table directly on your chart.
Purpose:
This indicator helps traders and analysts understand the historical likelihood of sustained, strong directional moves as indicated by consecutive wickless candles. By quantifying these probabilities, it can provide insights into potential continuation patterns or extreme market conditions, which might be useful for developing trading strategies or confirming market biases.

xGhozt Wickless Candles with TailSimple script showing candles missing an upper or lower wick. As candles tend to have a low and a high, they will most certainly form wicks. It is rare to have wickless candles on longer time frames, so it's more relevant on 1h and above.
Additionally, this indicator now visually tracks these 'missing wicks' as horizontal 'tails'. These tails extend from the wickless candle's extreme (low for bullish, high for bearish) and continue to stretch to the right until price action finally touches that level. Once touched, the tail disappears, signifying that the 'missing wick' has been filled or 'mitigated'.
What can you do about it?
If you see for example a Bitcoin 4h candle that hasn't formed two wicks yet, there are high chances that the missing wick will be formed at one point or another. The persistent horizontal tail vividly highlights these unmitigated levels, allowing you to identify potential price magnets. You could therefore consider taking a trade in the direction of the missing wick. You can set alerts on wickless candles if needed.
