KingJakesFx CRTThis TradingView indicator is a comprehensive tool that identifies and marks significant high and low points of Candle Range Type (CRT) candles. Its standout feature is the ability to visualize these key levels across multiple timeframes, allowing traders to maintain awareness of important price zones even when analyzing shorter timeframes.
The indicator extends high and low lines into the future, creating dynamic support and resistance levels that help anticipate potential price reactions. With extensive customization options, users can tailor the visual appearance of lines, labels, and alerts to match their trading setup and preferences.
Perfect for traders who analyze multiple timeframes and want to maintain awareness of significant price levels, this indicator combines powerful technical analysis with flexible visual customization to enhance any trading strategy.
Candlestick analysis

Reversal Knockout v1.1\ Reversal Knockout v1.1 — User Manual \
Reversal Knockout is a technical indicator designed to detect potential price turning points using a dual approach: a reversal logic with bar coloring and a combined sequence of setups, countdowns, and exhaustion patterns.
\ What does this indicator do?\
\ Colors candles\ based on the relationship between two smoothed moving averages (T3).
\ Identifies overextension conditions\ based on a sequence of 9 consecutive closes aligned with price direction.
\ Confirms exhaustion\ if, after that setup, 13 follow-through conditions (countdown) are met.
\ Highlights special signals called “Knockouts”\ , which represent strong potential reversal scenarios.
\ Candle Coloring\
Candles are automatically colored to make trend and potential reversal points visually easier to interpret:
🔵 Bull Trend: User-defined color (default light blue)
🔴 Bear Trend: User-defined color (default light red)
🟡 Bullish Reversal: When price crosses below the slower average (default yellow)
🟡 Bearish Reversal: When price crosses above the slower average (default yellow)
This logic is based on the relationship between two T3 moving averages (one fast, one slow), calculated with a customizable smoothing factor.
\ Setup and Countdown Logic\
Setups (9):
A bullish setup forms if the price closes below the close from 4 bars earlier for 9 consecutive candles.
A bearish setup forms if the price closes above the close from 4 bars earlier for 9 consecutive candles.
When the ninth close is completed, a green “9” (buy) or purple “9” (sell) is displayed.
Countdowns (13):
After a setup, a follow-through phase begins.
If 13 additional conditions are met (price < low\ for buys or > high\ for sells), a purple “13” is shown, signaling potential exhaustion.
\ Knockout: Explosive Reversal Potential\
The indicator also identifies special reversal patterns called \ Knockout\ .
These signals appear when, in addition to a “9”, the price shows technical excess behavior near key support or resistance zones:
Knockout ▲ (buy): Appears below the candle when a buy signal is detected with specific downside pressure conditions.
Knockout ▼ (sell): Appears above the candle when a sell signal is detected with upside pressure conditions.
These signals stand out as high-probability reversal opportunities.
\ Usage Recommendations\
The indicator is designed to work on any timeframe, but it is recommended to use it alongside market structure and volume analysis.
“Knockout” signals may be used as high-probability trend change alerts, especially after a “13”.
Can be combined with momentum indicators and moving averages for greater effectiveness.

Trend Table ZeeZeeMonMulti-Timeframe Trend Indicator
Overview
This indicator identifies trends across multiple higher timeframes and displays them in a widget on the right side of the chart. It serves as an alternative trend-filtering tool, helping traders align with the dominant market direction. Unlike traditional moving average-based trend detection (e.g., price above/below a 200 MA), this indicator assesses whether higher timeframes are genuinely trending by analyzing swing highs and lows.
Trend Definition
Uptrend: Higher highs and higher lows.
Downtrend: Lower highs and lower lows.
A trend reversal occurs when a prior high/low is breached (e.g., in a downtrend, breaking the last high signals an uptrend).
Customization Options
Lookback Period: Adjusts the sensitivity for identifying swing highs/lows (pivot points). A shorter lookback detects more frequent pivots.
Historical Pivot Visibility: Toggle to display past swing highs/lows for verification.
Support/Resistance Lines: Show dynamic levels from recent pivots on higher timeframes. Breaching these lines indicates potential trend changes.
Purpose
Helps traders:
Confirm higher timeframe trends before entering trades.
Monitor proximity to trend reversals.
Fine-tune pivot sensitivity for optimal trend detection.
Note: Works best as a supplementary trend filter alongside other trading strategies.

GapCluster SR For Intraday by Chaitu50c**GapCluster SR For Intraday by Chaitu50c**
**Overview**
GapCluster SR plots dynamic intraday support and resistance lines based on candle-to-candle gaps. Whenever an Open/Close or High/Low gap is detected, the script draws a horizontal level and “clusters” nearby gaps into a single line to keep your chart clean. Lines automatically color-code relative to price—green when below, red when above.
---
**Key Features**
* **Gap Detection Modes**: Choose between Open/Close gaps (default) or High/Low gaps.
* **Clustering**: Merge levels within a user-defined vertical range to avoid clutter.
* **Dynamic Coloring**: Levels below price turn green; levels above price turn red.
* **Session Reset**: Automatically removes levels older than X days.
* **Fully Customizable**: Adjust buffer, cluster range, line width, lookback period, and both above/below colors.
---
**Inputs**
| Input | Default | Description |
| ---------------------------- | :--------: | ------------------------------------------- |
| Gap Type | Open/Close | Select gap detection method |
| Price Buffer (points) | 5.0 | Maximum distance for gap matching |
| Cluster Range (points) | 100.0 | Vertical distance within which levels merge |
| Line Width | 2 | Thickness of plotted lines |
| Days to Include | 14 | Number of days to retain past levels |
| Color for Levels Above Price | red | Line color when level > current price |
| Color for Levels Below Price | green | Line color when level < current price |
---
**How to Use**
1. **Add to Chart**: Apply on any intraday timeframe (1 min, 5 min, etc.).
2. **Select Mode**: Pick Open/Close or High/Low in settings.
3. **Tweak Inputs**: Raise/lower buffer for tighter/looser gap detection; adjust cluster range to group levels; change lookback (“Days to Include”) to control session reset.
4. **Interpret Levels**:
* **Green Lines** mark potential support zones.
* **Red Lines** mark potential resistance zones.
5. **Combine with Your Strategy**: Use alongside volume, momentum, or trend filters for confirmation.
---
**Tips & Tricks**
* **Intraday Entries**: Look for price reaction at green (support) lines for long setups, or red (resistance) lines for shorts.
* **Filter Noise**: Increase the “Cluster Range” to consolidate many close levels into stronger, singular lines.
---
**Disclaimer**
This indicator is provided “as-is” for educational purposes only. Always backtest any setup and practice proper risk management.

Synapse Trade - Fair Value GapsNot your average FVG indicator. This FVG indicator allowed for overlapping, and invalidated FVGs to remain as the existence of Inversion Fair Value Gaps exists and, in my recent experience, has been incredibly useful finding new levels of support and resistance, even inside a currently FVG, the "invalidated" FVGs can still have an impact on price trend and react to it.
~edit: updated chart to be cleaner and include only the FVG indicator

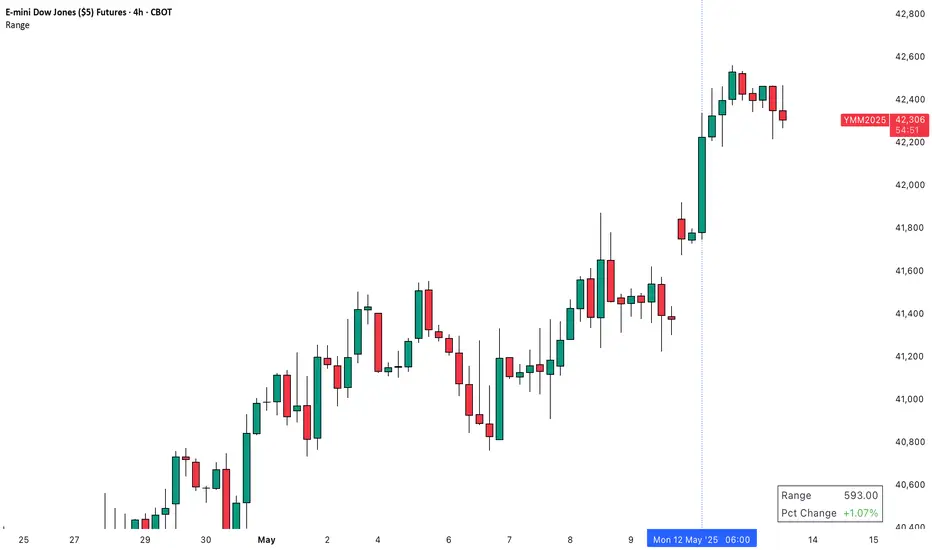
Range & Pct Change Table (Interactive)Indicator creates an interactive element that displays two key metrics for any selected candle:
1. Range - The difference between high and low prices (H-L)
2. Percentage Change - The percent change from open to close ((C-O)/O × 100)
Key Features
- Interactive Reference Point: Users can select any candle as a reference point using the time input
- Customizable Table: The table can be shown/hidden and positioned in different chart locations
This indicator is particularly useful for quickly analyzing the volatility (range) and directional movement (percentage change) of specific candles without having to manually calculate these values.
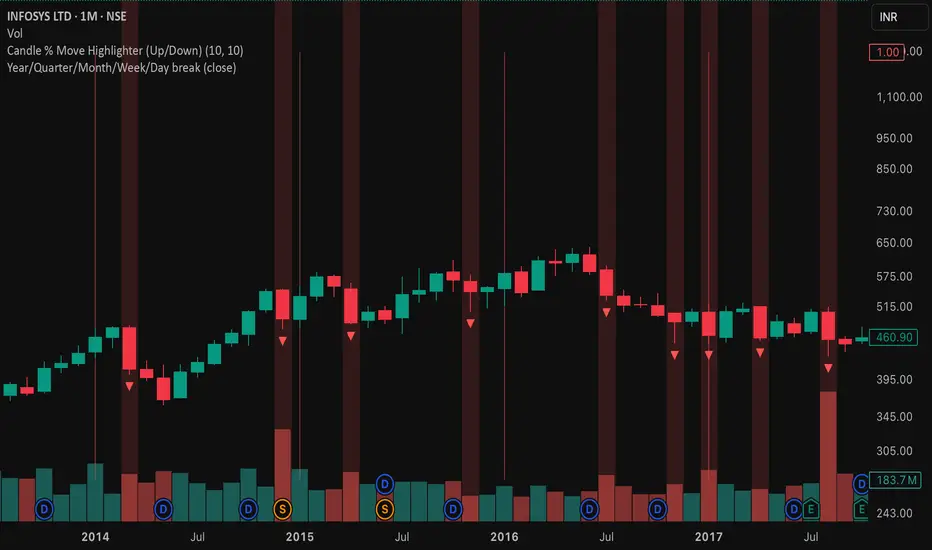
Candle % Move Highlighter (Up/Down)Candle % Move Highlighter (Up/Down with Labels)
This indicator highlights candles that move up or down by a specific percentage from their open price.
🔹 Key Features:
Highlight candles that move up or down by a user-defined %.
Set separate thresholds for up moves and down moves.
Choose to show only up, only down, or both types of candles.
Optional triangle markers above or below highlighted candles.
% Move labels shown directly on the chart above (or below) the candle.
💡 Use this to:
Spot strong momentum candles.
Identify breakout or breakdown moves.
Visually monitor extreme price movement days.
Customize thresholds and display options from the settings panel.
XAU/USD Scalping Bot [Jake-Style 1500+] FINALDescription:
This advanced scalping bot is engineered for XAU/USD using Jake-style visual overlays with predictive trade triggers, early entry signals, and multi-layer confirmation tools.
Key Features:
• EMA Cloud System with color-coded directional bias (5/13/21/55/144/377)
• PSAR Flip-Only Dots to highlight trend reversal moments without chart clutter
• Bollinger Band Zones to visualize volatility channels
• Predictive Entry Flags for early buy/sell signals before momentum candles (≥2 pip move)
• TRUE Candle Logic for confirmed trend-following entries
• Multi-Level TP/SL Lines with real-time alerts:
• TP1 / TP2 / TP3 with precise trigger logic
• Stop Loss hit detection
• Red Flag Warnings for exit caution during reversal zones (overbought TDI / failed breakouts)
Optimized For:
• 1m / 3m / 5m / 15m / 30m timeframes
• Scalping & intraday trading with high-precision entries
• Traders who prefer visual confirmation before committing to entries
Created by: @Livingstonedan
Powered by: ChatGPT x Jake-style automation logic

Sideways + Buy + Sell DetectionSure! Here's the plain-language description of your script without using any code.
---
### 📘 **Script Purpose**
This script is designed to detect three different types of market conditions:
1. **Sideways (range-bound) market** — useful for non-directional strategies like strangles or straddles.
2. **Bullish trend** — provides a signal to consider buying.
3. **Bearish trend** — provides a signal to consider selling.
---
### 🔧 **Indicators Used**
* **RSI (Relative Strength Index)**: Measures market momentum. It's used to determine whether the market is in a bullish, bearish, or neutral zone.
* **ADX (Average Directional Index)** along with **DI+ and DI-**: Measures the strength and direction of a trend.
* **MACD (Moving Average Convergence Divergence)**: Confirms momentum and trend direction based on moving averages.
---
### 🟪 **Sideways Market Signal**
A sideways (non-trending) signal is shown when:
* RSI indicates the market is neither overbought nor oversold (in the middle range).
* ADX shows weak trend strength.
* The ADX value is lower than both DI+ and DI-, suggesting indecision or lack of clear trend.
A purple label appears below the bar when this condition is met.
---
### 🟩 **Buy Signal**
A buy signal is generated when:
* RSI shows strong upward momentum.
* ADX confirms there is a strong trend.
* MACD confirms bullish conditions with both the MACD and signal lines above zero and in the correct crossover direction.
A green label appears below the bar when these bullish conditions align.
---
### 🟥 **Sell Signal**
A sell signal appears when:
* RSI shows strong downward momentum.
* ADX confirms a strong trend.
* MACD confirms bearish conditions, with both MACD and signal lines below zero and in the correct crossover direction.
A red label appears — currently also plotted below the bar (which you may want to move above the bar for better clarity).
---
### ✅ **Use Case**
This script is suitable for:
* Deciding when to deploy **strangle/straddle** strategies in sideways markets.
* Identifying strong **bullish or bearish trends** for directional trades.
* Filtering out weak or indecisive conditions.

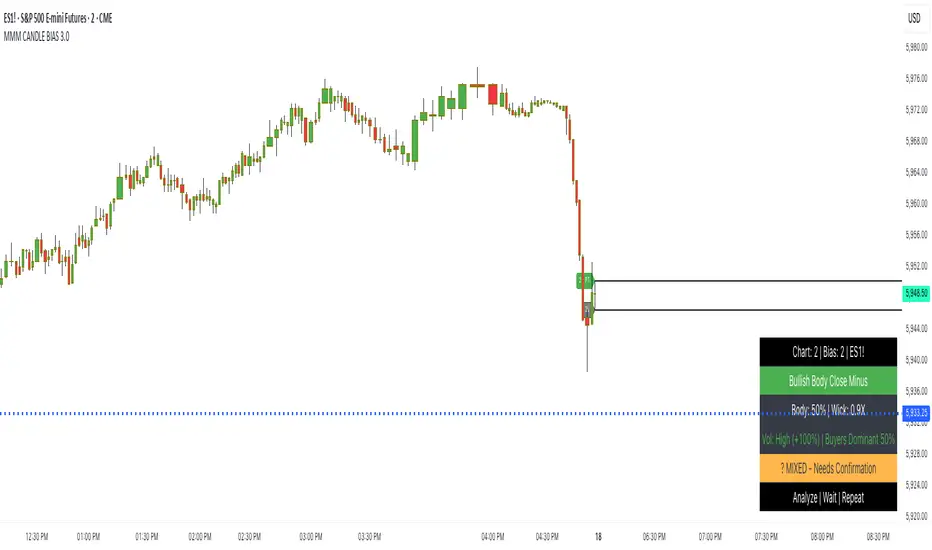
DAILY CANDLE PROFIT TARGET BIAS @MaxMaserati
Max Maserati Method for Candle Bias and effective price action Analysis
The MMM CANDLE BIAS 2.0 indicator, built on the proprietary Max Maserati Method, classifies candles to deliver clear, real-time market bias insights. It decodes price action, revealing institutional trading patterns often missed by retail traders.
The Six Core Candle Classifications: The Foundation of MMM Analysis
Master these six closing patterns, and you'll unlock the true language of price action. These are the building blocks of institutional trading behavior:
Bullish Body Close
Identification: Candle closes above the previous candle’s high.
Psychology: Strong buying pressure overcomes prior resistance.
Implication: Signals bullish trend continuation or reversal.
Bearish Body Close
Identification: Candle closes below the previous candle’s low.
Psychology: Intense selling pressure breaks past support.
Implication: Indicates bearish trend continuation or reversal.
Bullish Affinity
Identification: High tests or breaches previous low, but close stays within previous candle’s range.
Psychology: Buyers defend lower levels, rejecting downside.
Implication: Hidden bullish strength in consolidation.
Bearish Affinity
Identification: Low tests or breaches previous high, but close remains within previous candle’s range.
Psychology: Sellers cap upside attempts, gaining control.
Implication: Subtle bearish pressure despite failed breakout.
Seek & Destroy
Identification: Candle breaks both previous high and low, closing inside previous range.
Psychology: Institutions test liquidity on both sides before committing.
Implication: Direction depends on close—upper half (bullish affinity) or lower half (bearish affinity).
Close Inside
Identification: High and low stay within previous candle’s range.
Psychology: Consolidation with underlying directional bias.
Implication: Bias determined by close position relative to range.
Plus/Minus Strength System
Bullish Strength: Measures distance from low to close (buying pressure).
Bearish Strength: Measures distance from high to close (selling pressure).
Plus (+): Dominant strength significantly outweighs the other, indicating strong directional conviction.
Minus (-): Balanced strengths suggest a contested market, requiring caution.
Key Features
Automated Pattern Recognition: Instantly detects candle formations.
Color-Coded Bars: Green for bullish, red for bearish bias.
Dynamic Profit Targets: Projects targets based on higher timeframe high/low.
Real-Time Metrics: Displays bullish/bearish strength percentages and volume delta.
Customizable Table: Shows timeframe, symbol, bias, volume, and special note (“Analyze | Wait | Repeat”).
Bias Lines: Plots high/low lines on higher timeframe, with optional extension.
Labels: Customizable bias and profit target labels (Tiny, Small, Normal sizes).
Trading Advantages
Reveals institutional moves before retail traders react.
Detects reversals ahead of conventional indicators.
Enables precise entry timing with smart money.
Enhances risk management with clear strength signals.
Simplifies complex price action into actionable insights.
Profit Target Framework
Bullish Patterns: Target higher timeframe high.
Bearish Patterns: Target higher timeframe low.
Plus Strength: Expects direct move to target.
Minus Strength: Anticipates measured advance with potential pullbacks and/or violations.
Visual Implementation
Lines and Labels: High/low bias lines and profit target markers adapt to timeframe.
Table Display: Configurable position (top/middle/bottom, left/center/right) with key metrics.
Bar Coloring: Optional coloring based on bias or plus/minus strength.
Trader’s Mantra
"Analyze | Wait | Repeat" - Discipline turns market reading into consistent profits.
Elevate your trading with MMM CANDLE BIAS 2.0, where professional-grade analysis meets intuitive design.
Note: Based on the proprietary Max Maserati Method for educational and analytical use.
Candlestick High/Low Labels📌 Indicator Name:
Candlestick High/Low Labels
🧠 Author:
Precious Life Dynamics (@Precious_Life)
📋 Description:
The Candlestick High/Low Labels indicator highlights recent price extremes by placing labels above highs and below lows of previous candles.
Additionally, it displays a live OHLCV dashboard in the bottom-right corner, offering a quick overview of recent market data.
This tool is especially useful for:
Identifying support/resistance levels
Tracking candle behavior
Visualizing volume trends in context
⚙️ How It Works:
🔸 High/Low Labels:
Each of the most recent candles (based on Candle Lookback) is annotated as follows:
🔹 Red label above each candle’s high
🔹 Green label below each candle’s low
🔹 Price values are rounded (no decimals)
🔹 Labels are dynamically updated; old ones are removed
🔹 Label visibility can be toggled via the Show Labels input
🔸 OHLCV Dashboard:
A real-time data table appears in the bottom-right corner of the chart.
It displays the last N candles (based on Dashboard Lookback) with the following fields:
🔹 Candle Number (1 = most recent)
🔹 Open, High, Low, Close
🔹 Volume
🔹 Values are rounded for readability
🔹 White background with black text ensures high visual clarity
🔧 Customizable Inputs:
✅ Candle Lookback → Number of candles to label (default: 10)
✅ Show Labels → Toggle High/Low label display on/off
✅ Dashboard Lookback → Number of candles shown in the OHLCV table (default: 10)
🎯 Use Cases:
🔹 Identify recent price extremes and reaction zones
🔹 Spot dynamic support and resistance levels
🔹 Observe how candles behave at swing highs/lows
🔹 Monitor volume activity in relation to price
🔹 Use as a clean visual tool for scalping and intraday trading
📝 Notes:
🔹 This indicator is purely visual – it does not generate trade signals
🔹 Best suited for traders who value clear, real-time price structure feedback

Candle Wick Analysis🔍 What This Indicator Does
The Candle Wick Analysis indicator dynamically colors each candle body based on the comparative strength of its wicks and body, helping traders visually assess market sentiment, rejection zones, and momentum exhaustion with higher clarity.
This tool is especially useful for:
Price action traders
Scalpers
Reversal and trend continuation traders
Anyone who uses candlestick structure for confirmations
📊 How It Works
The indicator analyzes each candle and compares the percentage change of the upper wick, body, and lower wick relative to the opening price. Based on this relationship, it assigns a green or red color to the candle body to indicate likely price strength or weakness.
🧠 Logic Breakdown
✅ If the Candle is Bullish (close > open):
🔵 Green Candle Body: If the upper wick is smaller than the combined percentage size of the body + lower wick
→ Indicates strong bullish momentum with low upper rejection.
🔴 Red Candle Body: If the upper wick is larger than body + lower wick
→ Suggests potential exhaustion or rejection at the top.
✅ If the Candle is Bearish (close < open):
🔴 Red Candle Body: If the lower wick is smaller than the combined percentage size of the body + upper wick
→ Indicates strong bearish momentum with low lower support.
🟢 Green Candle Body: If the lower wick is larger than body + upper wick
→ Suggests potential downside rejection or support zone bounce.
⚪ Neutral Candles:
If the candle does not meet any specific wick/body criteria, it is displayed in gray to indicate neutrality or indecision (such as a doji).
🛠️ Technical Highlights
Built in Pine Script v5
Uses precise percentage-based wick/body comparison
Works on any timeframe and instrument
Minimalist coloring style: only the body color changes, while wicks stay gray
💡 Use Cases
Quickly spot exhaustion candles, where strong wicks may indicate a reversal or trap.
Validate trend strength: strong candles are colored green, weak ones red, even within bullish or bearish structures.
Filter entries and exits using visual confirmation of wick-to-body dynamics.
📌 Notes
This is a visual tool, not a buy/sell signal indicator.
Best used in conjunction with other forms of analysis (support/resistance, volume, moving averages, etc.)
Can be enhanced with alerts, filters (e.g., volume spikes), or labeling based on user feedback.

Balanced Price Range | Flux Charts💎 GENERAL OVERVIEW
Introducing our new Balanced Price Range (BPR) indicator! A Balanced Price Range is a trading concept used by price action traders. It is detected by finding overlapping area between two contrary Fair Value Gaps (FVGs). These areas can be used as entry points during market pullbacks. For more information about the process, please check the "HOW DOES IT WORK ?" section.
Balanced Price Range Features :
Balanced Price Range Detection : Identifies areas where bullish and bearish FVGs overlap, suggesting a zone of price equilibrium.
Customizable FVG & BPR Detection : You can fine-tune FVG detection and sensitivity for BPR detection to your liking.
Retest Labels : Bullish & Bearish retest labels will be rendered for BPRs.
Alerts : You can set alerts for Bullish & Bearish BPR detection and their retests.
🚩 UNIQUENESS
This indicator doesn't just detect standard FVGs but specifically looks for areas where bullish and bearish IFVGs (Invalidated Fair Value Gaps) overlap, defining a Balanced Price Range. It also actively manages and updates identified BPR zones, removing them when they are invalidated or remain untouched for a specified period. It highlights and alerts users to retests of established BPR zones, signaling potential trading opportunities. Users can tailor the appearance of the BPR zones and retest markers, as well as configure specific alerts for new BPR formations and retests.
📌 HOW DOES IT WORK ?
A Fair Value Gap generally occur when there is an imbalance in the market. They can be detected by specific formations within the chart. The indicator first detects bullish & bearish FVG zones according to their formations on chart. Then, they are dynamically tracked and flagged as invalidated if the price crosses them, turning them into IFVGs. When a FVG & IFVG of the same type overlaps, the indicator combines them into a single BPR of corresponding type. The detected BPR is updated as new data comes in, and renders retests labels as they occur. A bullish BPR can be used to find long trade entry opportunities, while a bearish BPR can be used to find short trade entry opportunities. Retests can also indicate potential movements in the corresponding direction of the BPR. Users can set-up alerts for BPR detection & BPR retests and will get notified as they occur.
⚙️ SETTINGS
Show Historic Zones: If enabled, invalidated or expired BPR zones will remain visible on the chart.
Balanced Price Range:
FVG Detection Method: Determines the criteria for the bar types forming the initial FVG.
Same: All three bars forming the FVG must be of the same type (all bullish or all bearish).
Mixed: The bar types must vary (a mix of bullish and bearish bars).
All: Bar types can vary or be the same.
FVG Invalidation Method: Determines which part of the candle (wick or close) invalidates the initial FVG.
BPR Invalidation Method: Determines which part of the candle (wick or close) invalidates the Balanced Price Range.
Sensitivity: Adjusts the sensitivity of FVG detection. Higher values may identify fewer, larger BPRs, while lower values may detect more, smaller BPRs.
Labels: Toggles the display of text labels on the identified zones.
Retests: Enables or disables the detection and visualization of BPR retests.

iFVG (BPR)
This indicator detects Fair Value Gaps (FVGs) and Inversion Zones (iFVGs) based concept from the ICT methodology.
An iFVG forms when a bullish and a bearish FVG overlap, creating a double imbalance zone. These are high-reaction points often targeted by smart money.
🔷 What It Detects
Bullish FVG: When the high of Candle 1 is lower than the low of Candle 3
Bearish FVG: When the low of Candle 1 is higher than the high of Candle 3
iFVG (or BPR): When a bullish and bearish FVG overlap, forming a double imbalance zone
🔷Mitigation Logic
An FVG or BPR becomes an iFVG when price closes against its original bias Once this happens, the zone is reclassified as a potential support or resistance (iFVG)
If price later mitigates the iFVG, all visual elements are automatically removed to keep the chart clean
🔷Visual Output
Standard FVGs: Customizable lines between Candle 1 and Candle 3
iFVGs (mitigated BPRs): Adjustable and highlighted rectangles to show the full zone
Mitigation Type: FVG or iFVG zones disappear when 50% of the zone is reached
🔷Custom Settings
Show Last Zones: Set how many recent zones to display on the chart (max 100)
Mitigation Type: Based on the percentage of zone coverage
Color & Style: Customize the appearance of FVG and iFVG zones
🔷 Use Case
This indicator is designed for real-time institutional analysis, helping traders identify:
Recent imbalances (FVGs)
Confluence zones (iFVGs = BPRs)
High-reaction points in the market
Ideal when combined with market structure, liquidity levels, and Kill Zones
Best used in combination with market structure, liquidity zones, and Kill Zone timing .

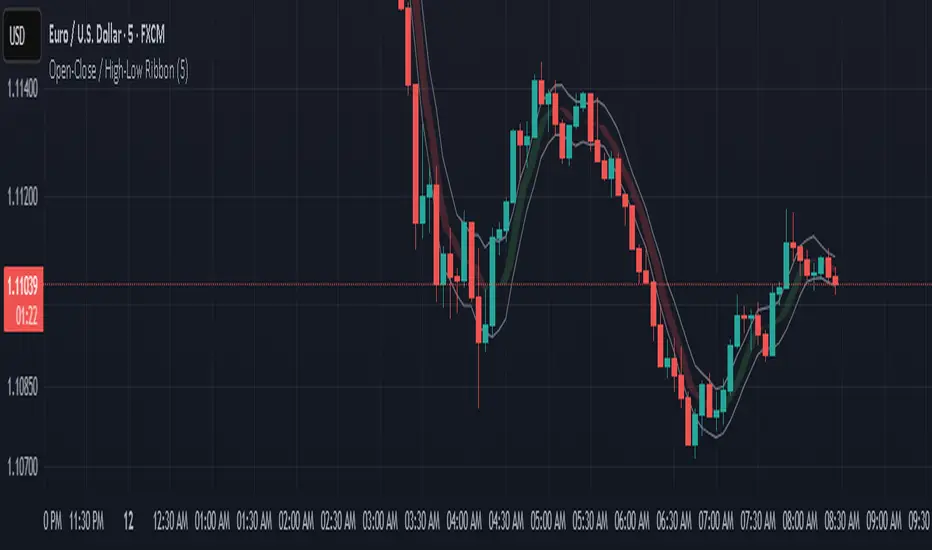
Open-Close / High-Low RibbonThis indicator visualizes smoothed Open, Close, High, and Low price levels as continuous lines, helping users observe underlying price structure with reduced noise. The Open and Close values are shaded to highlight bullish (green) or bearish (red) zones based on their relationship. Smoothing is applied using a simple moving average (SMA) over a user-defined length to make trends easier to interpret. This tool can be useful for identifying directional bias, trend shifts, or areas of support and resistance on any timeframe.
Spread/Range Oscillator + Signal + HistogramThe Spread/Range Oscillator is a technical analysis tool designed to assess market momentum by evaluating the relationship between price movement and volatility.
Calculation
Spread: The difference between the closing and opening prices of a candle (close - open).
Range: The difference between the high and low prices of a candle (high - low).
Oscillator: The spread divided by the range (spread / range). This ratio provides a normalized measure of price movement within each candle.
Smoothed Oscillator: An Exponential Moving Average (EMA) applied to the oscillator over a user-defined period (Smoothing Length) to reduce noise.
Signal Line: An EMA of the Smoothed Oscillator over another user-defined period (Signal Line Length) to identify potential trend changes.
Histogram: The difference between the Smoothed Oscillator and the Signal Line (Smoothed Oscillator - Signal Line). Positive values suggest bullish momentum, while negative values indicate bearish momentum.
Inputs
Smoothing Length (EMA): Determines the period for smoothing the oscillator.
Signal Line Length (EMA): Sets the period for the EMA applied to the Smoothed Oscillator to generate the Signal Line.
Visual Representation
Smoothed Oscillator: Plotted as a line representing the smoothed momentum of price movements.
Signal Line: Displayed as a line serving as a reference to identify potential crossovers and trend changes.
Histogram: Rendered as bars, with positive values indicating bullish momentum and negative values indicating bearish momentum.
Zero Line: A horizontal line at zero to distinguish between bullish and bearish territories.
Applications
Momentum Analysis: Identify periods of strong buying or selling pressure based on the oscillator's position relative to the zero line.
Trend Confirmation: Use crossovers between the Smoothed Oscillator and Signal Line to confirm potential trend reversals or continuations.
Divergence Detection: Spot divergences between price action and the oscillator to anticipate possible market turning points.
This indicator is open-source and intended for educational purposes. It is recommended to use it in conjunction with other forms of analysis and risk management practices before making trading decisions.

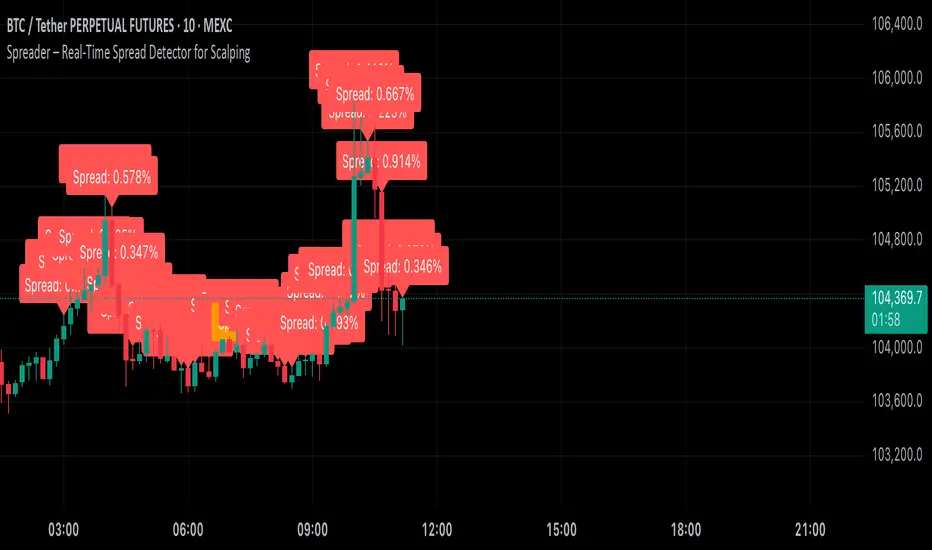
Spreader – Real-Time Spread Detector for ScalpingSpreader is a professional tool built for scalpers and intraday traders, designed to visually display live bid-ask spread on your chart. By showing you the true market friction in real time, it helps you avoid poor entries and reduce immediate trade losses.
Multi-Timeframe Engulfing Box, Malaysian SNRMulti-Timeframe Engulfing Box Indicator Documentation
Overview
The Multi-Timeframe Engulfing Box Indicator is a powerful tool for identifying and visualizing bullish and bearish engulfing patterns across multiple timeframes. It creates boxes that extend to the right, highlighting potential support and resistance zones created by these high-probability reversal patterns.
Key Features
Detects both bullish and bearish engulfing patterns
Supports analysis across three timeframes simultaneously (current chart timeframe plus two additional user-defined timeframes)
Displays visual boxes that extend to the right, making it easy to identify potential support and resistance areas
Option to mark failed engulfing patterns with dotted borders
Customizable box appearance with labels showing the timeframe
Configurable maximum number of displayed patterns per timeframe
Highlights bars with engulfing patterns using customizable colors
Input Parameters
General Settings
Label Position: Determines where the timeframe label appears within each box (Center, Top, Bottom, Top Left Corner, Top Right Corner, Bottom Left Corner, Bottom Right Corner)
Mark Failed Engulf: When enabled, the indicator will mark engulfing patterns that have failed by changing their border style to dotted
Current Timeframe Settings
Enable/Disable: Toggle detection of engulfing patterns on the current chart timeframe
Maximum Bull/Bear Patterns: Set how many bull and bear engulfing patterns to display on the current timeframe
Show Label: Option to display the timeframe label inside each box
Box Fill Style: Choose between "None" (transparent), "Solid", or "Semi-Transparent" box fills
Bull/Bear Colors: Customize the colors for bullish and bearish engulfing pattern boxes
Higher Timeframe Settings (TF1 and TF2)
For each of the two additional timeframes, you can configure:
Enable/Disable: Toggle detection of engulfing patterns on this timeframe
Timeframe Selection: Choose which higher timeframe to analyze (e.g., 4h, Daily)
Box Fill Style: Set the transparency of the boxes
Maximum Bull/Bear Patterns: Control how many patterns to display for this timeframe
Show Label: Option to display the timeframe label inside each box
Bull/Bear Colors: Customize the colors for the boxes
Trading Applications
The Multi-Timeframe Engulfing Box Indicator can be used to:
Identify potential reversal zones: Engulfing patterns often signal the end of a trend and the beginning of a reversal.
Spot multi-timeframe confluence: When engulfing patterns align across multiple timeframes, it increases the probability of a significant reversal.
Define support and resistance levels: The boxes extend to the right, creating visual support/resistance zones based on significant price action.
Filter false signals: By marking failed patterns, traders can avoid taking trades based on invalidated setups.
Enhance trade management: The boxes provide visual guidance for stop loss and take profit levels.
Best Practices
Focus on engulfing patterns that align across multiple timeframes for higher probability trades
Pay attention to the size of the engulfing candles - larger engulfing candles generally indicate stronger reversals
Use in conjunction with other indicators or price action analysis for confirmation
Consider the overall market context and trend when interpreting the signals
Filter signals by noting which patterns have failed (dotted border) vs. which remain valid

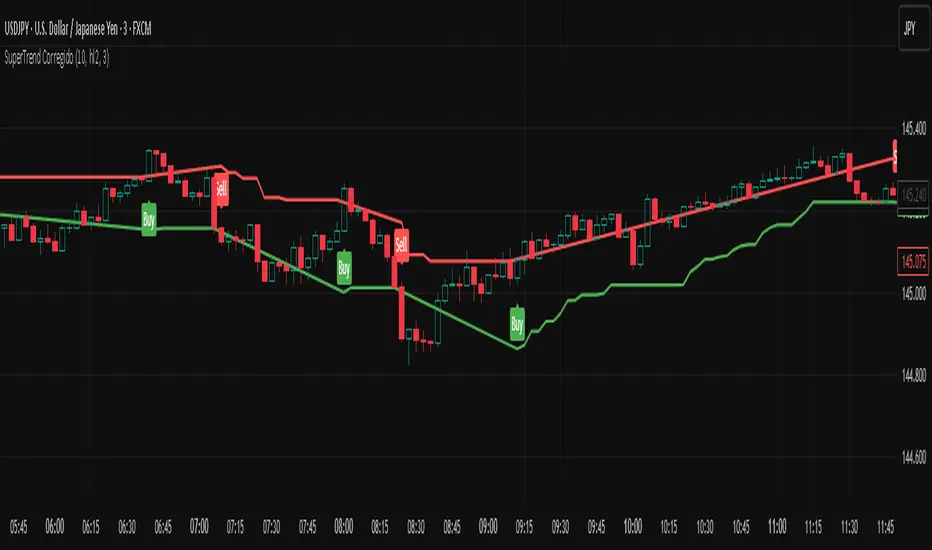
SuperTrend CorregidoThis script implements a SuperTrend indicator based on the Average True Range (ATR). It is designed to help traders identify trend direction and potential buy/sell opportunities with visual signals on the chart.
🔧 Key Features:
ATR-Based Trend Detection: Calculates trend shifts using the ATR and a user-defined multiplier.
Buy/Sell Signals: Displays "Buy" and "Sell" labels directly on the chart when the trend changes direction.
Visual Trend Lines: Plots green (uptrend) and red (downtrend) SuperTrend lines to highlight the current market bias.
Trend Highlighting: Optionally fills the background to emphasize whether the market is in an uptrend or downtrend.
Customizable Settings:
ATR period and multiplier
Option to switch ATR calculation method
Toggle for signal visibility and trend highlighting
🔔 Alerts Included:
SuperTrend Buy Signal
SuperTrend Sell Signal
SuperTrend Direction Change
This indicator is useful for identifying entries and exits based on trend momentum and can be used across various timeframes.
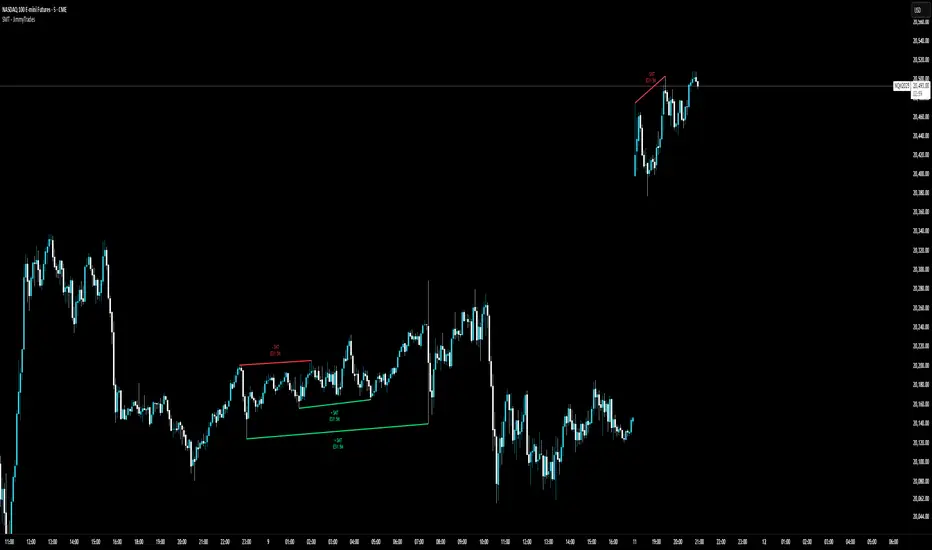
SMT - JimmyTrades🔧 SMT – JimmyTrades: Publication Rules and User Guide
📌 What This Script Does
This script detects Smart Money Traps (SMT) Divergences between the instrument on your chart and a comparative symbol (default: ES). It automatically plots both confirmed and unconfirmed bullish and bearish SMT setups across multiple timeframes.
These SMT divergences can help traders:
Identify potential reversal points
Confirm high-probability entries in line with smart money behavior
Enhance bias when confluence aligns with other market structure or liquidity factors
⚙️ Important Settings
Please make sure you correctly configure the following inputs:
Symbol: The comparative asset to check divergence against. Common examples: ES, NQ, SPX.
Session Type: Ensure this matches your chart’s session setting: Extended or Regular.
Adjustment Type: Match this to your chart (None, Dividends, or Splits) under TradingView’s chart settings (bottom-right corner).
Pivot Lookback: Controls the sensitivity of divergence detection (default is 15). Higher values reduce signal frequency.
Timeframes: You can enable up to six timeframes independently for SMT scanning.
🟢 Bullish SMT Signals
Bullish SMTs are identified when price on your chart makes a lower low, but the comparative symbol (e.g., ES) does not, suggesting potential accumulation or trap liquidity.
🔴 Bearish SMT Signals
Bearish SMTs are flagged when your chart makes a higher high, while the comparative symbol fails to do so, hinting at distribution or a stop run setup.
📈 How to Use This Script
Add the indicator to your chart.
Set the correct comparative symbol (e.g., ES for NQ, SPX for SPY, etc.).
Choose your preferred timeframes.
Watch for unconfirmed SMTs (dotted lines) as potential early warnings.
Look for confirmed SMTs (solid lines) once price respects the divergence zone for several bars.
Combine with structure, liquidity sweeps, killzones, and high-impact news for higher confluence.
🧠 Best Practices
Use SMT signals as part of a broader trade plan—not standalone entries.
Focus on SMTs forming after liquidity sweeps or during session opens (London/NY).
Combine with your higher-timeframe bias, breaker blocks, or Pegasus/Unicorn entry models.
⚠️ Limitations
Historical backtest may show perfect SMTs—real-time confirmation requires patience.
SMTs may not play out without proper context—avoid blindly entering based on signal alone.
This script is not financial advice—use at your own discretion and always manage risk.
MNQ-MES Hedge Protection Calculator by ATALLAMNQ-MES Hedge Protection Calculator - Summary
Purpose
This indicator provides real-time calculations for implementing a hedge strategy between MNQ (Micro E-mini Nasdaq-100) and MES (Micro E-mini S&P 500) futures contracts. It automatically determines the precise number of MES contracts needed to hedge a position in MNQ, based on current market prices and contract specifications.
Key Features
Real-time Hedge Ratio Calculation
Uses live market prices to calculate the optimal hedge ratio
Accounts for different point values ($2 for MNQ, $5 for MES)
Adjusts for beta differences between Nasdaq-100 and S&P 500
Flexible Position Management
Works for both long and short positions
Supports fractional contract amounts
Allows partial hedging (adjustable percentage)
User-Friendly Visual Interface
Clearly displays the exact number of MES contracts needed
Color-coded table showing position direction
Optional chart label with hedge summary
Practical Applications
Directional Risk Reduction: Maintain market exposure while reducing directional risk
Index Spread Trading: Capitalize on relative performance differences between indices
Portfolio Protection: Hedge existing positions in technology-heavy portfolios
Volatility Management: Reduce overall portfolio volatility while maintaining desired exposure
This indicator eliminates the complexity of manually calculating hedge ratios by providing instant, accurate, and visually clear instructions on how to implement an MNQ-MES hedge strategy based on current market conditions.

ICT-Elliott Hybrid Oscillator네이버 프리미엄 콘텐츠 > 재테크 사관학교 검색
This indicator uses Elliott Wave Theory and ICT (Inner Circle Trader) concepts to help easily and accurately predict when asset prices like cryptocurrencies or stocks will rise or fall.
📌 Easy Explanation of Terms
✅ What is Elliott Wave?
A theory stating that price movements follow a specific pattern (5 upward waves + 3 downward waves) repeatedly. Simply put, it's about repetitive cycles of rises and falls creating overall trends.
✅ What is ICT Theory?
A strategy that identifies optimal trading times by observing critical price areas traded by institutional investors (Order Blocks), imbalances in price (Fair Value Gaps - FVG), and major turning points (Break of Structure - BOS).
📈 Signals Provided by the Indicator
🔹 ① Pivot Highs & Lows
Red ▼: Short-term high (increased likelihood of price falling)
Green ▲: Short-term low (increased likelihood of price rising)
🔹 ② Fair Value Gap (FVG)
Green highlighted area: Zone where price is likely to rise again
Red highlighted area: Zone where price is likely to fall again
🔹 ③ Break of Structure (BOS)
Blue "BOS Up": Indicates a shift to an upward trend
Orange "BOS Down": Indicates a shift to a downward trend
⏳ Recommended Timeframe Combinations
| Major Trend (Basic Analysis) | Entry Point (Detailed Analysis) | Short-term Timing (Precision Analysis) |
| ---------------------------- | ------------------------------- | -------------------------------------- |
| 4-hour | 1-hour | 15-minute |
Use the 4-hour timeframe to gauge overall trends,
the 1-hour timeframe to pinpoint exact entry and exit points,
and the 15-minute timeframe for precise timing.
Include Source
🕯 Recommended Candle Patterns
* Pin Bar (Long wick candle) → Trend reversal signal
* Engulfing Candle (fully covering previous candle) → Strong trend reversal signal
* Hammer & Shooting Star (small body with a long wick) → Bullish or bearish reversal signal
* Doji (balance between buyers and sellers) → High potential for trend reversal

VWAP Predictive Breakout + RSI + OB + Trend/Chop📈 VWAP Predictive Breakout + RSI + Order Blocks + Trend/Chop Filter
This multi-layered day trading and scalping tool is designed to predict price direction after a VWAP breakout, rather than react to it. It combines volume, RSI, candlestick structure, order blocks, and trend/chop analysis to improve the accuracy of intraday signals.
🔍 Core Features
VWAP Predictive Breakout
Signals are generated when price breaks above/below VWAP with strength (volume spike + strong candle body), supported by trend confirmation.
RSI Momentum Filter
Uses RSI divergence behavior to validate breakouts, filtering out weak or exhausted moves.
Order Block Detection
Marks bullish and bearish engulfing patterns and checks for proximity to these zones as confirmation for breakouts.
Trend vs Chop Detection
Uses ADX, ATR, EMA distance, Bollinger Band width, and candlestick cleanliness to dynamically identify whether the market is trending or choppy.
Clean Candle Behavior
Filters out noisy or indecisive candles by analyzing wick-to-body ratio and ATR-based body size.
📌 Visual Markers
🟢 Buy Signal: Green triangle below bar
🔴 Sell Signal: Red triangle above bar
🟢⚪ Bullish Order Block: Green circle
🔴⚪ Bearish Order Block: Red circle
🟩 Trending Background: Light green
🟥 Choppy Background: Light red
🛎 Alerts Included
Long signal: VWAP breakout + RSI + Order Block + Clean Candle
Short signal: VWAP breakdown + RSI + Order Block + Clean Candle
🧠 Best Use Cases
Scalping high-probability VWAP reversals or continuations
Day trading in markets where trend clarity is critical
Filtering noise in sideways conditions using real-time chop detection
