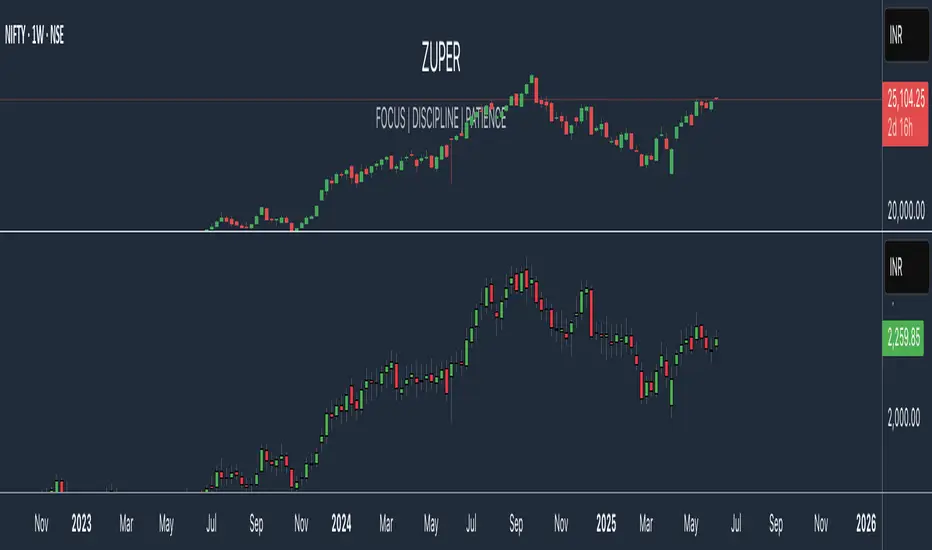
Zuper Custom Index (Up to 40 Stocks)Description:
This indicator empowers you to create your own custom index from up to 40 stocks, with full control over the weight of each component. Whether you want to track a sector, a basket of favourites, or build your own benchmark, this tool gives you the flexibility and visualisation you need—all directly on your TradingView chart.
Key Features:
Supports Up to 40 Stocks:
Combine up to 40 different symbols into a single, custom index.
Flexible Weighting:
Assign a custom percentage weight to each stock. The script automatically normalizes your weights to ensure the index always sums to 100%.
Candlestick or Line Chart Display:
Choose between a candlestick chart (showing open, high, low, close of the index) or a simple line chart (close only) for your custom index.
Dynamic Rebalancing:
Change weights or symbols at any time; the index recalculates instantly.
Easy Symbol Input:
Add or remove stocks with simple input fields—no code editing required.
Perfect for Sector Analysis & Custom Baskets:
Track sectors, strategies, or any group of assets you care about.
How to Use:
Add the Indicator to Your Chart.
Enter Up to 40 Stock Symbols in the input fields.
Assign Weights (as percentages) to each symbol.
If all weights are left at zero, the index will use equal weighting.
If you enter custom weights, they will be automatically normalized.
Choose Your Display Type:
Select between a candlestick or line chart for your index.
Analyze Your Custom Index!
Use Cases:
Build your own sector or thematic index.
Track a custom ETF or fund composition.
Compare your portfolio’s performance as a single chart.
Visualize the impact of different weightings on a basket of stocks.
Notes:
The indicator uses TradingView’s latest Pine Script version for maximum performance and flexibility.
You can use any valid TradingView symbol (stocks, ETFs, indices, etc.).
For best results, ensure all symbols are available on your selected timeframe and exchange.
Create, visualize, and analyze your own custom indices—right on your TradingView chart!
Candlestick analysis
Bullish & Bearish Three Line Strike ProHello Traders!
Overview
The **Bullish & Bearish Three Line Strike Pro** indicator pin-points one of the most decisive four-candle reversal formations on any market or timeframe. Whether you trade ranges or follow strong trends, this tool spots exhaustion and offers clear entry and exit guidance.
Key Features :
Precise pattern detection: Detects genuine Bullish and Bearish Three Line Strike setups, screening out look-alikes that fail to perform on the market.
Trend filter (optional): Aligns signals with a user-defined Simple Moving Average (SMA) so you can choose to trade only with, or deliberately against, the prevailing trend.
Visual clarity: Highlights Bullish and Bearish Three Line Strike patterns with customizable colors and shapes, making them easy to spot on the chart.
Filtered-signal display: Let the script reveal which patterns were rejected by the trend filter — an invaluable learning aid.
Bullish Three Line Strike
Three consecutive bearish candles that step lower.
The fourth candle opens below (or at) the last close, then charges upward engulfing all three prior bodies.
Bearish Three Line Strike
Three consecutive bullish candles that step higher.
The fourth candle opens above (or at) the last close, then plunges below engulfing all three prior bodies.
What makes this indicator unique
Precise pattern detection: Detects genuine Bullish and Bearish Three Line Strike setups, screening out look-alikes that fail to perform on the market.
Trend filter (optional): Aligns signals with a user-defined Simple Moving Average (SMA) so you can choose to trade only with, or deliberately against, the prevailing trend.
Visual clarity: Highlights Bullish and Bearish Three Line Strike patterns with customizable colors and shapes, making them easy to spot on the chart.
Filtered-signal display: Let the script reveal which patterns were rejected by the trend filter — an invaluable learning aid.
Nuanced candle analytics: Goes beyond simple price action by considering multiple factors such as candle body ratios, wick lengths, and relative positions to previous candles.
Adaptive learning mode: Display rejected setups to reverse-engineer the logic and refine your discretionary skills.
One-glance decision making: Unified color scheme and label styling make patterns pop, even on cluttered layouts.
How to Trade with this Indicator
Use Three Line Strike Pro to fade exhaustion or re-enter a trend after a healthy pull-back.
Bullish opportunities: Watch for light blue-colored strike candles as potential entry points.
Bearish opportunities: Look for orange-colored strike candles as potential entry points.
Entry: Open the position at the next bar’s open once the strike candle closes.
Stop-loss: 2 ticks beyond the extreme of the complete four-candle pattern.
Aggressive stop-loss: For exceptionally strong strike candles (tiny opposite wick, close near extreme) trail only 2 ticks beyond the strike candle itself.
Take-profit: Aim for 2R (3R for aggressive traders), or trail behind higher lows / lower highs.
Trend Alignment
For a conservative approach, enable "Use Trend Filter" and take only those strikes that agree with the SMA slope. The SMA line is color-coded—lime for up, red for down, yellow for flat—to help you confirm bias at a glance.
Tip: If you want the candle coloring to sit on top of all other studies, drag the indicator to the top of your Object Tree.

Multi-Timeline 1.0Multi-TimeLines 1.0 - Comprehensive Description
WHAT IT DOES:
This indicator creates dynamic horizontal support/resistance lines based on opening prices captured at user-defined New York times. Unlike static horizontal lines, these levels automatically appear and disappear based on sophisticated session logic, providing traders with time-sensitive reference levels that adapt to market sessions.
HOW IT WORKS - TECHNICAL IMPLEMENTATION:
1.
Timezone Conversion Engine:
The script uses Pine Script's "America/New_York" timezone functions to ensure all time calculations are based on NY time, regardless of the user's chart timezone. This eliminates confusion and provides consistent behavior across global markets.
2.
Dual-Category Time Classification System:
The indicator employs a unique two-category classification system:
Category A (16:00-23:59 NY): Evening times that extend overnight until next day 15:59 NY
Category B (00:00-15:59 NY): Day times that extend until same day 15:59 NY
This classification handles the complex logic of overnight sessions and prevents lines from incorrectly resetting at midnight for evening times.
3. Price Capture Mechanism:
Uses precise time-hit detection with backup systems for edge cases (especially midnight 00:00). When a specified time occurs, the script captures the bar's opening price and stores it in persistent variables using Pine Script's var declarations.
4. Session-Aware Display Logic:
Lines only appear during their designated "display windows" - periods when the captured price level is relevant. The script uses conditional plotting with plot.style_linebr to create clean breaks when lines are inactive.
5. Smart Reset System:
Different reset behaviors based on time classification:
Category A times persist across midnight (for overnight analysis)
Category B times reset on day changes (except 00:00 which captures AT day change)
Automatic cleanup when display windows close
ORIGINALITY & UNIQUE FEATURES:
1. Overnight Session Handling:
Unlike basic horizontal line tools, this script properly handles overnight spans for evening times, making it invaluable for analyzing gaps and overnight price action.
2. Automatic Session Management:
No manual line drawing required - the script automatically manages when lines appear/disappear based on NY market sessions (15:59 close, 18:00 after-hours start).
3. Time-Window Display Logic:
Lines only show during relevant periods, reducing chart clutter and focusing attention on currently active levels.
TRADING CONCEPTS & APPLICATIONS:
1. Session-Based Analysis:
Capture opening prices at key session times:
00:00 NY: Sydney/Asian session start
03:00 NY: London pre-market
08:00 NY: London session open
09:30 NY: NYSE opening bell
18:00 NY: After-hours start
2. Gap Analysis:
Evening times (20:00-23:59) that extend overnight are particularly useful for:
Identifying potential gap-fill levels
Tracking overnight high/low breaks
Setting reference points for next-day trading
3. Support/Resistance Framework:
Opening prices at significant times often act as:
Intraday support/resistance levels
Reference points for breakout/breakdown analysis
Pivot levels for mean reversion strategies
HOW TO USE:
1. Time Input:
Enter times in "HH:MM" format using 24-hour NY time:
"09:30" for NYSE open
"15:30" for late-day reference
"20:00" for evening level (extends overnight)
2. Line Behavior:
Blue/Green/Cyan/Red lines: Your custom times
Yellow line: After-hours day open (18:00 NY start)
Lines appear with breaks during inactive periods
3. Strategic Setup:
Use 2-3 key session times for your trading style
Combine morning times (immediate reference) with evening times (overnight analysis)
Toggle after-hours line based on your market focus
CALCULATION METHOD:
The script uses direct opening price capture (no smoothing or averaging) at precise time hits, ensuring the most accurate representation of actual market levels at specified times. This raw price approach maintains the integrity of actual market opening prices rather than manipulated or calculated values.
This method is particularly effective because opening prices at significant times often represent institutional order flow and can act as magnetic levels throughout subsequent sessions.

Multi-Timeframe Price Action AnalysisMulti-Timeframe Price Action Analysis
This indicator analyzes price action across multiple timeframes to determine bullish and bearish signals. It creates a dashboard showing how price interacts with previous candles' highs and lows.
Features
- Analyzes 4 customizable timeframes simultaneously
- Detects when price:
-- Grabs lows and comes back inside (bullish)
-- Grabs highs and comes back inside (bearish)
-- Grabs both highs and lows
-- Moves above previous high
-- Moves below previous low
-- Calculates bullish/bearish percentages for each timeframe
-- Visual dashboard with color-coded signals
Adjustable confirmation settings
-- Settings
-- Customize timeframes (default: 15min, 1H, 4H, D)
-- Toggle confirmation waiting
-- Set number of confirmation candles
This is a very rudimentary version.. I will make a more robust version soon
For it to be considered a "grab" the current price must be within the previous candle's range..
This also does not focus on candle closures just highs and lows
Also note that this is a little aggressive in that it does not require a bullish close for example to be considered bullish, a bearish close inside the previous candle is considered valid, this is to handle the morning stars that have a slightly bearish close in middle candle etc.. obviously do not rely on this indicator.. look at the price action and determine if you think its worth taking..
Same goes for bullish closes inside previous candle after grabbing highs..

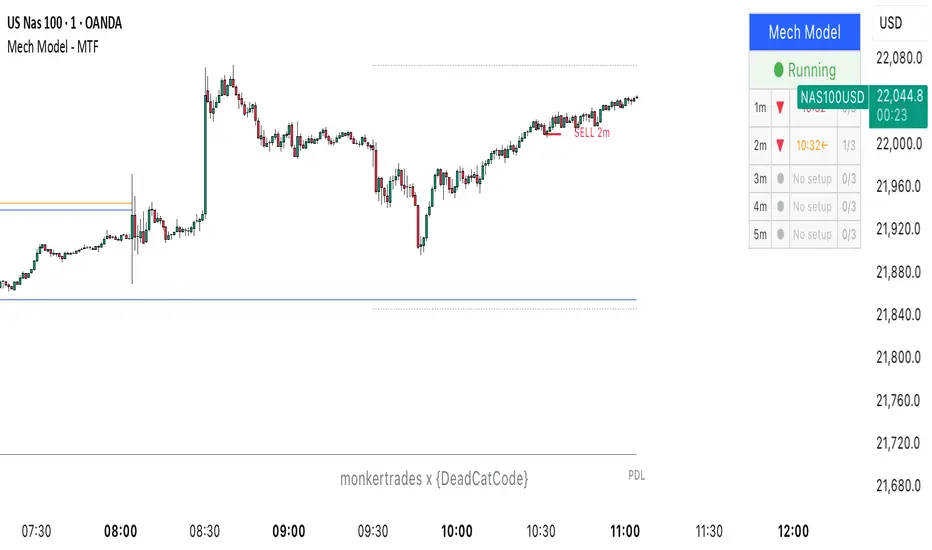
Mech Model - monkertrades x {DeadCatCode}Mech Model - Multi-Timeframe ICT Liquidity & iFVG Trading System
Detailed Methodology & Underlying Concepts
This indicator automates the Inner Circle Trader (ICT) methodology by identifying institutional order flow through liquidity sweeps and inverse Fair Value Gap (iFVG) formations across multiple timeframes.
Core Logic & Calculations
1. Liquidity Level Identification The script tracks four key liquidity pools:
NY session dynamic LQ detection everytime it sweeps high/low Calculates high/low from 18:00-09:30 EST
Session Extremes: Monitors Asia (20:00-23:00), London (02:00-05:00) session highs/lows
Previous Day Levels: Requests PDH/PDL using request.security() with daily timeframe
Dynamic Updates: Liquidity levels update in real-time when swept during NY session
2. Market Structure Analysis
Uses pivot points logic to understand HH.HL parameters
Classifies pivots as Higher Highs (HH), Higher Lows (HL), Lower Highs (LH), Lower Lows (LL)
Stores last 50 pivots for reference in custom PivotPoint type arrays, background calculations to identfy price legs after sweep
3. Fair Value Gap Detection
Bullish FVG: When low > high (gap between candles)
Bearish FVG: When high < low
Stores FVG data including top, bottom, direction, and bar index
Tracks "wicking" - when price touches but doesn't close through FVG
4. Price Leg Formation (Key Innovation) When liquidity is swept:
Bull Leg: Forms after low sweep, connects previous swing high to sweep point
Bear Leg: Forms after high sweep, connects previous swing low to sweep point
Leg remains "active" and extends with continued liquidity breaks
5. iFVG Signal Generation The signal fires when:
An active price leg exists (post-liquidity sweep)
An FVG within the leg range gets "closed through" (not just wicked)
This creates an inverse FVG (iFVG) - the key entry signal
Signal direction matches leg type (bull leg + bull iFVG = buy signal)
6. Multi-Timeframe Synchronization
Uses request.security() to run detection logic on 1m, 2m, 3m, 4m, 5m
All signals display on 1-minute chart via status table
How Traders Use This
Setup Phase: Script identifies when price sweeps overnight/session liquidity
Confirmation: Waits for FVG within the "price leg" to be violated
Entry Signal: iFVG formation provides precise entry point
Target: Typically the next unmitigated FVG on 5-minute timeframe
Key Parameters Users Can Adjust
Session times for different market hours
Visual elements (colors, transparency, line styles)
Timeframe selection (enable/disable 1m-5m)
Wick grace period (0-100 bars)
Signal display mode (triangles vs horizontal lines)
This script essentially automates the manual process ICT traders use to identify institutional footprints through liquidity raids and subsequent rebalancing via FVG mitigation.
Candle Ribbon [UkutaLabs]The Candle Ribbon is a powerful trading tool that creates a strong ribbon that indicates market strength. This ribbon is created using three moving averages that use the candle values (high, low, open and close) as its input values.
The center most MA will also be colored green, red or grey depending on whether or not its direction aligns with current market strength.
The outer band lines act as range indicators, plotted above and below the center ribbon, which represent volatility boundaries for price action.
█ USAGE
The Candle Ribbon is created using a series of three moving averages that uses values from the candle as its inputs. The user has the ability to select whether the moving averages are EMAs or SMAs, as well as the ability to control the period of the moving averages.
If the moving average calculated using the Candle Open is below the moving average calculated using the Candle Close, the ribbon will be colored green, indicating a bullish trend. If the moving average calculated using the Candle Open is above the moving average calculated using the Candle Open, the ribbon will be colored red, indicating a bearish trend.
This indicator also uses a series of hidden EMAs to determine market strength. If these EMAs do not align with the direction of the Candle Ribbon, the middle MA will instead be colored grey, indicating uncertainty in the market, as well as a possible reversal.
█ SETTINGS
Configuration
• Moving Average Type: Determines whether or not the Candle Moving Averages will be drawn as EMAs or SMAs.
• Moving Average Period: Determines the period of the Candle Moving Averages.
Moving Average
• Moving Average Input: Determines the input values for the hidden EMAs.

CHoCH + BOS Detector (con líneas)este indicador sirve para simplificar las entrada scalper en el oro

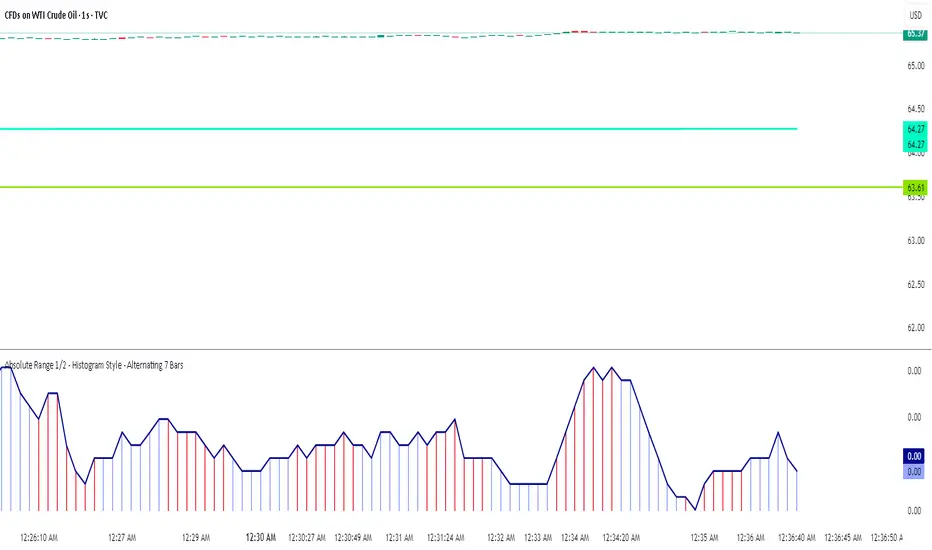
Absolute Range 1/2 - Histogram Style - Alternating 7 BarsAbsolute Range 1/2 - Histogram Style with Alternating 7-Bar Colors
This indicator calculates the 9-period simple moving average of the daily range (high minus low) and plots half of this value as a histogram and a line for easy visual tracking of range volatility.
To enhance readability, the histogram bars alternate colors every 7 bars — grouping the bars in blocks of seven with distinct colors. This makes it easier to observe range patterns and changes over time.
Features:
Smooths range data using SMA(9)
Plots half the average range as histogram bars and a line overlay
Alternates histogram bar colors every 7 bars dynamically
Clean, minimalistic design suitable for identifying volatility trends
Engulfing Candles (ATR-Based) with Volume SpikeOverview:
This script is designed to detect high-probability bullish and bearish engulfing patterns — but with a twist: it filters them through ATR-based volatility and confirms strength with volume spikes, all while offering optional trend filtering. It's built for traders who want more than just surface-level candle patterns — it's for those who want contextual confirmation before entering a trade.
What Makes It Different:
Most engulfing candle indicators simply match two candle shapes. This script goes deeper by:
Measuring candle body size relative to recent volatility (via ATR).
Checking for volume confirmation using a dynamic spike threshold.
Filtering based on trend context using SMA-based structure detection.
This tri-layered logic aims to avoid false positives and give traders cleaner, more actionable entries that align with momentum.
Core Concepts:
1. Trend Detection (Optional)
You can choose between two structural filters:
SMA50 only: Looks for price above or below the 50-period SMA to define trend direction.
SMA50 + SMA200 alignment: A stricter rule requiring both fast and slow SMAs to confirm a trend.
Or turn off trend filtering entirely (No detection).
This helps ensure engulfing setups appear in line with the broader trend, increasing the likelihood of continuation.
2. ATR-Filtered Candle Bodies
To eliminate noise:
A candle is only considered a valid engulfing candle if it has a body larger than 1.5× ATR(14).
The previous candle must be a small-bodied candle (less than 0.5× ATR), creating a clear visual engulfing structure.
This method dynamically adjusts for market volatility, so setups are meaningful even during periods of compression or expansion.
3. Volume Spike Confirmation
Not all engulfing candles lead to follow-through. That’s why this script includes a volume confirmation filter:
A 20-period moving average of volume is calculated.
A spike is flagged if the current bar’s volume exceeds 1.5× this average (adjustable).
Patterns with this confirmation are marked with a “*” label (e.g., BU* or BE*) to distinguish volume-backed setups from weaker ones.
Visuals & Alerts:
BU = Bullish engulfing without volume spike
BU* = Bullish engulfing with volume spike
BE = Bearish engulfing without volume spike
BE* = Bearish engulfing with volume spike
A white background highlight is shown behind candles with volume-confirmed engulfing patterns.
Alerts are available for BU* and BE* so you can automate your edge.
How to Use:
Add the indicator to any chart.
Choose your trend filter from the settings panel.
Watch for BU* and BE* labels — these are your highest-conviction signals.
Optional: Combine with support/resistance, Fibonacci zones, or MTF confirmation to refine entries.
Use the included alerts to receive real-time push/email notifications when patterns emerge.
Performance Note:
I’ve found this script to be fairly good when applied to the 1-hour charts of the companies in the US100. The combination of ATR-based filtering and volume confirmation appears to provide clear, high-quality setups with good follow-through potential.
By blending candle patterns, volatility filtering, volume confirmation, and trend context, this script aims to filter out weak signals and highlight the most statistically significant engulfing opportunities.

Flexible Reversal DetectorFlexible Reversal Detector
An advanced, fully customizable analytical tool designed to identify local trend reversal zones based on candlestick formations. Users have full control over all logic parameters, making it adaptable to different trading styles and preferences.
Key Features
Adjustable maximum pattern length (number of candles)
Customizable body size ratios for initial, middle, and final candles
Configurable minimum price movement (in %) required before a pattern is considered valid
Colored horizontal lines showing the full length of the pattern – helpful in identifying structure, potential support/resistance zones
Optional volume filter – the volume of the final candle is compared to a volume SMA; multiplier can be adjusted (e.g. 1 = equal to average, 0.8 = 80% of average)
Logic Overview
U Pattern
Each bearish candle is treated as a potential start of a reversal pattern.
Subsequent candles, if small enough and within defined thresholds, form the middle part of the structure.
When a bullish candle with a sufficiently large body appears, it is marked as the final candle of the pattern.
The pattern is considered valid if it was preceded by a defined percentage price drop and – optionally – if the volume condition was met.
∩ Pattern
Each bullish candle may act as the initial candle of a potential reversal pattern in the opposite direction.
Following smaller candles form the middle part, as long as they meet the defined criteria.
The appearance of a strong bearish candle marks the end of the formation.
If this pattern is preceded by a certain price increase (and optionally meets the volume filter), it is highlighted on the chart.
Note: On markets with low volatility or on lower timeframes, it is recommended to reduce the percentage thresholds for signal detection. For more dynamic price action or higher timeframes, consider increasing them accordingly.
Visualization
The final candle of the pattern is marked visually on the chart (depending on direction)
Colored horizontal lines indicate the full span of the pattern – from initial to final candle

Trendline Breakouts With Volume Strength [TradeDots]Trendline Breakouts With Volume Strength is an innovative indicator designed to identify potential market turning points using pivot-based trendline detection and volume confirmation. By merging dynamic trendline analysis with multi-tiered volume filters, this tool helps traders quickly spot breakouts or breakdowns that may signal significant shifts in price action.
📝 HOW IT WORKS
1. Pivot-Based Trendline Detection
The script automatically scans for recent pivot highs and lows over a user-defined lookback period.
When it finds higher pivot lows, it plots green uptrend lines; when it finds lower pivot highs, it plots red downtrend lines.
These dynamic lines update as new pivots form, providing continuously refreshed trend guidance.
2. Volume Ratio Analysis
A moving average of volume is compared against the current bar’s volume to calculate a ratio (e.g., 1.5×, 2×).
Higher ratios suggest above-average volume, often interpreted as stronger participation.
The script applies color-coded cues to highlight the intensity of volume surges.
3. Breakout & Breakdown Detection
Each trendline is monitored for a defined “break threshold,” which helps avoid minor penetrations that can trigger premature signals.
When price closes beyond a threshold below an uptrend line, the indicator labels it a “BREAKDOWN.” If it closes above a threshold on a downtrend line, it labels it a “BREAKOUT.”
Volume surges accompanying these breaks are highlighted with contextual emojis and distinct color gradients for quick visual reference.
4. Trend Direction Table
A small on-chart table provides a snapshot of the current market trend—Uptrend, Downtrend, or Sideways—based on a simple moving average slope and the number of active uptrend or downtrend lines.
This table also displays quick stats on how many lines are actively tracked, helping traders assess the broader market posture at a glance.
🛠️ HOW TO USE
1. Choose a Timeframe
This script works on multiple timeframes. Intraday traders can monitor minute or hourly charts for frequent pivot updates, while swing and position traders may prefer daily or weekly intervals to reduce noise.
2. Observe Trendlines & Labels
Watch for newly drawn green/red lines connecting pivots.
When you see a “BREAKOUT” or “BREAKDOWN” label, confirm whether volume was abnormally high based on the ratio or color-coded bars.
3. Consult the Trend Table
Use the table in the bottom-right corner to quickly check if the market is trending or range-bound.
Look at the count of active uptrend vs. downtrend lines to gauge broader sentiment.
4. Employ Additional Analysis
Combine these signals with other tools (e.g., candlestick patterns, oscillators, or fundamental analysis).
Validate potential breakouts using standard techniques like retests or support/resistance checks.
❗️LIMITATIONS
Delayed Pivots: Trendlines only adjust once new pivot highs or lows form, which can introduce a slight lag in highly volatile environments.
Choppy Markets: Rapid, back-and-forth price moves may produce conflicting trendline signals and frequent breakouts/breakdowns.
Volume Data Reliability: Gaps in volume data or unusual market conditions (holidays, low-liquidity sessions) can skew ratio readings.
RISK DISCLAIMER
Trading any financial instrument involves substantial risk, and this indicator does not guarantee profits or prevent losses. All signals and visual cues are for educational and informational purposes only; past performance does not assure future outcomes. You retain full responsibility for your trading decisions, including proper risk management, position sizing, and the use of additional confirmation methods. Always consider the possibility of losing some or all of your original investment.

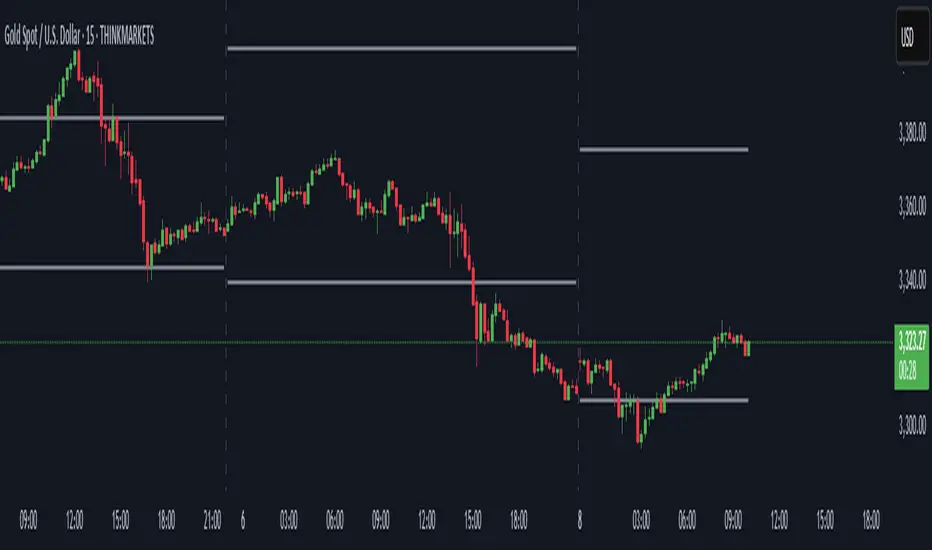
Previous Day High & Low)Previous Day High & Low (PDH/PDL)
This simple but essential tool plots the previous day's high and low as dynamic horizontal lines across the current trading session. Ideal for traders who rely on key support and resistance levels, this indicator automatically updates at the start of each new day and extends the levels across the chart.
🔹 Features:
Automatically tracks and draws the previous day’s high and low.
Lines update cleanly at each new session.
Helps identify breakout and reversal zones.
Perfect for scalpers, intraday traders, and anyone watching for reactions at key levels.
GStrategy 1000Pepe 15mTrend Following Candlestick Strategy with EMA Filter and Exit Delay
Strategy Concept
This strategy combines candlestick patterns with EMA trend filtering to identify high-probability trade entries, featuring:
Entry Signals: Hammer and Engulfing patterns confirmed by EMA trend
Trend Filter: Fast EMA (20) vs Slow EMA (50) crossover system
Risk Management: 5% stop-loss + 1% trailing stop
Smart Exit: 2-bar delay after exit signals to avoid whipsaws
Key Components
Trend Identification:
Uptrend: Fast EMA > Slow EMA AND rising
Downtrend: Fast EMA < Slow EMA AND falling
Entry Conditions:
pinescript
// Bullish Entry (Long)
longCondition = (Hammer OR Bullish Engulfing)
AND Uptrend
AND no existing position
// Bearish Entry (Short)
shortCondition = Bearish Engulfing
AND Downtrend
AND no existing position
Exit Mechanics:
Primary Exit: EMA crossover (Fast crosses Slow)
Delayed Execution: Waits 2 full candles after signal
Emergency Exits:
5% fixed stop-loss
1% trailing stop
Visual Dashboard:
Colored EMA lines (Blue=Fast, Red=Slow)
Annotated candlestick patterns
Background highlighting for signals
Distinct markers for entries/exits
Unique Features
Pattern Recognition:
Enhanced Hammer detection (strict body/wick ratios)
Multi-candle engulfing confirmation
Trend-Confirmation:
Requires price and EMA alignment
Filters counter-trend patterns
Exit Optimization:
pinescript
// Delay implementation
if exit_signal_triggered
counter := 2 // Start countdown
else if counter > 0
counter -= 1 // Decrement each bar
exit_trade = (counter == 1) // Execute on final bar
Risk Parameters
Parameter Value Description
Stop Loss 5% Fixed risk per trade
Trailing Stop 1% Locks in profits
Exit Delay 2 bars Reduces false exits
Position Size 100% No pyramiding
Visualization Examples
🟢 Green Triangle: Bullish entry
🔴 Red Triangle: Bearish entry
⬇️ Blue X: Long exit (after delay)
⬆️ Green X: Short exit (after delay)
🎯 Pattern Labels: Identifies hammer/engulfing
Recommended Use
Timeframes: 1H-4H (reduces noise)
Markets: Trend-prone assets (FX, indices)
Best Conditions: Strong trending markets
Avoid: Choppy/Ranging markets

Opening Range + Full-Day High/Low + Prev Day LevelsDraws a box around the first 15min range with horizontal lines extending throughout the day, with faded lines of the previous day's highs and lows, also draws arrows for 5m breakouts of those levels

DeltaStrike — Aggressive Candle Detector by Chaitu50cDeltaStrike — Aggressive Candle Detector
by Chaitu50c
DeltaStrike is a simple and effective tool designed to help traders identify the most aggressive candles on the chart in real time. It works purely on price action and internal candle dynamics, with no reliance on lagging indicators.
The indicator combines delta (directional strength), candle range, and volume to compute an overall aggressiveness score for each candle. When this score exceeds a dynamic threshold based on recent market behavior, the candle is marked as an aggressive move.
Aggressive bullish candles are plotted as green diamonds below the candle, while aggressive bearish candles are plotted as red diamonds above the candle. The goal is to help traders visually spot moments of strong directional pressure, where potential trends or reversals may emerge.
The detection logic adapts automatically to changing market volatility and volume, making it suitable for all instruments and timeframes, including index futures, equities, and forex.
An integrated dashboard on the chart displays live readings of the key components contributing to each candle’s aggressiveness score: delta ratio, range ratio, and volume ratio. This helps traders understand the internal structure of each aggressive move.
Features:
Dynamic aggressiveness detection based on delta, range, and volume
Adaptive threshold for consistent behavior across timeframes and instruments
Clean chart output with clear diamond markers only on selected candles
Live dashboard with internal metrics for advanced analysis
Simple, lightweight, and optimized for intraday and swing trading
Works with any instrument: index, equity, forex, commodity
DeltaStrike is intended as an objective visual aid to help traders focus on genuine moments of strong market intent, filtering out ordinary or passive price movement. It can be used standalone or in combination with your existing trading strategy.

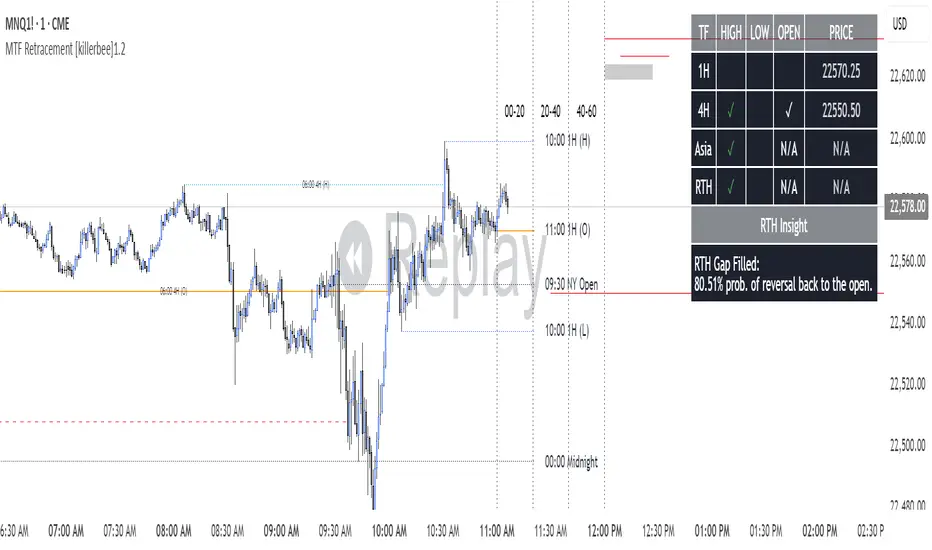
[killerbee] MTF RetracementKey Features
Multi-Timeframe (MTF) Analysis: Plot the high, low, and open from up to four user-defined higher timeframes. This allows you to see the bigger picture and identify key levels that institutional traders are watching.
Dynamic Support & Resistance: Lines are drawn at these key MTF levels and extend until price breaks through them, providing a clean and dynamic view of support and resistance.
Session Highlighting: Automatically draw boxes and high/low lines for the Asia, London, and RTH (Regular Trading Hours) sessions. This helps you understand the context of price action throughout the trading day.
Customizable Opening Price Lines: Pinpoint significant opening prices with dedicated lines for events like the "Midnight Open," "8:30 Open," and "9:30 Open."
"NQ STATS TABLE": A powerful statistical table that provides real-time insights:
Break/Hit Confirmation: Instantly see when a key MTF high/low has been broken or when an opening price has been retraced to.
9 AM Directional Bias: A bullish or bearish bias based on the close of the 9 AM (New York time) hourly candle.
Historical Probabilities: The table displays historical probabilities for price to either break a previous high/low or retrace to the open, based on the current hour of the trading session.
Extensive Customization: Nearly every visual aspect of the indicator can be customized to your preference, including colors, line styles, visibility of each component, and the position of the stats table.
How to Use
Identify Key Levels: The lines from the higher timeframes (HTF1, HTF2, etc.) represent significant support and resistance. Pay close attention to these levels as price approaches them.
Look for Breaks and Retracements:
When a high or low line is broken, the line will stop extending. This can signal a shift in market structure and a potential continuation in the direction of the break.
The "Open Line" for each timeframe represents the opening price. When the line stops extending, it means price has retraced back to that open, a common occurrence in the market.
Utilize the Sessions:
The Asia, London, and RTH boxes help you frame your trading day. The highs and lows of these sessions are often critical levels of support and resistance.
Breakouts from these session ranges can lead to strong directional moves.
Leverage the STATS TABLE:
Use the "Break" and "Hit" columns to quickly confirm when key levels have been breached or revisited.
The "Direction" row gives you a quick sentiment reading based on the 9 AM candle.
The "Trades Back %" and "High/Low Forms" provide a statistical edge by showing you the historical likelihood of certain price behaviors based on the time of day. This can help you decide whether to play for a breakout or a retracement.
Liquidity Engulfing (Nephew_Sam_)🔥 Liquidity Engulfing Multi-Timeframe Detector
This indicator finds engulfing bars which have swept liquidity from its previous candle. You can use it across 6 timeframes with fibonacci entries.
⚡ Key Features
6 Customizable Timeframes - Complete market structure analysis
Smart Liquidity Detection - Finds patterns that sweep liquidity then reverse
Real-Time Status Table - Confirmed vs unconfirmed patterns with color coding
Fibonacci Integration - 5 customizable fib levels for precise entries
HTF → LTF Strategy - Spot reversals on higher timeframes, enter on lower timeframe fibs
📈 Engulfing Rules
Bullish: Current candle bullish + previous bearish + current low < previous low + current close > previous open
Bearish: Current candle bearish + previous bullish + current high > previous high + current close < previous open

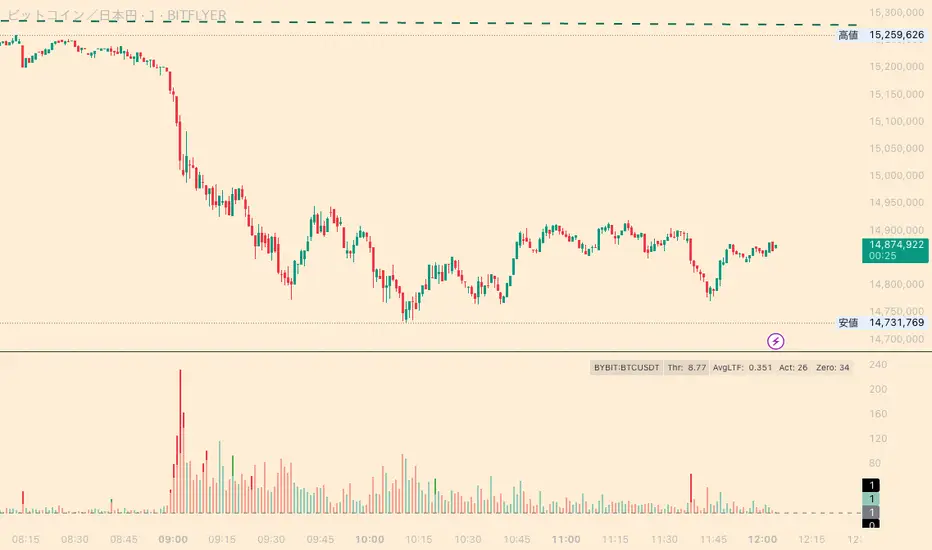
Whale Activity Classic[nakano]## Whale Activity Classic
### Uncover the Hidden Intent of Volume
The **Whale Activity Classic ** indicator provides an unparalleled view into the nuanced volume dynamics within each candlestick. By analyzing sub-timeframe volume, it visually separates significant **large investor** activity from typical "Noise" volume, helping you understand the true forces driving price action.
This tool is designed to reveal the otherwise invisible movements of **large investors** and gauge overall market participation, giving you a deeper understanding than standard volume bars alone.
---
### Key Features:
* **Multi-Layered Volume Bars:**
* **Large Investor Volume (Densely Colored Bars):** Represents the aggregated volume from sub-timeframe candles where individual volume exceeded your defined threshold. Green indicates buying pressure (positive), and red indicates selling pressure (negative).
* **Normal Volume (Lightly Colored Bars):** Shows the total volume from sub-timeframe trades that fell *below* the threshold. This provides context about general market participation.
* **Comprehensive Customization:**
* **Symbol Selection:** Analyze the current chart's symbol or specify any custom symbol (e.g., crypto, stocks, forex) for in-depth analysis.
* **Lower Timeframe Analysis:** Choose your desired granularity from 1-second, 5-second, 10-second, 30-second, 1-minute, 5-minute, or 15-minute sub-timeframes.
* **Volume Thresholding:** Opt for a `Manual` fixed threshold or an `Automatic` calculation that adapts to current market conditions.
* **Noise Volume Visibility:** Toggle the display of "Normal Volume" bars to focus on **large investor** activity or view the complete picture.
* **Extensive Color Settings:** Customize the colors and transparency for all four volume types (**large investor** Positive/Negative, Normal Positive/Negative) to match your visual preferences.
---
### How to Use & Interpretation Tips:
* **Understanding Auto-Calculated Thresholds:** When `Automatic` calculation is selected, hover your cursor over any bar. The exact "Current Threshold" applied to that bar will be displayed in the status line at the top-left of the indicator panel.
* **Spotting Large Investor Intent:**
* If **Large Investor Volume (green/red bars)** is prominent while **Normal Volume (lightly colored bars)** is small, it suggests a sudden, significant move by a **large investor**, potentially against the prevailing retail sentiment.
* Conversely, if both **Large Investor Volume** and Normal Volume are large, it indicates strong trend momentum, drawing in both large institutions and retail participants.
* **Measuring Trend Strength:** Combined large **Large Investor Volume** and Normal Volume bars signify a robust trend with broad market participation.
* **Default Settings:** The automatic threshold's default settings (Period: 100, Multiplier: 25) are balanced for broad market application. However, we recommend adjusting these values to optimize performance for your specific asset and trading style.
---
### Important Notes:
* Analyzing longer chart timeframes (e.g., 1-hour, daily) with very low sub-timeframes may process a large amount of data, potentially affecting performance or causing errors. Using this indicator on **minute timeframes** is recommended.
* Always ensure your `Analysis Timeframe (Lower)` is **shorter** than your main chart's timeframe.
* Access to second-based timeframes (1S, 5S, etc.) requires a paid TradingView plan.
---
---
### 出来高の隠れた意図を解き明かす
**Whale Activity Classic ** インジケーターは、各ローソク足内で展開される微細な出来高の力関係を、かつてないほど詳細に可視化します。より短い時間足の出来高を分析することで、重要な**大口投資家**の活動と、一般的な「通常出来高(ノイズ)」を視覚的に分離し、値動きを動かす真の力を理解する手助けをします。
このツールは、通常の出来高バーでは見えない**大口投資家**の動きと、市場全体の参加状況を同時に把握するために設計されており、標準的な出来高表示だけでは得られない深い洞察を提供します。
---
### 主な機能:
* **多層的な出来高バー:**
* **大口投資家出来高(濃い色のバー):** 指定した閾値を超えた、より短い時間足の個々の出来高を合計したものです。緑色は買い圧力(プラス方向)、赤色は売り圧力(マイナス方向)を示します。
* **通常出来高(薄い色のバー):** 閾値に満たなかった取引の合計出来高を示します。これにより、一般的な市場参加の状況を把握できます。
* **包括的なカスタマイズ性:**
* **銘柄選択:** 現在のチャートの銘柄を分析することも、暗号資産、株式、FXなど、任意のカスタム銘柄を指定して詳細な分析を行うこともできます。
* **分析する時間足 (下位):** 1秒、5秒、10秒、30秒、1分、5分、15分から、分析の粒度を選択できます。
* **出来高の閾値:** 固定値を設定する「手動」モードと、現在の市場状況に適応する「自動」計算モードを選択できます。
* **通常出来高の表示:** チェックボックスで「通常出来高」バーの表示/非表示を切り替え、**大口投資家**の活動に焦点を当てるか、全体像を見るかを選択できます。
* **詳細なカラー設定:** 4種類の出来高タイプ(**大口投資家**プラス/マイナス、通常プラス/マイナス)すべての色と透明度を自由にカスタマイズできます。
---
### 使い方と分析のヒント:
* **自動計算された閾値の確認方法:** 「自動」計算を選択した場合、任意のバーにカーソルを合わせると、インジケーターパネルの左上にあるステータスラインに、そのバーに適用された正確な「現在の計算閾値」が表示されます。
* **大口投資家の意図を読み解く:**
* **大口投資家出来高(緑/赤のバー)が際立っている一方で、通常出来高(薄い色のバー)が小さい場合**、それは一般的な小売りのセンチメントとは異なる、**大口投資家**による突然の重要な動きを示唆している可能性があります。
* 逆に、**大口投資家出来高**と通常出来高の両方が大きい場合、それは大規模な機関投資家と個人投資家の両方を巻き込んだ、強いトレンドが発生していることを示します。
* **トレンドの勢いを測る:** **大口投資家出来高**と通常出来高のバーの両方が大きい場合、それは活発な市場参加を伴う、堅調なトレンドを示します。
* **デフォルト設定について:** 自動閾値のデフォルト設定(期間:100、倍率:25)は、幅広い市場に適用できるようバランスが取れています。ただし、ご自身の分析対象となる資産や取引スタイルに合わせて、これらの値を調整することをお勧めします。
---
### 重要な注意事項:
* メインチャートの時間足を長く(例:1時間足、日足)しすぎると、非常に細かい下位の時間足で大量のデータを処理することになり、パフォーマンスが低下したり、エラーが発生する可能性があります。このインジケーターは**分足での使用を推奨**します。
* 「分析する時間足 (下位)」は、必ずメインチャートの時間足より**短いもの**を選択してください。
* 秒足(1S、5Sなど)での分析には、TradingViewの有料プランへの加入が必要です。
---
Candle Close Location MarkerThis script customizes the appearance of candlesticks by highlighting whether the candle closed in the upper, middle, or lower part of its range — using a small orange marker inside each candle.
It also includes a traditional volume histogram with two simple moving averages (SMA 20 and SMA 50), helping traders detect volume trends and potential reversals.
📌 Useful for identifying strength of momentum and visualizing market sentiment clearly.
Features:
• ✅ Colored candles: green for bullish, black for bearish
• ✅ Orange square shows the position of the close (top, middle, or bottom of the candle)
• ✅ Volume bars with SMA 20 (orange) and SMA 50 (blue)
• ✅ Works on all timeframes
Developed by:
Version: 1.0
Language: Pine Script v5
Smart Bar Counter with Alerts🚀 Smart Bar Counter with Alerts 🚀
-----------------------------------------------------
Overview
-----------------------------------------------------
Ever wanted to count a specific number of bars from a key point on your chart—such as after a Break of Structure (BOS), the start of a new trading session, or from any point of interest— without having to stare at the screen?
This "Smart Bar Counter" indicator was created to solve this exact problem. It's a simple yet powerful tool that allows you to define a custom "Start Point" and a "Target Bar Count." Once the target count is reached, it can trigger an Alert to notify you immediately.
-----------------------------------------------------
Key Features
-----------------------------------------------------
• Manual Start Point: Precisely select the date and time from which you want the count to begin, offering maximum flexibility in your analysis.
• Custom Bar Target: Define exactly how many bars you want to count, whether it's 50, 100, or 200 bars.
• On-Chart Display: A running count is displayed on each bar after the start time, allowing you to visually track the progress.
• Automatic Alerts: Set up alerts to be notified via TradingView's various channels (pop-up, mobile app, email) once the target count is reached.
-----------------------------------------------------
How to Use
-----------------------------------------------------
1. Add this indicator to your chart.
2. Go to the indicator's Settings (Gear Icon ⚙️).
- Select Start Time: Set the date and time you wish to begin counting.
- Number of Bars to Count: Input your target number.
3. Set up the Alert ( Very Important! ).
- Right-click on the chart > Select " Add alert ."
- In the " Condition " dropdown, select this indicator: Smart Bar Counter with Alerts .
- In the next dropdown, choose the available alert condition.
- Set " Options " to Once Per Bar Close .
- Choose your desired notification methods under " Alert Actions ."
- Click " Create ."
-----------------------------------------------------
Use Cases
-----------------------------------------------------
• Post-Event Analysis: Count bars after a key event like a Break of Structure (BOS) or Change of Character (CHoCH) to observe subsequent price action.
• Time-based Analysis: Use it to count bars after a market open for a specific session (e.g., London, New York).
• Strategy Backtesting: Useful for testing trading rules that are based on time or a specific number of bars.
-----------------------------------------------------
Final Words
-----------------------------------------------------
Hope you find this indicator useful for your analysis and trading strategies! Feel free to leave comments or suggestions below.

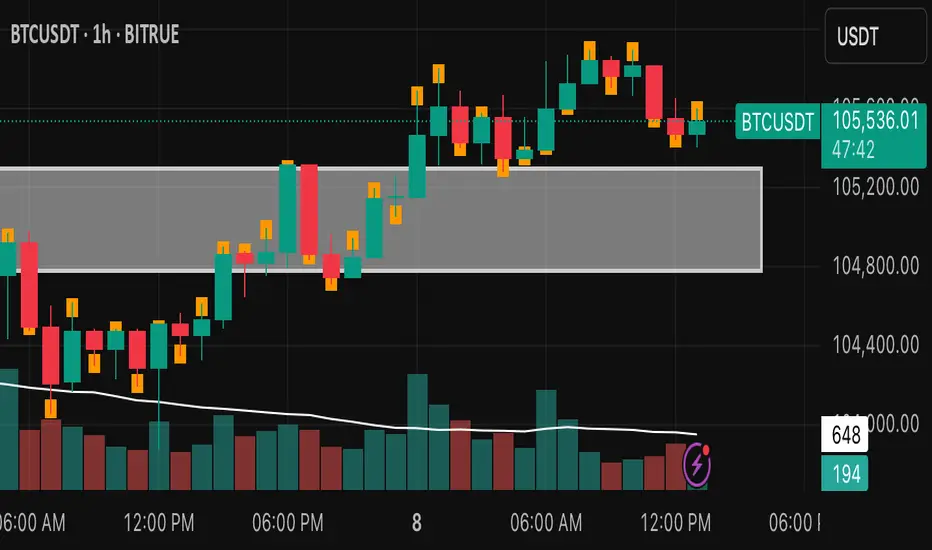
Power of Three FractalsIntroducing Power of Three Fractals—an advanced, all-in-one TradingView toolkit designed to bring higher timeframe context directly onto your primary chart. This isn't just another candle overlay; it's a sophisticated analytical suite built for the serious price action trader. Developed with the core principles of "smart money" concepts, this indicator helps you see the market in a new dimension.
Key Features:
Floating Candlestick Display:
Forget cluttered chart backgrounds. Power of Three Fractals displays your chosen higher timeframe candles as a clean, stylized series of candlesticks in a dedicated space on the right side of your chart, allowing you to analyze HTF structure without losing focus on live price action.
Intelligent Adaptive Timeframe:
This is a game-changer. If you set the indicator to show 4H candles but switch your main chart to the Daily, it won't produce an error. Instead, it automatically adapts, recognizing the invalid selection and seamlessly switching to display the next logical timeframe (e.g., Weekly candles). This provides a flawless analytical experience as you move through timeframes.
Precision High/Low Anchors:
Dotted Lines: Instantly see which lower timeframe (LTF) candle created the high and low of the current HTF candle. This is perfect for visualizing manipulation wicks and the true Power of Three delivery.
Solid Lines: Automatically identify the absolute highest high and lowest low across the entire displayed range of HTF candles. The script then draws a solid line back to the exact LTF candle that formed these critical points, defining your true trading range. This feature intelligently hides itself if the current candle is making the high/low to avoid unnecessary clutter.
Automated Liquidity Sweep Detection:
This powerful, built-in algorithm automatically identifies one of the most critical price action events: a liquidity sweep. When a newer HTF candle takes the low of the oldest displayed candle and then closes back above it, the indicator instantly alerts you.
It draws a dashed line from the initial low to the end of the range and places a bold 'x' marker below the specific candle that performed the sweep, giving you a clear, unmissable signal of this key market event.
Integrated HTF Countdown Timer:
Stay perfectly in sync with the market. A clean, floating timer in the bottom-right corner displays a live countdown to the close of your selected higher timeframe candle, complete with a header so you always know which timeframe you're tracking.
Fully Customizable Aesthetics:
Tailor the indicator to your personal chart theme. You have full control over the colors of bullish/bearish candles, wicks, and all connecting lines, allowing for a seamless visual integration.
Who Is This Indicator For?
The Power of Three Fractals indicator is built for the discerning trader who understands that context is key. It is ideal for:
Day Traders & Scalpers needing constant awareness of higher timeframe control.
Swing Traders looking to time entries based on HTF structure and LTF shifts.
Price Action & "Smart Money Concept" Traders who utilize concepts like liquidity sweeps, order blocks, and fractals.
What You Get:
Access to the Power of Three Fractals indicator on TradingView.
All future updates, bug fixes, and feature enhancements.
Stop trading in the dark. Elevate your analysis, gain a critical edge, and make more informed trading decisions with the Power of Three Fractals indicator.
Disclaimer: The Power of Three Fractals is an analytical tool and should not be considered financial advice or a signal service. All trading involves risk, and past performance is not indicative of future results. Please use this tool as part of a comprehensive trading plan with proper risk management.

Candle Body Strength CounterThis indicator measures the total bullish and bearish candle body strength over a user-defined lookback period. For each bar, it sums the absolute body sizes of bullish candles (where close > open) and bearish candles (where close < open) within the lookback window. The result is two lines: one for bullish body strength and one for bearish body strength, making it easy to spot shifts in market momentum and bias.
Adjustable lookback period (default: 20 bars)
Green line: cumulative bullish body strength
Red line: cumulative bearish body strength
Use this tool to quickly assess which side (bulls or bears) has been stronger over your chosen timeframe.

Math by Thomas Liquidity PoolDescription
Math by Thomas Liquidity Pool is a TradingView indicator designed to visually identify potential liquidity pools on the chart by detecting areas where price forms clusters of equal highs or equal lows.
Bullish Liquidity Pools (Green Boxes): Marked below price where two adjacent candles have similar lows within a specified difference, indicating potential demand zones or stop loss clusters below support.
Bearish Liquidity Pools (Red Boxes): Marked above price where two adjacent candles have similar highs within the difference threshold, indicating potential supply zones or stop loss clusters above resistance.
This tool helps traders spot areas where smart money might hunt stop losses or where price is likely to react, providing valuable insight for trade entries, exits, and risk management.
Features:
Adjustable box height (vertical range) in points.
Adjustable maximum difference threshold between candle highs/lows to consider them equal.
Boxes automatically extend forward for visibility and delete when price sweeps through or after a defined lifetime.
Separate visual zones for bullish and bearish liquidity with customizable colors.
How to Use
Add the Indicator to your chart (preferably on instruments like Nifty where point-based thresholds are meaningful).
Adjust Inputs:
Box Height: Set the vertical size of the liquidity zones (default 15 points).
Max Difference Between Highs/Lows: Set the max price difference to consider two candle highs or lows as “equal” (default 10 points).
Box Lifetime: How many bars the box stays visible if not swept (default 120 bars).
Interpret Boxes:
Green Boxes (Bullish Liquidity Pools): Areas of potential demand and stop loss clusters below price. Watch for price bounces or accumulation near these zones.
Red Boxes (Bearish Liquidity Pools): Areas of potential supply and stop loss clusters above price. Watch for price rejections or distribution near these zones.
Trading Strategy Tips:
Use these zones to anticipate where stop loss hunting or liquidity sweeps may occur.
Combine with your Order Block, Fair Value Gap, and Market Structure tools for higher probability setups.
Manage risk by avoiding entries into price regions just before large liquidity pools get swept.
Automatic Cleanup:
Boxes delete automatically once price breaks above (for bearish zones) or below (for bullish zones) the zone or after the set lifetime.
