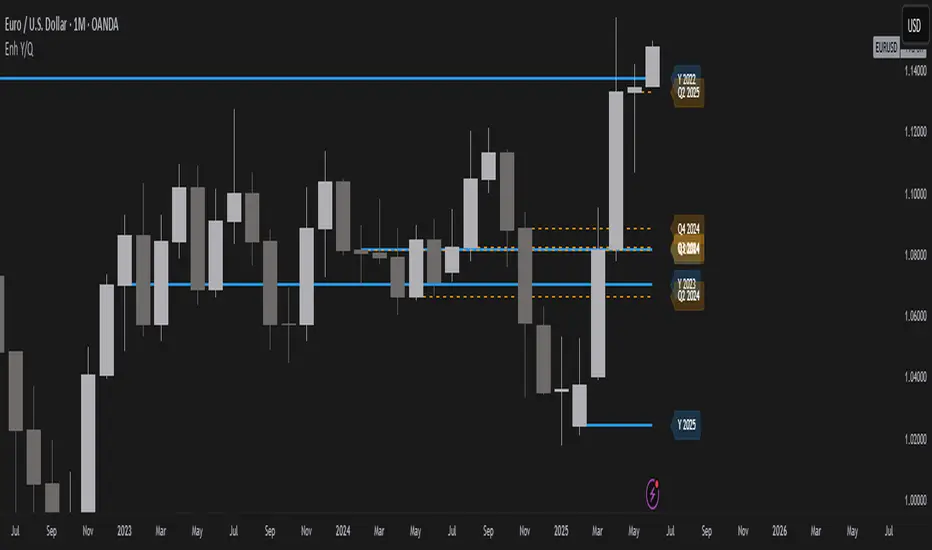
Year/Quarter Open LevelsDeveloped by ADEL CEZAR and inspired by insights from ERDAL Y, this indicator is designed to give traders a clear edge by automatically plotting the Yearly Open and Quarterly Open levels — two of the most critical institutional reference points in price action.
These levels often act as magnets for liquidity, bias confirmation zones, and support/resistance pivots on higher timeframes. With customizable settings, you can display multiple past opens, fine-tune label positions, and align your strategy with high-timeframe structure — all in a lightweight, non-intrusive design.
If you follow Smart Money Concepts (SMC), ICT models, or build confluence using HTF structures and range theory, this script will integrate seamlessly into your workflow.
Candlestick analysis
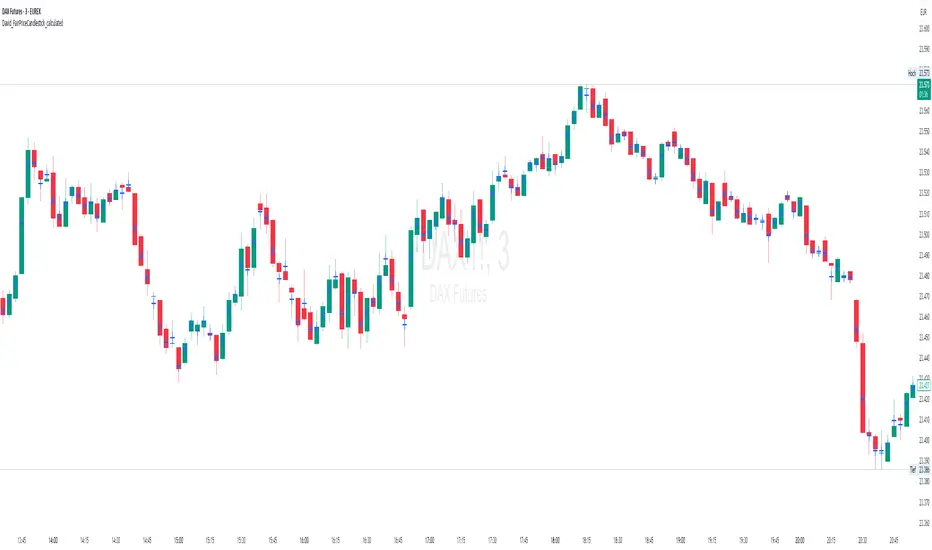
David_FairPriceCandlestick_calculatedDescription:
This indicator displays the "Typical Price" for each candle as a visual marker (cross) directly on the chart. The Typical Price is calculated as the average of the High, Low, and Close values of each bar:
(High + Low + Close) / 3
The marker provides a quick visual reference to the fair or average price level within every single candle.
Unlike a Point of Control (POC) or volume-based indicators, this script works purely with price data and is independent of volume or order flow.
Use cases:
Identify where most trading activity may have been concentrated within the candle (for price-based strategies)
Support as a reference line for mean-reversion or fair value concepts
Works on all timeframes and instruments
Customization:
You can easily change the marker style (cross, dot, triangle, etc.) and color within the script.
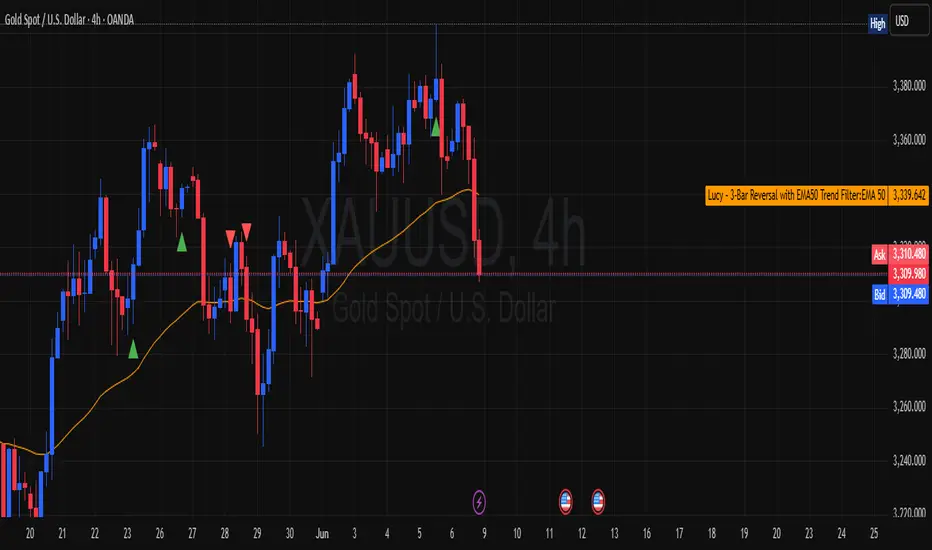
Lucy – 3-Bar Reversal with EMA50 Trend Filter📛 Lucy – 3-Bar Reversal with EMA50 Trend Filter
Purpose:
To detect and highlight bullish and bearish 3-bar reversal patterns on the chart, but only when they align with the dominant trend, defined by the EMA 50.
✅ How It Works
🟢 Bullish 3-Bar Reversal (Buy Setup):
Bar 1 is bearish (close < open)
Bar 2 makes a lower low than Bar 1
Bar 3 is bullish (close > open) and closes above Bar 2’s high
Price must be above EMA 50 (trend filter)
✅ Result: Shows a green triangle below the bar
🔴 Bearish 3-Bar Reversal (Sell Setup):
Bar 1 is bullish (close > open)
Bar 2 makes a higher high than Bar 1
Bar 3 is bearish (close < open) and closes below Bar 2’s low
Price must be below EMA 50
✅ Result: Shows a red triangle above the bar
📊 What It Plots:
🔼 Green triangle below bullish signal bar
🔽 Red triangle above bearish signal bar
🟠 Orange line = EMA50 (trend filter)
🔔 Built-in Alerts:
You’ll get an alert if:
A bullish reversal pattern forms above EMA50
A bearish reversal pattern forms below EMA50
🧠 Use Cases:
Great for trend-following traders who want clean, price-action entries
Works well on intraday (15m/1h) or swing (4h/daily) timeframes
Can be used for manual entries, or converted to strategy for automation
Whale Activity[nakano]#### **Title**
Whale Activity
#### **Summary**
This indicator visualizes the micro-level power dynamics occurring inside each candlestick. It analyzes the volume of a user-defined lower timeframe (e.g., 1-second) within each bar of the main chart (e.g., 5-minute) and separately plots the total "buying pressure" (bullish volume) and "selling pressure" (bearish volume) that exceeded a significant volume threshold.
It's a tool designed to help you trace the footprints of "whales" (large-scale investors) that are often hidden in standard volume bars.
#### **Key Features**
* **Bi-directional Volume Bars:**
* **Upward Green Bars:** Represent the sum of volume from bullish (up) lower-timeframe candles that exceeded the volume threshold, signifying buying pressure.
* **Downward Red Bars:** Represent the sum of volume from bearish (down) lower-timeframe candles that exceeded the threshold, signifying selling pressure.
* **Complete Customization:**
* **Symbol to Analyze:** Freely select any instrument from any market (Crypto, Stocks, Forex, etc.).
* **Analysis Timeframe (Lower):** Choose the granularity of your analysis (1S, 5S, 10S, 1M, etc.) from a dropdown menu.
* **Volume Threshold (Lower TF):** Set a minimum volume to filter out market noise and focus only on significant trades.
#### **How to Use & Interpretation Tips**
* **See Through "Deceptive Volume":**
If a 5-minute candle has high total volume, but this indicator shows small green and red bars, it suggests the volume was comprised of many insignificant trades with no clear intent from large players ("whales").
* **Identify Dominant Pressure:**
Conversely, a large, protruding green bar with a small red bar indicates strong, persistent buying pressure and potential accumulation. The same applies to selling pressure.
* **Threshold Adjustment is Key:**
The "Volume Threshold" is critical and varies greatly between assets. A value of `1.0` might be suitable for BTC, while a stock like AAPL might require `100000` (shares). Adjust this value to fit the instrument you are analyzing to unlock the full potential of this tool.
#### **Disclaimer**
* Using this indicator on high chart timeframes (e.g., 1H, 1D) requires fetching a very large amount of data from the lower timeframe, which may lead to performance issues or script errors. It is recommended for use on intraday timeframes (e.g., 1M, 5M, 15M).
* Always ensure the selected "Analysis Timeframe (Lower)" is shorter than or equal to your main chart's timeframe.
---
#### **タイトル**
Whale Activity
#### **概要 (Summary)**
このインジケーターは、ローソク足の内部で起きている微細な力関係を可視化します。指定した時間足(例:5分足)の中に含まれる、さらに短い時間足(例:1秒足)の出来高を分析し、閾値を超えた「買い圧力(陽線出来高)」と「売り圧力(陰線出来高)」をそれぞれ合計して、上下のバーで表示します。
通常の出来高バーでは見えない「クジラ(大口投資家)」の動きの痕跡を探るためのツールです。
#### **主な機能 (Key Features)**
* **上下の出来高バー:**
* **緑のバー(上向き):** 閾値を超えた陽線(買い)の出来高の合計値を表します。
* **赤のバー(下向き):** 閾値を超えた陰線(売り)の出来高の合計値を表します。
* **完全なカスタマイズ性:**
* **分析する銘柄:** 暗号資産、株式、FXなど、あらゆる銘柄を自由に選択して分析できます。
* **分析する時間足 (下位):** 1秒、5秒、10秒など、分析の粒度をドロップダウンから選択できます。
* **出来高の閾値 (下位TF):** 市場のノイズを除去し、「意味のある」と判断する出来高の基準値を自由に設定できます。
#### **使い方・分析のヒント (How to Use & Interpretation Tips)**
* **「見せかけの出来高」を見破る:**
例えば、5分足の出来高が大きくても、このインジケーターのバーが両方とも小さい場合、それは閾値以下の小さな取引の集合であり、大口の明確な意図はないかもしれません。
* **優勢な力の特定:**
逆に、緑のバーだけが突出している場合、誰かが継続的に買い集めている強いシグナルと解釈できます。売りも同様です。
* **閾値の調整が鍵:**
「出来高の閾値」は、分析する銘柄や時間帯によって大きく異なります。BTCなら`1`、AAPL株なら`100000`のように、適切な値に調整することで、初めてこのツールは真価を発揮します。
#### **注意点 (Disclaimer)**
* チャートの時間足を長くする(例: 1時間足、日足)と、計算するデータ量が膨大になり、パフォーマンスが低下したり、エラーが発生する可能性があります。分足での使用を推奨します。
* 「分析する時間足 (下位)」は、必ずチャート本体の時間足よりも短いものを選択してください。

Recent Internal Bar StrengthThis indicator is designed to assist price action traders by highlighting the Internal Bar Strength (IBS) of recent bars, offering a quantitative measure of each bar’s closing position within its own high–low range.
IBS is computed by dividing the difference between the bar’s closing price and its low by the total price range of that bar (i.e., the difference between its high and low). The resulting value lies between 0 and 1: the closer the closing price is to the high, the nearer the IBS approaches 1; conversely, the closer it is to the low, the nearer the IBS approaches 0. This metric may be interpreted as an indicator of directional bias within the bar itself, indirectly reflecting the strength or weakness of short-term market momentum.
In implementation, the IBS value is expressed as a percentage and visually encoded according to preset thresholds. Specifically, bullish bars with an IBS exceeding the upper threshold (default: 69) are rendered in blue-green, while bearish bars with an IBS falling below the lower threshold (default: 31) are rendered in orange. All other bars are displayed in a neutral gray. This visual scheme allows traders to quickly discern bars exhibiting pronounced internal strength or weakness, thereby facilitating more informed assessments of potential price behavior in the near term.
The indicator provides two types of information concurrently. First, it displays a user-defined number of IBS labels for recently closed bars, enabling retrospective analysis of recent price action and its continuity or variation. Second, it presents the real-time IBS value for the currently forming bar, allowing traders to monitor the bar’s evolving position within its range as it develops.
By visualizing IBS directly on the chart, this indicator offers a concise and coherent tool for observing the structural dynamics of individual bars. It aids in the quantitative interpretation of intrabar momentum, enriching the trader’s capacity to read price behavior with greater clarity and precision.

Ichimoku Multi-Timeframe Status[nakano]### Ichimoku Multi-Timeframe Status
---
#### Overview
This indicator is a sophisticated multi-timeframe analysis tool specializing in the "Sanyaku Kouten" (Three Bullish Signals) and "Sanyaku Gyakuten" (Three Bearish Signals) of the Ichimoku Kinko Hyo.
The status panel, displayed in the bottom-right corner of the screen, allows you to simultaneously monitor the Ichimoku conditions across up to eight different timeframes. This enables you to grasp the trend direction from short-term to long-term at a glance and helps you not to miss entry opportunities.
Through extensive trial, error, and debugging, the signal determination logic has been crafted to achieve a high degree of precision.
---
#### Key Features
1. **Multi-Timeframe Status Panel**
* **Monitor Multiple Timeframes at Once**: Displays the status of up to seven different timeframes (defaulting to 1m, 5m, 15m, 1h, 4h, 1D, and 1W) in a single list, in addition to the current chart's timeframe.
* **Detailed Status Display**: For each timeframe, it clearly displays whether the "Tenkan-sen," "Kumo (Cloud)," and "Chikou Span" components are in a "Bullish," "Bearish," or "— (Neutral)" state, color-coded for intuitive understanding.
* **Overall Judgment**: It comprehensively evaluates the state of each component to display a final signal of "Sanyaku Kouten" or "Sanyaku Gyakuten" in the panel.
2. **High-Precision Signal Logic**
* **Cloud Breakout**: Adopts a stricter logic, judging "Bullish" or "Bearish" breakouts only when the **real body** of the candlestick has completely broken out of the Kumo, not just the wicks.
* **Lagging Span (Chikou Span)**: Determines if the Chikou Span has clearly broken above/below the **real body** of the past candlestick. By consistently comparing it to the top/bottom of the real body, regardless of whether the candle is bullish or bearish, it captures more accurate signals.
* **Display Accuracy**: The common one-period display lag seen in many Ichimoku indicators for the Chikou Span and Kumo has been precisely corrected in both calculation and plotting.
3. **Alert Functionality**
* You can create TradingView alerts that trigger the moment a "Sanyaku Kouten" or "Sanyaku Gyakuten" is confirmed on the current timeframe. This allows you to receive notifications of opportunities without being tied to your chart.
4. **High Customizability**
* **Toggle Displays**: The status panel and the "Bullish"/"Bearish" labels on the chart can be easily toggled on or off from the settings menu. (Signal labels are off by default).
* **Complete Color Settings**: You can freely set the colors for all plotted elements, including the Tenkan-sen, Kijun-sen, Chikou Span, Kumo border lines, and Kumo background (for up and down clouds), allowing you to match your personal chart theme.
---
#### How to Use
1. **Add the indicator to your chart.**
2. **Open the settings menu.**
* **Display Settings**: Toggle the visibility of the on-chart signal labels and the status panel.
* **Timeframe Settings**: Freely configure up to seven timeframes you wish to monitor in the status panel.
* **Ichimoku Parameters**: Adjust the periods for the Tenkan-sen, Kijun-sen, etc., to fit your analysis.
* **Line Color Settings**: Customize the colors of the Ichimoku lines and the Kumo to your preference.
3. **Setting Up Alerts**
* Open the TradingView alert creation dialog.
* For "Condition," select this indicator (`Ichimoku Multi-Timeframe Status `).
* Choose either the "Sanyaku Kouten" or "Sanyaku Gyakuten" alert condition and configure your notification settings.
I hope this tool serves as a valuable aid in your market analysis and trading.
---
---
---
### Ichimoku Multi-Timeframe Status
---
#### 概要
このインジケーターは、一目均衡表の「三役好転・三役逆転」に特化した高機能なマルチタイムフレーム分析ツールです。
画面の右下に表示されるステータスパネルにより、最大8つの異なる時間足における一目均衡表の状況を同時に監視できます。これにより、短期から長期までのトレンドの方向性を一目で把握し、エントリーチャンスを逃しません。
多くの試行錯誤とデバッグを経て、シグナル判定のロジックは高い精度を持つように作り込まれています。
---
#### 主な機能
1. **マルチタイムフレーム・ステータスパネル**
* **複数時間足の一括監視**: 現在のチャートの足に加えて、最大7つの異なる時間足(デフォルトでは1分、5分、15分、1時間、4時間、日足、週足)の状況を一覧表示します。
* **詳細な状態表示**: 各時間足について、「転換線」「雲」「遅行スパン」の各要素が「好転」「逆転」「−(どちらでもない)」のいずれの状態にあるかを色付きで分かりやすく表示します。
* **総合判断**: 各要素の状態を総合的に判断し、最終的なシグナルとして「三役好転」または「三役逆転」をパネルに表示します。
2. **精度の高いシグナル判定ロジック**
* **雲抜け**: ローソク足のヒゲではなく、**実体が完全に雲を抜けた**場合のみ「好転」「逆転」と判定する、より厳密なロジックを採用しています。
* **遅行スパン**: 遅行スパンが、過去のローソク足の**実体**を明確に上抜け/下抜けしたかを判定します。陰線・陽線に関わらず、常に実体の上限/下限と比較するため、より正確なシグナルを捉えます。
* **表示の正確性**: 多くのインジケーターで見られる遅行スパンや雲の1期間の表示ズレを、計算と描画の両面で正確に補正しています。
3. **アラート機能**
* 現在のチャートの時間足で「三役好転」または「三役逆転」が成立した瞬間に、TradingViewのアラートを発生させることができます。これにより、チャンスを逃さず通知を受け取ることが可能です。
4. **高いカスタマイズ性**
* **表示の切り替え**: ステータスパネルや、チャート上に表示される「好転」「逆転」のラベルは、設定画面から表示/非表示を簡単に切り替えられます。(シグナルラベルはデフォルトで非表示)
* **完全なカラー設定**: 転換線、基準線、遅行スパン、雲の縁取り線、雲の背景色(上昇/下降)など、描画されるすべての要素の色を自由に設定でき、ご自身のチャートテーマに合わせることが可能です。
---
#### 使い方
1. **インジケーターをチャートに追加します。**
2. **設定画面を開きます。**
* **表示設定**: チャート上のシグナルラベルや、ステータスパネルの表示/非表示を切り替えます。
* **時間足設定**: ステータスパネルで監視したい時間足を最大7つまで自由に設定します。
* **一目均衡表パラメータ**: ご自身の分析に合わせて、転換線や基準線などの期間設定を変更できます。
* **ラインカラー設定**: チャートに表示される一目均衡表の各ラインや雲の色を、お好みの色にカスタマイズします。
3. **アラートの設定**
* TradingViewのアラート作成画面を開きます。
* 「条件」でこのインジケーター(`Ichimoku Multi-Timeframe Status `)を選択します。
* 「三役好転」または「三役逆転」のいずれかのアラート条件を選択し、通知設定を行ってください。
環境認識の補助ツールとして、皆様のトレードの一助となれば幸いです。

Forex Session Levels + Dashboard (AEST)This is a script showing all the key levels you will ever need for the breakout and retest strategy.
Follow my IG:
@liviupircalabu10

HTF 3rd Weekly High/LowThis indicator plots horizontal lines for the high and low of a selected past weekly candle, allowing traders to visualize higher time frame (HTF) structure on lower time frame charts (e.g., 1H, 4H, etc.).
Features:
Custom Weekly Range Selection: Use the dropdown to choose which weekly candle to reference — from the current week (0) to up to five weeks back.
Clean Horizontal Lines: High and low levels of the selected week are drawn as persistent horizontal lines.
Automatic Text Labels: Labels like Week-3H and Week-3L are shown on the right side of the chart, matching the week selected.
Customization:
Line colors
Line width and style (solid, dotted, dashed)
Text label offset
Automatic Refresh: Levels and labels are redrawn at the start of each new week to stay current with your selection.

Trend Persistence Counter (TPC) by riskcipher🧭 Trend Persistence Counter (TPC) – A Simple Price Action Trend Duration Tool
Trend Persistence Counter (TPC) is a lightweight indicator that counts how long a trend persists after a breakout.
It is entirely based on price action, without using any moving averages or smoothing. The goal is to give a simple, rule-based view of trend continuity.
🧠 How It Works (Logic Overview)
This indicator switches between two modes: bullish and bearish.
If close > previous high, the counter enters bullish mode, and starts at +1
While in bullish mode:
If close >= previous low → continue the uptrend → +1 each bar
If close < previous low → trend ends → reset to 0, switch to bearish mode
If close < previous low, the counter enters bearish mode, and starts at -1
While in bearish mode:
If close <= previous high → continue the downtrend → -1 each bar
If close > previous high → trend ends → reset to 0, switch to bullish mode
This provides a bar-by-bar count of trend persistence based on whether price holds structure.
🎯 Use Cases
Track how long a trend continues after a breakout
Quickly detect when trend structure breaks
Help visually filter “strong” vs “weak” moves
Build logic-based alerts (e.g., trend continues for N bars)
🔍 Why Use This Instead of Traditional Indicators?
This is not meant to replace moving averages or trend filters.
But it offers some advantages for those who prefer structure-based logic:
Feature TPC
Based on Price Action ✅ Yes
Uses Lagging Filters ❌ No moving average or smoothing
Trend Duration Measurement ✅ Counts valid consecutive moves
Complexity ⚪ Very simple and transparent
It’s a simple concept and easy to understand, but still useful when combined with other tools or visualized on its own.
⚙️ Technical Notes
Works on any timeframe or instrument
The value is positive during bullish persistence, negative during bearish
Value resets to 0 when trend structure breaks
All logic is calculated bar-by-bar, in real time
✅ Example Usage Ideas
Highlight candles when TPC value crosses a certain threshold (e.g., strong breakout continuation)
Use the zero-cross as a potential reversal warning
Filter trend signals in your existing strategies

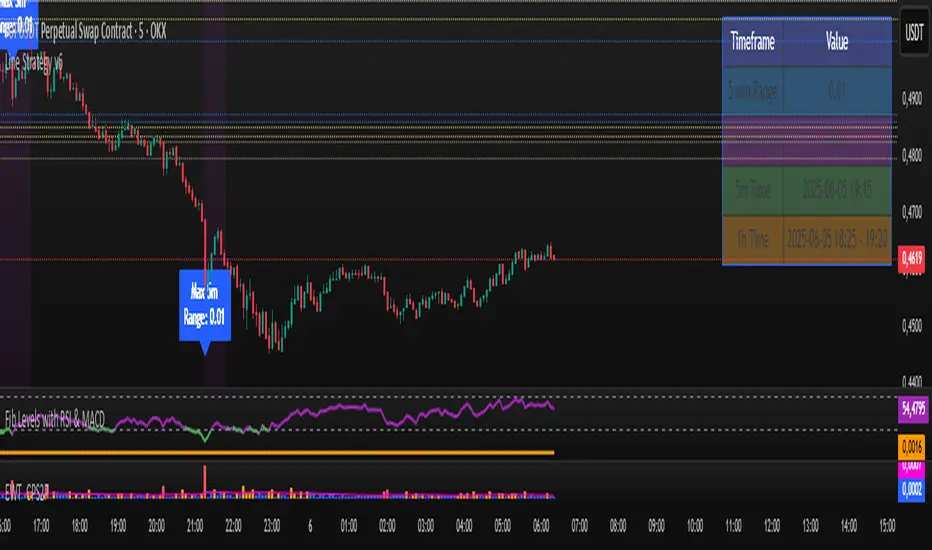
Line Strategy v6Line Indicator for TradingView
This Pine Script indicator identifies the largest candles on both 5-minute and 1-hour timeframes within the last 240 five-minute bars. It provides visual markers and detailed information to help traders spot significant price movements.
Key Features
Dual Timeframe Analysis:
Identifies largest candle on 5-minute timeframe
Identifies largest candle on 1-hour timeframe (aggregated from 12 five-minute candles)
Visual Markers:
Blue label marks the highest-range 5-minute candle
Purple background highlights the highest-range hourly candle period
Information Table:
Shows price ranges for both timeframes
Displays precise timestamps for identified candles
Color-coded for quick reference
Progress Indicator:
Shows how many bars have been collected (out of 240 required)
How It Works
Data Collection:
Stores high, low, timestamp, and bar index of the last 240 five-minute candles
Automatically updates with each new bar
5-Minute Analysis:
Scans all 5-minute candles to find the one with the largest price range (high - low)
Marks this candle with a blue label showing its range
Hourly Analysis:
Groups 12 five-minute candles to form each hourly candle
Finds the hourly candle with the largest price range
Highlights the entire hour period with a purple background
Information Display:
Creates a table in the top-right corner showing:
Range values for both timeframes
Timestamps of identified candles
Time period of the largest hourly candle
Usage Instructions
Apply the indicator to any 5-minute chart
Wait for the indicator to collect 240 bars (about 20 trading hours)
Results will appear automatically:
Blue label on the largest 5-minute candle
Purple background on the largest hourly candle period
Information table with detailed metrics
Customization Options
You can easily adjust these aspects by modifying the code:
Colors of markers and table cells
Transparency levels of background highlights
Precision of range values displayed
Position of the information table
The indicator is optimized for performance and works in both historical and real-time modes.
HA Reversal StrategyCertainly! Here's a detailed **description (elaboration)** for the **"HA Candle Test"** (i.e., the Heikin Ashi strategy script I just gave you):
---
### 📌 **Script Name**: HA Candle Test
### 📖 **Description**:
This script visualizes **Heikin Ashi candles** and identifies **trend reversal signals** using classic momentum candle behavior — particularly the appearance of **no-wick candles**, which are known to reflect strong directional pressure in Heikin Ashi charts.
It aims to **capture high-probability trend reversals** with minimal noise, relying on the natural smoothing behavior of Heikin Ashi candles.
---
### ✅ **Buy Signal Conditions**:
* At least **two consecutive red Heikin Ashi candles** (indicating a short-term downtrend).
* Followed by a **green Heikin Ashi candle** that has **no lower wick** (i.e., open == low).
* This suggests that **buyers have taken full control**, with no push from sellers — a potential start of an uptrend.
📍 **Interpreted as**: “Market was selling off, but now buyers stepped in strongly — time to consider buying.”
---
### ✅ **Sell Signal Conditions**:
* At least **two consecutive green Heikin Ashi candles** (short-term uptrend).
* Followed by a **red Heikin Ashi candle** that has **no upper wick** (i.e., open == high).
* This implies **sellers are dominating**, with no attempt from buyers to push higher — possible start of a downtrend.
📍 **Interpreted as**: “Market was rallying, but sellers just took over decisively — time to consider selling.”
---
### 📊 **Visual Aids Included**:
* Plots **Heikin Ashi candles** on your main chart for clarity.
* Uses **Buy** and **Sell** label markers (green & red) at signal points.
* Compatible with any timeframe — higher timeframes typically yield stronger signals.
---
### 💡 **Suggested Use**:
* Combine with **support/resistance**, **volume**, or **trend filters** for more robust setups.
* Works well on **1H, 4H, and Daily charts** in trending markets.
* Can be used manually or turned into an automated strategy for backtesting or alerts.
---
Would you like this script packaged as a **strategy()** for backtesting, or would you like me to add **alerts** so you can get notified in real-time when signals appear?

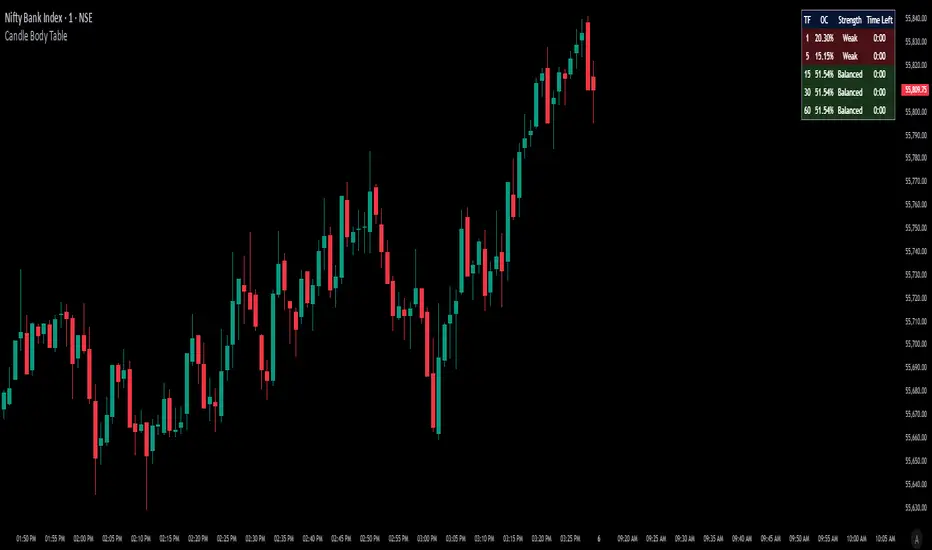
Candle Body TableCandle Body Table is a lightweight, easy-to-use indicator that displays a live summary of candle “body strength” across multiple timeframes, along with how much time is left on each candle. Simply choose up to five timeframes (1, 5, 15, 30, and 60 minutes by default), adjust the table’s corner and font size, and you’ll always have a quick, at-a-glance view of:
OC (Body %): The percentage of the candle that’s composed of its body (|open – close| divided by high–low).
Strength: A label (Weak, Balanced, or Strong) based on the body percentage.
Time Left: How many minutes and seconds remain before the current candle closes.
The table updates in real time (using lookahead), coloring each row background green if that timeframe’s current candle is bullish, or red if it’s bearish. That way, you can instantly see which timeframes have strong momentum, which are balanced or weak, and exactly when each candle will finish.
Use Cases
Multi-Timeframe Momentum Check:
If you want to confirm that both your 1m and 5m candles have “Strong” bodies before entering a trade, Candle Body Table shows you that instantly. No more switching back and forth between charts—just glance at the table.
Time-Sensitive Entries/Exits:
Suppose you trade breakouts only at the close of a 5-minute candle. The “Time Left” column counts down so you know exactly when that candle is about to close—down to the second—letting you prepare your order.
Quick Visual Scan:
When markets are choppy, you may want to see which timeframes are weak or balanced rather than diving into each timeframe separately. If the 15m row says “Weak” (small body %), you might avoid taking a trend-following position at that moment.
Session Overlaps & Volatility Windows:
During London/N.Y. overlap or U.S. cash close, traders often check for stronger bodies on higher timeframes (e.g., 30m or 60m). The table immediately highlights if that timeframe’s candle body heats up, indicating increased volatility.
Swing-to-Scalp Transition:
If you typically scalp on 1m but only when the 15m candle is “Strong,” this table gives a green/red cue and a strength label. That makes it easier to wait patiently until multiple timeframes align.
FAQ
Q1. What does “OC” mean, and why is it shown as a percentage?
A1. “OC” stands for Open/Close difference. So it reflects how much of the candle’s total range (high–low) is taken up by its body(open-close). A high OC% means the candle body is large relative to its wick. In other words a strong Bullish/Bearish candle.
Q2. How is “Strength” determined?
A2. The script uses three buckets:
Weak if OC% ≤ 30%
Balanced if 30% < OC% ≤ 55%
Strong if OC% > 55%
This gives you a quick label instead of having to interpret raw percentages every time.
Q3. Why do some rows have a green background and others red?
A3. If close > open (bullish candle), that entire row’s background is shaded green(70%). If close < open (bearish candle), it’s shaded red(70%). If open = close (doji), there’s no background shade. This lets you instantly spot bullish vs. bearish candles across your chosen timeframes.
Q4. Will this repaint?
A4. No. Because each OHLC value is requested with lookahead_on, you see the live developing OHLC. However, once a candle closes, those values are final. The “Time Left” column dynamically changes throughout the bar but does not redraw past values.
LRCLRC (Linear Regression Candle)
Overview
The LRC (Linear Regression Candle) indicator applies linear regression to the open, high, low, and close prices, creating smoothed "candles" that help filter market noise. It provides trend-confirmation signals and highlights potential reversal points based on regression crossovers.
Key Features
Smoothed Candles: Uses linear regression to calculate synthetic OHLC values, reducing noise.
Multi-Timeframe Support: Optional higher timeframe analysis for better trend confirmation.
Visual Signals: Color-coded candles and labels highlight bullish/bearish control zones.
Customizable Settings: Adjustable regression length, colors, and timeframe options.
How to Use
Signals & Interpretation
🟢 Bullish Signal (BUY): When the regression open crosses above the regression close (green candle).
🔴 Bearish Signal (SELL): When the regression open crosses below the regression close (red candle).
Control Zones:
Strong Bullish (Controlbull): Confirmed uptrend (bright green).
Bullish (Bull): Regular uptrend (light green).
Strong Bearish (Controlbear): Confirmed downtrend (dark red).
Bearish (Bear): Regular downtrend (orange).
Neutral (Gray): No clear trend.
Recommended Settings
Linear Regression Length: Default 8 (adjust for sensitivity).
Timeframe: Default current chart, but can switch to higher timeframes (e.g., 1D, 1W).
Bar Colors: Toggle on/off for visual clarity.
Labels: Displays "Control" markers at key reversal points.
Example Use Cases
Trend Confirmation: Use higher timeframe LRC to validate the primary trend.
Reversal Signals: Watch for BUY/SELL crossovers with strong color confirmation.
Noise Reduction: Helps avoid false breakouts in choppy markets.

Pullback Candle (Bullish & Bearish, No EMA)🔍 Purpose
This indicator detects simple pullback reversal patterns based on price action and swing highs/lows — without any moving average or trend filters.
It highlights:
Bullish pullbacks (potential bounce/long setups)
Bearish pullbacks (potential rejection/short setups)
📈 Bullish Pullback Criteria
Three-bar pattern:
Bar 3: Highest close
Bar 2: Lower close
Bar 1: Even lower close
Current bar closes above previous bar (bullish reversal)
One of the last two candles is the lowest low of the past 6 bars (swing low)
📍 Result: A small green cross is plotted below the bar, and the bar is colored green.
📉 Bearish Pullback Criteria
Three-bar pattern:
Bar 3: Lowest close
Bar 2: Higher close
Bar 1: Even higher close
Current bar closes below previous bar (bearish reversal)
One of the last two candles is the highest high of the past 10 bars (swing high)
📍 Result: A small red cross is plotted above the bar, and the bar is colored red.
🔔 Alerts
One alert condition each for bullish and bearish pullback detection.
Can be used to trigger TradingView alerts.
🛠️ Customization
No inputs — fully automated logic
Clean, minimal, and fast
Can be extended with labels, alert sounds, or signals

MestreDoFOMO RENKO Sushy System v6🔍 What is this script?
The MestreDoFOMO RENKO Sushy System is a visual tool developed to help traders better interpret the market trend based on a Renko logic adapted to traditional candlestick charts.
It does not use TradingView's native Renko chart, but rather a simulation of Renko behavior, calculated dynamically in real time, adapting to the percentage movement of the price.
🧠 How does it work?
The script uses a Renko simulation with an adjustable percentage base (Renko Size), allowing the trader to define the size of the virtual "blocks" or "bricks" in % of the price. This logic creates a dynamic trend line that changes direction only when there is a sufficient variation in the price — filtering out noise and helping to focus on the prevailing direction.
When a change in direction occurs, a visual signal is displayed on the chart:
💲 Buy signal, when the trend changes from bearish to bullish
👹 Sell signal, when the trend changes from bullish to bearish
These signals are not automatic trading alerts, but rather visual periodic signals based on the internal logic of the system.
📈 Why do we include EMAs (20, 50 and 200)?
Exponential moving averages (EMAs) are widely used in technical analysis as supporting tools for understanding market structure:
EMA 20: A short-term indicator, useful for capturing recent movements.
EMA 50: Considered an interactive trend average, often used as dynamic support/resistance.
EMA 200: A long-term reference, often used to identify the "bigger direction" of the market.
EMAs are indicated in the script and can be enabled or disabled according to the user's preference. They are not part of the signal logic — they serve only as visual and contextual support to assist the trader's manual analysis.
📋 Included features
✅ Renko logic adapted to the candlestick chart, with sensitivity control in %
✅ Trend line based on the current Renko direction
✅ Visual signals of trend change (buy/sell)
✅ Option to enable/disable EMAs 20, 50 and 200
✅ Information panel with trend status, EMA values and current parameters
✅ Customizable trend change alerts
✅ Background color to strengthen the direction (green = high, red = low)
🛠 How to use?
Choose the timeframe: Works best on timeframes longer than 1 hour (e.g. 1H, 4H, Daily).
Adjust the Renko size (%): Try starting with 1% and adjusting according to the asset (crypto, forex, etc.).
Decide whether to use EMAs: Only activate if you want additional context.
Observe the signals and the trend line: They are useful for detecting possible reversals or confirmations of movement.
Combine with other elements: This system is a support tool. For best results, use it in conjunction with price action, liquidity zones or other complementary indicators.
⚠️ Important notice
This script does not execute orders or make automatic decisions. It is an educational and visual tool created to help read the trend in a clean and simple way.
No guarantee of past or future performance is provided. Use is at the sole risk of the user.

EMA 200 Monitor - Bybit CoinsEMA 200 Monitor - Bybit Coins
📊 OVERVIEW
The EMA 200 Monitor - Bybit Coins is an advanced indicator that automatically monitors 30 of the top cryptocurrencies traded on Bybit, alerting you when they are close to the 200-period Exponential Moving Average on the 4-hour timeframe.
This indicator was developed especially for traders who use the EMA 200 as a key support/resistance level in their swing trading and position trading strategies.
🎯 WHAT IT'S FOR
Multi-Asset Monitoring: Simultaneous monitoring of 30 cryptocurrencies without having to switch between charts
Opportunity Identification: Detects when coins are approaching the 200 EMA, a crucial technical level
Automated Alerts: Real-time notifications when a coin reaches the configured proximity
Time Efficiency: Eliminates the need to manually check chart collections
⚙️ HOW IT WORKS
Main Functionality
The indicator uses the request.security() function to fetch price data and calculate the 200 EMA of each monitored asset. With each new bar, the script:
Calculates the distance between the current price and the 200 EMA for each coin
Identifies proximity based on the configured percentage (default: 2%)
Displays results in a table organized on the chart
Generates automatic alerts when proximity is detected
Monitored Coins
Major : BTC, ETH, BNB, ADA, XRP, SOL, DOT, DOGE, AVAX
DeFi : UNI, LINK, ATOM, ICP, NEAR, OP, ARB, INJ
Memecoins : SHIB, PEPE, WIF, BONK, FLOKI
Emerging : SUI, TON, APT, POL (ex-MATIC)
📋 AVAILABLE SETTINGS
Adjustable Parameters
EMA Length (Default: 200): Exponential Moving Average Period
Proximity Percentage (Default: 2%): Distance in percentage to consider "close"
Show Table (Default: Active): Show/hide results table
Table Position: Position of the table on the chart (9 options available)
Color System
🔴 Red: Distance ≤ 1% (very close)
🟠 Orange: Distance ≤ 1.5% (close)
🟡 Yellow: Distance ≤ 2% (approaching)
🚀 HOW TO USE
Initial Configuration
Add the indicator to the 4-hour timeframe chart
Set the parameters according to your strategy
Position the table where there is no graphic preference
Setting Alerts
Click "Create Alert" in TradingView
Select the "EMA 200 Monitor" indicator
Set the notification frequency and method
Activate the alert to receive automatic notifications
Results Interpretation
The table shows:
Coin: Asset name (e.g. BTC, ETH)
Price: Current currency quote
EMA 200: Current value of the moving average
Distance: Percentage of proximity to the core code
💡 STRATEGIES TO USE
Reversal Trading
Entry: When price touches or approaches the EMA 200
Stop: Below/above the EMA with a safety margin
Target: Previous resistance/support levels
Breakout Trading
Monitoring: Watch for currencies consolidating near the EMA 200
Entry: When the media is finally broken
Confirmation: Volume and close above/below the EMA
Swing Trading
Identification: Use the monitor to detect setups in formation
Timing: Wait for the EMA 200 to approach for detailed analysis
Management: Use the EMA as a reference for stops dynamics
⚠️ IMPORTANT CONSIDERATIONS
Technical Limitations
Request Bybit data: Access to exchange symbols required
Specific timeframe: Optimized for 4-hour analysis
Minimum delay: Data updated with each new bar
Usage Recommendations
Combine with technical analysis: Use together with other indicators
Confirm the configuration: Check the graphic patterns before trading
Manage risk: Always use stop loss and adequate position sizing
Backtesting: Test your strategy before applying with real capital
Disclaimer
This indicator is a technical analysis tool and does not constitute investment advice. Always do your own analysis and manage detailed information about the risks of your operations.
🔧 TECHNICAL INFORMATION
Pine Script version: v6
Type: Indicator (overlay=true)
Compatibility: All TradingView plans
Resources used: request.security(), arrays, tables
Performance: Optimized for multiple simultaneous queries
📈 COMPETITIVE ADVANTAGES
✅ Simultaneous monitoring of 30 major assets ✅ Clear visual interface with intuitive core system ✅ Customizable alerts for different details ✅ Optimized code for maximum performance ✅ Flexible configuration adaptable to different strategies ✅ Real-time update without the need for manual refresh
Developed for traders who value efficiency and accuracy in identifying market opportunities based on the EMA 20

Advanced MACD Pro (WhiteStone_Ibrahim) - T3 Themed✨ Advanced MACD Pro (WhiteStone_Ibrahim) - T3 Themed ✨
Take your MACD analysis to the next level with the Advanced MACD Pro - T3 Themed indicator by WhiteStone_Ibrahim! This isn't just another MACD; it's a comprehensive toolkit packed with advanced features, unique T3 integration, and extensive customization options to provide deeper market insights.
Whether you're a seasoned trader or just starting, this indicator offers a versatile and powerful way to analyze momentum, identify trends, and spot potential reversals.
Key Features:
Core MACD Functionality:
Classic MACD Line: Calculated from customizable Fast and Slow EMAs using your chosen source (Close, Open, HLC3, etc.).
Standard Signal Line: EMA of the MACD line, with adjustable length.
Dynamic MACD Line Coloring: Automatically changes color based on whether it's above or below the zero line (positive/negative).
Zero Line: Clearly plotted for reference.
Enhanced MACD Histogram:
Sophisticated Color Coding: The histogram isn't just positive or negative. It intelligently colors based on momentum strength and direction:
Strong Bullish: MACD above signal, histogram increasing.
Weakening Bullish: MACD above signal, histogram decreasing.
Strong Bearish: MACD below signal, histogram decreasing.
Weakening Bearish: MACD below signal, histogram increasing.
Neutral: Default color for other conditions.
Optional Histogram Smoothing: Smooth out the histogram noise using one of five different moving average types: SMA, EMA, WMA, RMA, or the advanced T3 (Tilson T3). Customize smoothing length and T3 vFactor.
🌟 Unique T3 Integration (T3 Themed):
Extra T3 Signal Line (on MACD): An additional, fast-reacting T3 moving average calculated directly from the MACD line. This provides an alternative and often quicker signal.
Customizable T3 length and vFactor.
Dynamic Coloring: The T3 Signal Line changes color (bullish/bearish) based on its crossover with the MACD line, offering clear visual cues.
T3 is also available as a smoothing option for the main histogram (see above).
🔍 Disagreement & Divergence Detection:
Bar/Price Disagreement Markers:
Highlights instances where the price bar's direction (e.g., a bullish candle) contradicts the current MACD momentum (e.g., MACD below its signal line).
Visual markers (circles) appear above/below bars to draw attention to these potential early warnings or confirmations.
Histogram Color Change on Disagreement: Optionally, the histogram can adopt distinct alternative colors during these bar/price disagreements for even clearer visual alerts.
Classic Bullish & Bearish Divergence Detection:
Automatically identifies regular divergences between price action (Higher Highs/Lower Lows) and the MACD line (Lower Highs/Higher Lows).
Customizable pivot lookback periods (left and right bars) for divergence sensitivity.
Plots clear "Bull" and "Bear" labels on the price chart where divergences occur.
🎨 Extensive Customization & Visuals:
Multiple Color Themes: Choose from pre-set themes like 'Dark Mode', 'Light Mode', 'Neon Night', or use 'Default (Current Settings)' to fine-tune every color yourself.
Granular Control (Default Theme): Individually customize colors and thickness for:
MACD Line (positive/negative)
Standard Signal Line
Extra T3 Signal Line (bullish/bearish)
Histogram (all four momentum states + neutral)
Disagreement Markers & Histogram Alt Colors
Divergence Lines/Labels
Zero Line
Toggle Visibility: Easily show or hide the Standard Signal Line and the Extra T3 Signal Line as needed.
🔔 Comprehensive Alert System:
Stay informed of key market events with a wide array of configurable alerts:
MACD Line / Standard Signal Line Crossover
Histogram / Zero Line Crossover
MACD Line / Zero Line Crossover
Bullish Divergence Detected
Bearish Divergence Detected
Bar/Price Disagreement (Bullish & Bearish)
MACD Line / Extra T3 Signal Line Crossover
Each alert can be individually enabled or disabled.
The Advanced MACD Pro - T3 Themed indicator is designed to be your go-to tool for momentum analysis. Its rich feature set empowers you to tailor it to your specific trading style and gain a more nuanced understanding of market dynamics.
Add it to your charts today and experience the difference!
(Developed by WhiteStone_Ibrahim)

Higher Timeframe Market StructureHTF Market Structure – ZigZag, Break of Structure & Supply/Demand
This powerful indicator is designed to identify higher-timeframe market structure using a combination of ZigZag patterns, Break of Structure (BOS) signals, and Supply/Demand zones.
Key Features:
Automatic detection of Higher Highs (HH), Higher Lows (HL), Lower Lows (LL), and Lower Highs (LH)
Internal structure shifts based on Open or High/Low logic
Supply and Demand zones plotted on the chart
Break of Structure (BOS) lines with optional alerts
Mitigation logic to mark or delete invalidated order blocks
Customizable aggregation factor to view higher time frame structure on lower time frames
How to Use:
Focus on market structure and BOS to understand the current trend.
Watch for internal shifts as early signals of potential reversals.
Use ZigZag lines to connect swing highs and lows to visualize market rhythm.
Supply zones (red) and Demand zones (green) are automatically drawn after structure breaks:
Use Demand Zones in Bullish Markets for the highest probability entries.
Use Supply Zones in Bearish Markets to align with the prevailing trend.
Best Practices:
Only use Demand Zones in Bullish markets and Supply Zones in Bearish markets for optimal results.
Look for price action or reversal signals within these zones to refine your entries.
Enable alerts to get notified on:
New order blocks
Internal shifts
BOS events
HH, HL, LL, LH formations
Liquidity sweeps
Customization Options:
Aggregation Factor: Control how many candles are grouped for structure analysis.
Zone Duration: Define how length of plotted zones.
Mitigation Settings: Automatically delete or fade zones after mitigation.
Colors: Choose custom colors for bullish and bearish zones and structure markers.
This tool is ideal for traders who rely on price action, structure, and smart money concepts. Combine it with your own S&D strategy or integrate it with other confluence tools for even better precision.

Liquidity mark-out indicator(by Lumiere)This indicator marks out every High that has a bullish candle followed by a bearish one, vice versa for lows.
Once the price reaches the marked-out liquidity, the line is removed automatically.
This indicator only shows the current liquidity of the time frame you are at.
(To get it look like the picture just chance the length to 30-50)
Key Features of the Liquidity Mark-Out Indicator:
🔹 Identifies Liquidity Zones – Marks highs and lows based on candlestick patterns.
🔹 Customizable Settings – Toggle highs/lows visibility 🎚️, adjust line colors 🎨, and set line length (bars) 📏.
🔹 Smart Clean-Up – Automatically removes swept levels (when price breaks through) for a clean chart 🧹.
🔹 Pattern-Based Detection –
Highs: Detects two-candle reversal patterns (🟢 bullish close → 🔴 bearish close).
Lows: Detects two-candle reversal patterns (🔴 bearish close → 🟢 bullish close).
🔹 Dynamic Lines – Projects liquidity levels forward (adjustable length) to track key zones 📈.
Perfect For Traders Looking To:
✅ Spot potential liquidity grabs 🎯
✅ Identify key support/resistance levels 🛑
✅ Clean up their chart from outdated levels 🖥️

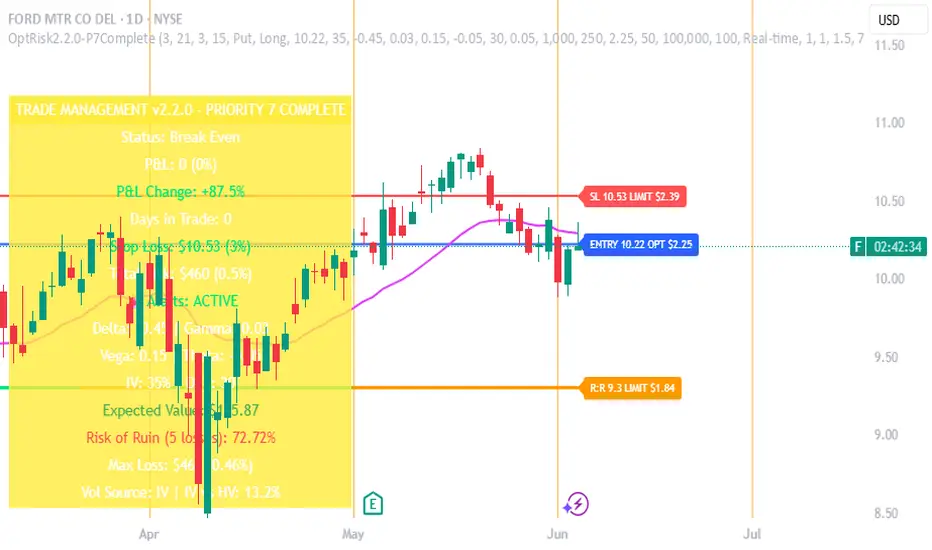
Options Risk Manager v2.2.0 - Priority 7 CompleteScript Description for TradingView Publication
Options Risk Manager v2.2.0 - Priority 7 Complete
What does this script do?
Options Risk Manager v2.2.0 is a comprehensive position management system designed specifically for options traders. The indicator calculates precise stop loss levels, risk/reward targets, and position sizing based on user-defined risk parameters. It provides real-time profit/loss tracking, options Greeks monitoring, and automated alert systems for critical price levels.
The script displays entry points, stop losses, and profit targets directly on the chart while continuously calculating position metrics including dollar risk, account exposure, and probability of success. Version 2.2.0 introduces Priority 7 advanced alerts with dynamic risk warnings and multi-condition notifications.
How does it do it?
The script performs several key calculations:
1. Risk-Based Stop Loss Calculation - Determines stop loss levels based on percentage of entry price, automatically adjusting for calls versus puts. Put positions place stops above entry, while calls place stops below.
2. Position Sizing Algorithm - Calculates optimal contract quantities using account size, risk
percentage, and stop distance to ensure consistent risk per trade regardless of underlying price.
3. Options-Specific P&L Tracking - Incorporates Delta, Gamma, Vega, and Theta to provide accurate profit/loss calculations for options positions, including time decay effects.
4. Three-Phase Trade Management - Implements systematic position management through Entry
Phase (initial risk), Profit Phase (approaching target), and Trailing Phase (EMA-based exit
management).
5. Multi-Level Alert System - Monitors price action, Greeks thresholds, time decay acceleration, and account risk levels to generate context-aware notifications.
How to use it?
Initial Setup:
1. Apply indicator to any optionable security
2. Toggle "In Position" ON when entering a trade
3. Set Direction (Call/Put) and Side (Long/Short)
4. Enter the underlying price at position entry
5. Specify number of contracts and risk percentage
Position Management:
Blue line shows entry price
Red line indicates stop loss level
Orange line displays risk/reward target
Purple EMA line activates after target hit
Monitor real-time P&L in trade panels
Alert Configuration:
Enable Advanced Alerts in settings
Set profit/loss notification thresholds
Configure Greek-based warnings
Activate time decay alerts for expiration
Risk Parameters:
Risk % determines stop distance from entry
Account Value sets position sizing limits
Contract Multiplier (standard = 100)
R:R Ratio defines profit targets
What makes it unique?
Options Risk Manager addresses the specific challenges of options trading that generic indicators miss. The script accounts for the inverse relationship in put options (profiting from price declines), incorporates Greeks for accurate P&L calculations, and provides options-specific limit orders for TradeStation integration.
The three-phase management system removes emotional decision-making by defining clear rules for position management. Phase transitions occur automatically based on price action, shifting from initial risk management to profit protection to trend-following modes.
Version 2.2.0's Priority 7 alert system provides intelligent notifications that include live metrics, risk warnings, and market context rather than simple price crosses.
Key Features Summary
Options-Specific Calculations - Proper handling of calls/puts with inverse relationships
Risk-Based Position Sizing - Consistent risk regardless of underlying price
Greeks Integration - Delta, Gamma, Vega, Theta for accurate tracking
Phase Management System - Systematic three-stage position handling
Advanced Alert System - Context-aware notifications with metrics
TradeStation Integration - Option limit orders for execution
Visual Risk Display - Clear chart overlays for all levels
Probability Calculator - Win/loss probability with expected value
Multi-Account Support - Scales from small to large accounts
Important Notes
This indicator requires manual input of option prices and Greeks (available from your broker's option chain). It functions as a risk management overlay and does not generate entry signals. The calculations assume standard options contracts of 100 shares.
Designed for TradeStation platform with full functionality. Basic features available on other platforms
without options data integration. Always verify calculations with your broker's risk system before placing
trades.
Cumulative Intraday Volume with Long/Short LabelsThis indicator calculates a running total of volume for each trading day, then shows on the price chart when that total crosses levels you choose. Every day at 6:00 PM Eastern Time, the total goes back to zero so it always reflects only the current day’s activity. From that moment on, each time a new candle appears the indicator looks at whether the candle closed higher than it opened or lower. If it closed higher, the candle’s volume is added to the running total; if it closed lower, the same volume amount is subtracted. As a result, the total becomes positive when buyers have dominated so far today and negative when sellers have dominated.
Because futures markets close at 6 PM ET, the running total resets exactly then, mirroring the way most intraday traders think in terms of a single session. Throughout the day, you will see this running total move up or down according to whether more volume is happening on green or red candles. Once the total goes above a number you specify (for example, one hundred thousand contracts), the indicator will place a small “Long” label at that candle on the main price chart to let you know buying pressure has reached that level. Similarly, once the total goes below a negative number you choose (for example, minus one hundred thousand), a “Short” label will appear at that candle to signal that selling pressure has reached your chosen threshold. You can set these threshold numbers to whatever makes sense for your trading style or the market you follow.
Because raw volume alone never turns negative, this design uses candle direction as a sign. Green candles (where the close is higher than the open) add volume, and red candles (where the close is lower than the open) subtract volume. Summing those signed volume values tells you in a single number whether buying or selling has been stronger so far today. That number resets every evening, so it does not carry over any buying or selling from previous sessions.
Once you have this indicator on your chart, you simply watch the “summed volume” line as it moves throughout the day. If it climbs past your long threshold, you know buyers are firmly in control and a long entry might make sense. If it falls past your short threshold, you know sellers are firmly in control and a short entry might make sense. In quieter markets or times of low volume, you might use a smaller threshold so that even modest buying or selling pressure will trigger a label. During very active periods, a larger threshold will prevent too many signals when volume spikes frequently.
This approach is straightforward but can be surprisingly powerful. It does not rely on complex formulas or hidden statistical measures. Instead, it simply adds and subtracts daily volume based on candle color, then alerts you when that total reaches levels you care about. Over several years of historical testing, this formula has shown an ability to highlight moments when intraday sentiment shifts decisively from buyers to sellers or vice versa. Because the indicator resets every day at 6 PM, it always reflects only today’s sentiment and remains easy to interpret without carrying over past data. You can use it on any intraday timeframe, but it works especially well on five-minute or fifteen-minute charts for futures contracts.
If you want a clear gauge of whether buyers or sellers are dominating in real time, and you prefer a rule-based method rather than a complex model, this indicator gives you exactly that. It shows net buying or selling pressure at a glance, resets each session like most intraday traders do, and marks the moments when that pressure crosses the levels you decide are important. By combining a daily reset with signed volume, you get a single number that tells you precisely what the crowd is doing at any given moment, without any of the guesswork or hidden calculations that more complicated indicators often carry.

Pucci Trend EMA-SMA Crossover with TolerancePucci Trend EMA-SMA Crossover with Tolerance
This indicator helps identify market trends and generates trading signals based on the crossover between an Exponential Moving Average (EMA) and a Simple Moving Average (SMA) with an adjustable tolerance threshold. The signals work as follows:
Buy Signal (B) -> Triggers when the EMA crosses above the SMA, exceeding a user-defined tolerance (in basis points). Optionally, a price filter can require the high or low to be below the EMA for confirmation.
Sell Signal (S) -> Triggers when the SMA crosses above the EMA, exceeding the tolerance. The optional price filter may require the high or low to be above the EMA.
The tolerance helps reduce false signals by requiring a minimum distance between the moving averages before confirming a crossover. The price filter adds an extra confirmation layer by checking if price action respects the EMA level.
Important Notes:
1º No profitability guarantee: This tool is for analysis only and may generate losses.
2º "As Is" disclaimer: Provided without warranties or responsibility for trading outcomes.
3º Use Stop Loss: Users must determine their own risk management.
4º Parameter adjustment needed: Optimal MA periods and tolerance vary by timeframe.
5º Filter impact varies: Enabling/disabling the price filter may improve or worsen performance.

FVG Trailing Stop [LuxAlgo]The FVG Trailing Stop indicator tracks unmitigated Fair Value Gaps (FVG) data to produce a Trailing Stop indicator able to determine if the market is uptrending or downtrending easily.
🔶 USAGE
The FVG Trailing Stop is intended to identify trend directions through its position relative to the closing price:
Bullish: Price is located above the Trailing Stop, indicating that all Bearish FVGs have been mitigated and the trend is anticipated to continue upwards.
Bearish State: Price is located below the Trailing Stop, indicating that all Bullish FVGs have been mitigated and the trend is anticipated to continue downwards.
The Trailing Stop originates from two extremities obtained from the average of respective unmitigated FVGs. The specific directional average is also displayed as a more transparent secondary line, however, the trailing stop is derived from this value and a new trend will not be detected until the opposite directional average is crossed.
Price reaching the Trailing Stop is caused by retracements and can lead to the following scenarios:
Outcome 1: The directional average is crossed next, indicating a new trend direction.
Outcome 2: The directional average is held as support or resistance, leading to a new impulse and a continuation of the trend.
🔹 Reset on Cross
While price crossing the Trailing Stop should be considered as a sign of an upcoming trend change; it is possible for the price to still evolve outside it.
As a solution, we have included the "Reset on Cross" feature, which (as the name suggests) hides and resets the Trailing Stop each time it is crossed, leading to a "Neutral" state.
This opens the opportunity for the Trailing Stop to be displayed again once the price moves again in the direction of the pre-established trend. A trader might use this to accumulate positions within a specific trend.
🔶 DETAILS
The script uses a typical identification method for FVGs. Once identified, the script collects the point of the FVG farthest from the current price when formed.
For Upwards FVGs this is the bottom of the FVG.
For Downwards FVGs this is the top of the FVG.
The data is managed only to use the last input lookback of FVGs. If an FVG is mitigated, it frees up a spot in the memory for a new FVG, however, if the lookback is full, the oldest will be deleted.
From there, it uses a "trailing" logic only to move the Trailing Stop in one direction until the trailing stop resets or the direction flips.
The extremities used to calculate the Trailing Stop are created from 2 calculation steps, the first step involves taking the raw average of the FVG mitigation levels, and the second step applies a simple moving average (SMA) smoothing of the precedent-obtained averages.
🔶 SETTINGS
Unmitigated FVG Lookback: Sets the maximum number of Unmitigated FVGs that the script will use.
Smoothing Length: Sets the smoothing length for the Trailing Stop to reduce erratic results.
Reset on Cross: When enabled, hide and reset the Trailing Stop until the price starts moving in the pre-established trend direction again.
