Stephis Supply & Demand Zones v3
📉 Support
Definition: Support is a price level where a downtrend can be expected to pause or reverse due to a concentration of buying interest.
Why it matters: When the price of an asset falls to a support level, traders expect buyers to step in, preventing the price from falling further.
Visual clue: On a chart, support often appears as a horizontal line where the price has bounced up multiple times.
📈 Demand
Definition: Demand refers to the willingness and ability of buyers to purchase an asset at a given price.
In trading context: High demand typically pushes prices up, while low demand can lead to price drops.
Relation to support: A support level exists because of demand—buyers are willing to buy at that price, creating a floor.
🧠 How They Work Together
When price approaches a support level, traders watch to see if demand increases—if it does, the price may bounce.
If the support level is broken, it may signal that demand has weakened, and the price could fall further.
🔁 Opposite Concept: Resistance & Supply
Resistance is the opposite of support—it's a level where selling pressure (supply) may stop a price from rising.
Just like demand creates support, supply creates resistance.
Candlestick analysis

Valid Pullbacks [keypoems]Valid Pullbacks
This indicator marks Valid Pullbacks on a chart. The core of the script is designed to find significant swing points by maintaining and validating candidate highs and lows.
Notice this is very different than other swing marker (fractals or otherwise). This is the base used to draw DTFX/Supply and Demand Zones. I am starting a full rewrite of all the components of my market structure indicator and this is part 1.
Core Concepts
The script operates in a stateful manner, alternating between searching for a Valid Pullback High and a Valid Pullback Low.
Initial State: At the beginning, the script assumes it is searching for the first Valid Pullback High.
Alternating Search: Once a Valid Pullback High is confirmed, the script switches its state to search for a Valid Pullback Low. Conversely, after a Valid Pullback Low is confirmed, it begins searching for a Valid Pullback High. This ensures a proper sequence of alternating swing points.
Defining a Swing Point
The script uses two primary ways to define a swing point, depending on user settings:
Wick-Based Swing (Default):
A Swing High occurs when the high of a candle is higher than the high of the candle immediately before and after it. (high > high and high > high )
A Swing Low occurs when the low of a candle is lower than the low of the candle immediately before and after it. (low < low and low < low )
Close-Based Swing:
A Swing High is identified based on a more complex relationship involving the closes and highs/opens of the three most recent candles, requiring the swing point to be formed by an "up-close" candle.
A Swing Low is identified similarly, requiring the swing point to be formed by a "down-close" candle.
* The Logic
This logic to update the internal state runs on every bar of the chart to update the status of candidate highs and lows.
1. Candidate Selection
The script continuously searches for the best possible candidate for the next valid swing.
Searching for a Candidate High:
This happens only if the last confirmed swing was a Valid Pullback Low (or at the very start).
On every new bar, the script checks if the previous bar represents a better candidate than the current one.
A "better" candidate is one with a higher price. The specific price checked (high or close) depends on whether the close-based or wick-based definition of a swing is being used.
If a better candidate is found, it replaces the existing candidateHigh. The candidate's price is always recorded as the high of that bar.
Searching for a Candidate Low:
This happens only if the last confirmed swing was a Valid Pullback High.
The logic is the mirror opposite of the high search. It looks for a "better" candidate with a lower price on every new bar.
If a better candidate is found, it replaces the existing candidateLow. The candidate's price is always recorded as the low of that bar.
2. Candidate Confirmation
Once a candidate is being tracked, the script waits for a specific market action to confirm it as a Valid swing.
Confirming a Valid Pullback High:
A candidateHigh is confirmed and becomes a Valid Pullback High if the price breaks below the low of the candidate bar.
When this happens:
The candidateHigh is stored in the validHighs array.
Both the candidateHigh and candidateLow are completely reset.
The script's state switches to now search for a Valid Pullback Low.
Confirming a Valid Pullback Low:
A candidateLow is confirmed and becomes a Valid Pullback Low if the price breaks above the high of the candidate bar.
When this happens:
The candidateLow is stored in the validLows array.
Both the candidateLow and candidateHigh are completely reset.
The script's state switches to now search for a Valid Pullback High.
This continuous process of searching, updating, and confirming candidates allows the script to dynamically identify and plot the most recent and relevant valid swing points on the chart.

PineConnector [Extension] | FractalystWhat is the PineConnector Extension?
The PineConnector Extension is a sophisticated bridge indicator designed to seamlessly connect Quantify trading signals with PineConnector's automated execution system.
This extension transforms manual signal monitoring into fully automated trading by interpreting Quantify's signal outputs and converting them into executable PineConnector commands.
Unlike standalone trading indicators, this extension serves as a communication layer between your signal generation (Quantify indicator) and trade execution (PineConnector), enabling hands-free trading across multiple timeframes and instruments.
How does the signal processing work?
The extension processes four distinct signal types from Quantify indicators:
Signal Values:
1 = Buy/Long signal - Opens bullish positions
-1 = Sell/Short signal - Opens bearish positions
0.5 = Close Long - Closes all long positions
-0.5 = Close Short - Closes all short positions
The script continuously monitors the "Signal Source" input, which should be connected to any Quantify indicator's output. When a signal is detected, the extension automatically generates the corresponding PineConnector command with your configured parameters.
What are the available order types and how do they work?
The extension supports three order execution modes:
Market Orders:
- Execute immediately at current market price
- Highest execution probability
- Subject to slippage during volatile conditions
Limit Orders:
- Execute only when price reaches a more favorable level
- Buy limits placed below current price
- Sell limits placed above current price
- Dynamic pip offset calculated using ATR-based volatility
Stop Orders:
- Execute when price breaks beyond specified levels
- Buy stops placed above current price
- Sell stops placed below current price
- Useful for breakout strategies
Dynamic Pricing Calculation:
The extension calculates optimal entry prices using volatility-adjusted pip offsets:
priceVolatility = ta.atr(14) / close * 100
volatilityFactor = math.min(math.max(priceVolatility / 0.1, 0.5), 2.0)
pipsOffset = 10 * volatilityFactor
How does the risk management system work?
Risk Percentage:
The extension uses percentage-based position sizing where you specify the risk per trade (0.1% to 10.0%). This value is passed to PineConnector, which calculates the exact position size based on:
- Account balance
- Stop loss distance
- Instrument specifications
- Broker settings
Stop Loss Integration:
- The "Stop Source" input connects to external stop loss levels from Quantify or other indicators. - This ensures:
- Consistent risk-reward ratios
- Dynamic stop placement based on market structure
- Automatic position sizing calculations
Multi-Asset Compatibility:
The extension automatically detects instrument types and adjusts pip calculations:
Forex: mintick * 10
Crypto: mintick * 10
Other assets: mintick * 1
What does the information display table show?
The real-time status table provides essential configuration monitoring:
Status Indicators:
- License: Shows PineConnector license ID status (Blue = Set, Red = Missing)
- Security: Displays secret key status (Blue = Set, Orange = Disabled)
- Comment: Shows trade comment or timeframe if empty
- Symbol: Current trading symbol (manual override or chart symbol)
- Order Type: Active execution mode (Market/Limit/Stop)
- Risk: Risk percentage with color coding (Blue ≤1%, Orange >1%)
- Signal: Connection status (Blue = Connected, Red = Not Set)
- Stop: Stop loss source status (Blue = Connected, Red = Not Set)
Color Coding System:
Blue: Optimal/Connected
Orange: Warning/Moderate risk
Red: Error/Not configured
How do I connect this to my Quantify indicator?
Step-by-Step Connection:
Add the PineConnector Extension to your chart containing Quantify indicator
Configure Signal Source:
In the extension settings, locate "Signal Source"
Click the dropdown and select your Quantify indicator's signal output
The extension will automatically detect custom sources vs. default price data
Configure Stop Source:
Connect "Stop Source" to your Quantify indicator's stop loss output
This enables dynamic position sizing based on stop distance
Verify Connection:
Check the information table for "Signal" and "Stop" status
Blue indicates successful connection
Red indicates default price data (not connected)
Compatible Quantify Indicators:
- Quantify Trading Model
- Any indicator outputting standardized signals (1, -1, 0.5, -0.5)
What PineConnector setup is required?
Prerequisites:
- Active PineConnector License - Required for all functionality
- MetaTrader 4/5 or supported broker platform
- PineConnector EA installed and configured
- TradingView Pro/Pro+/Premium for alert functionality
Configuration Steps:
- License ID: Enter your PineConnector license ID in the extension
- Secret Key: Optional security layer for command verification
- Symbol Mapping: Ensure symbol names match between TradingView and broker
- Alert Setup: Create TradingView alerts using this indicator
- Webhook Configuration: Point alerts to your PineConnector webhook URL
Security Features:
- Optional secret key encryption
- Symbol-specific commands
- Debug mode for testing and validation
What makes this extension unique?
Seamless Integration:
- Unlike manual signal copying, this extension provides:
- Zero-latency signal translation
- Automated parameter passing
- Consistent execution across timeframes
- No human intervention required
Dynamic Adaptability:
Volatility-adjusted pricing for limit/stop orders
Automatic symbol detection and conversion
Multi-asset pip calculations
Intelligent timeframe formatting
Professional Risk Management:
- Percentage-based position sizing
- External stop loss integration
- Multi-order type support
- Real-time status monitoring
Robust Architecture:
- Error-resistant signal processing
- Comprehensive input validation
- Debug and testing capabilities
- Security features for live trading
Installation and Setup Guide
Quick Start:
- Add "PineConnector | Fractalyst" to your chart
- Configure your PineConnector license ID
- Connect Signal Source to your Quantify indicator
- Connect Stop Source to your stop loss indicator
- Set your preferred risk percentage
- Choose order type (Market recommended for beginners)
- Create TradingView alert using this indicator
- Ensure PineConnector EA is running on your trading platform
Advanced Configuration:
- Custom symbol mapping for cross-platform trading
- Secret key implementation for enhanced security
- Comment customization for trade tracking
- Debug mode for strategy validation
Legal Disclaimers and Risk Acknowledgments
Trading Risk Disclosure
This PineConnector Extension is provided for informational, educational, and automation purposes only and should not be construed as financial, investment, or trading advice. The extension facilitates automated trading connections but does not guarantee profitable outcomes, successful trade execution, or positive investment returns.
Automated trading systems carry substantial risks including but not limited to total capital loss, system failures, connectivity issues, and adverse market conditions. The extension's performance depends on multiple third-party services including PineConnector, MetaTrader platforms, TradingView infrastructure, and broker execution quality, any of which may experience downtime, technical failures, or service interruptions that could affect trading performance.
System Dependency Acknowledgment
The extension requires continuous operation of multiple interconnected systems: TradingView charts and alerts, PineConnector services and Expert Advisors, MetaTrader platforms, broker connectivity, and stable internet connections. Any interruption or malfunction in these systems may result in missed signals, failed executions, or unexpected trading behavior.
Users acknowledge that neither the seller nor the creator of this extension has control over these third-party services and cannot guarantee their availability, accuracy, or performance. Market conditions, broker execution policies, slippage, and technical factors may significantly affect actual trading results compared to theoretical or backtested performance.
Liability Limitation
By utilizing this extension, users acknowledge and agree that they assume full responsibility and liability for all trading decisions, financial outcomes, and potential losses resulting from the use of this automated trading system. Neither the seller nor the creator shall be liable for any unfavorable outcomes, financial losses, missed opportunities, or damages resulting from the development, use, malfunction, or performance of this extension.
Past performance of connected indicators, strategies, or the extension itself does not guarantee future results. Trading outcomes depend on numerous factors including market conditions, economic events, broker execution quality, network connectivity, and proper system configuration, all of which are beyond the control of the extension creator.
User Responsibility Statement
Users are solely responsible for understanding the risks associated with automated trading, properly configuring all system components, maintaining adequate capitalization and risk management, and regularly monitoring system performance. Users should thoroughly test the extension in demo environments before live deployment and should never risk more capital than they can afford to lose.
This extension is designed to automate signal execution but does not replace the need for proper risk management, market understanding, and trading discipline. Users should maintain active oversight of their automated trading systems and be prepared to intervene manually when necessary.

SEJKING - TimingSEJKING - Timing Indicator: Professional Session-Based Trading Tool
The SEJKING - Timing indicator is a sophisticated trading tool designed for intraday traders who focus on key market sessions. It provides visual cues for Asian, London, and New York trading sessions, highlights important price levels, and delivers volatility metrics - all in one comprehensive package.
Key Features:
Session Visualization:
Color-coded boxes for Asian (purple), London (gray), and New York (gray) sessions
Automatic Daylight Saving Time adjustments (2022-2025)
Customizable colors and visibility for each session
Volatility Measurement:
Real-time pip count calculations for each session
Visual labels showing range volatility (A=Asian, L=London, N=New York)
Critical Price Levels:
Daily Levels:
Previous day's high/low as black dashed lines (HOPD/LOPD)
Lines extend until 5 AM EST the following day
"HOPD" (High of Previous Day) and "LOPD" (Low of Previous Day) labels
Weekly Levels:
Previous week's high/low as orange dashed lines
Lines extend until following Wednesday at 5 AM EST
"WH" (Weekly High) and "WL" (Weekly Low) labels at line ends
Smart Timeframe Handling:
Auto-hides elements on higher timeframes (15-30 minute setting)
Special handling for Asian session on higher timeframes
Key Reference Lines:
Yesterday's high, low, and close
Weekly high and low levels
Option to display only on most recent bar
Benefits for Traders:
Session Awareness: Visually track active market sessions to align with peak volatility periods
Key Level Identification: Quickly spot crucial support/resistance from daily and weekly levels
Volatility Gauge: Measure session range strength through pip counts
Time-Based Analysis: Extended lines help identify which levels remain relevant throughout the trading day
DST-Proof: Automatically adjusts for global daylight saving time changes
Ideal For:
Forex traders focusing on London/NY sessions
Asian session specialists
Price action traders using previous day/week levels
Volatility-based strategies
Intraday traders needing session awareness
Input Options:
Toggle visibility for each trading session
Customize Asian session colors
Set maximum timeframe for box visibility (15-30 mins)
Choose to display key levels only on recent bars
How It Works:
The indicator automatically calculates session timings based on UTC-7 (US Mountain Time), with intelligent DST adjustments. At the start of each Asian session, it plots new daily and weekly levels, extending them to their respective expiration times (5 AM EST next day for daily, next Wednesday for weekly). Session boxes show the price range during each market open, with pip counts displayed at session close.
Trading Applications:
Use HOPD/LOPD as breakout or reversal levels
Trade bounces off weekly levels (WH/WL)
Identify low-volatility sessions for range trading
Spot high-volatility sessions for breakout strategies
Combine session boxes with key levels for confluence
Note: Optimized for Forex but works on all instruments. Asian session hours automatically adjust for non-Forex assets.

SMT DivergenceSMT Divergence Indicator
This powerful indicator identifies high-probability reversal points by detecting SMT (Smart Money Technique) divergences between two correlated assets. It spots subtle shifts in market momentum, revealing when one asset fails to confirm the price action of another—often signaling an impending trend change.
Key Features:
Inter-Market Divergence Detection: Automatically compares the price action of the main symbol with a second user-defined asset.
Identifies Key Reversals: Pinpoints both bullish and bearish SMT divergences, highlighting hidden strength in downtrends and underlying weakness in uptrends.
Customizable Pivot Detection: Allows fine-tuning of the pivot length to adjust sensitivity for different market conditions and timeframes.
Flexible Display Modes: Choose between clean 'Lines' connecting the diverging pivots or precise 'Labels' marking the exact high/low points.
Full Visual Customization: Complete control over the colors and line thickness for seamless integration with your existing chart layout.
Built-in Alerts: Stay notified of every potential opportunity with alerts for both bullish and bearish signals.
Settings:
Core Parameters:
Comparison Symbol: Select the second asset to compare against for divergence analysis (e.g., NQ1! if you are charting ES1!).
Pivot Length: Defines the number of bars to the left and right required to confirm a pivot high or low.
Visual Settings:
Display Style: Choose to visualize divergences as 'Lines' or 'Labels'.
Bearish/Bullish Color: Set custom colors for bearish and bullish divergence indicators.
Line Width: Adjust the thickness of the divergence lines for optimal visibility.
Perfect for traders who utilize inter-market analysis to confirm trade ideas. The SMT Divergence indicator provides a crucial edge by exposing non-confirmations between related assets, allowing for earlier and more confident entries into potential market reversals.

Big Move Follow-Through Tracker🚀 What This Indicator Does
Ever wondered if that sudden 5% pump in your favorite crypto will continue or just fade away? This powerful indicator automatically tracks every significant price move and tells you exactly what happened next - momentum continuation or mean reversion.
🎯 Key Features
📊 Smart Move Detection
Automatically identifies "big moves" based on your custom threshold (default 3%)
Uses ATR filtering to ensure moves are truly significant, not just normal volatility
Works on ANY timeframe and ANY crypto pair
🔍 Follow-Through Analysis
Tracks each big move for your specified number of bars (default 5)
Classifies outcomes as either Follow-Through (momentum continues) or Mean Reversion (price reverses)
Uses intelligent 2% thresholds to avoid noise and focus on meaningful moves
📈 Real-Time Statistics Dashboard
Live statistics table showing historical performance
Separate analysis for UP moves vs DOWN moves (crypto often behaves differently!)
Percentage breakdowns of follow-through vs reversion rates
Track total moves detected vs analyzed over time
🎨 Visual Clarity
Clear arrow signals when big moves are detected
Background highlighting during significant moves
Customizable display options - show/hide signals and stats as needed
🛠️ How to Use
Add to any crypto chart (works on BTC, ETH, altcoins, etc.)
Adjust the move threshold (3% for major coins, higher for smaller caps)
Set analysis timeframe (how many bars to track each move)
Watch the statistics build over time to understand your asset's behavior
💡 Trading Applications
For Momentum Traders:
High follow-through rates? → Consider riding the momentum
Trade in direction of big moves when statistics support it
For Mean Reversion Traders:
High reversion rates? → Look for fade opportunities
Counter-trade big moves when they historically reverse
For Risk Management:
Understand typical behavior after significant moves
Size positions based on historical follow-through probabilities
📋 Customizable Settings
Big Move Threshold: Adjust sensitivity (0.5% - 10%)
Analysis Period: How long to track each move (3-20 bars)
Display Options: Toggle signals and statistics table
Alert System: Get notified when big moves occur
🎲 What Makes This Different
Unlike simple momentum indicators, this tool:
✅ Quantifies actual outcomes with real statistics
✅ Adapts to each asset's unique volatility profile
✅ Separates up and down move behavior
✅ Provides actionable probability data
📊 Perfect For
Crypto day traders looking for edge identification
Swing traders wanting to understand momentum vs reversion tendencies
Risk managers needing probability-based position sizing
Strategy developers building data-driven trading systems
⚡ Quick Setup Tips
For Major Cryptos (BTC, ETH): Use 2-4% threshold
For Altcoins: Use 4-8% threshold
For Scalping: Use lower timeframes with 1-2% threshold
For Swing Trading: Use higher timeframes with 5%+ threshold

SAFE Leverage Pro x50Safe Leverage Pro x50 — Safe leverage based on timeframes
Description:
Safe Leverage Pro x50 is an indicator designed to help traders choose prudent and realistic leverage, tailored to the timeframe being traded and the asset chosen.
Based on rigorous statistical research, this indicator provides a visual recommendation of the maximum typical leverage by timeframe and automatically suggests a more conservative value (by default, half) for trading with greater peace of mind and risk control.
* The goal is not for the indicator to make decisions for you, but rather to support your pre-defined entry strategies, allowing you to clearly understand how much leverage you can use without compromising your account against normal price fluctuations.
*The indicator does not calculate based on real-time volatility or ATR, but rather relies on statistical historical patterns obtained by analyzing price behavior after entry, differentiating between average movements in long and short entries by timeframe.
Important: Before following the recommendations of this indicator, check the maximum leverage your broker or exchange allows for the asset you are trading, as it can vary significantly between platforms.
* Philosophy behind the indicator:
This project arises as a response to the simplistic discourse that condemns leverage without distinguishing nuances.
Leverage is not intrinsically bad. What is dangerous is leveraging without method, without awareness, and without risk management.
Safe Leverage Pro x50 is designed to change that narrative:
** It's not about whether or not to use leverage, but when, how much, and how to use it intelligently.

TreeCandlePattern-FusimetriaA Powerful 3-Candle Reversal Pattern Inspired by Smart Money Principles
How to Use the Indicator Effectively
This pattern works exceptionally well across higher timeframes (H4, Daily, Weekly) where institutional traders operate, often appearing at key turning points in the market.
Key Settings
Best Timeframes: H1 for intraday trades, H4/Daily for swing positions
Customisation Options: Adjust arrow colours (green for bullish, red for bearish) and size for better visibility
Alerts: Set notifications for when new signals appear to catch reversals early
The indicator automatically marks:
🔺 Bullish reversals (when price breaks under previous lows then surges back up)
🔻 Bearish reversals (when price spikes above prior highs then collapses)
The Trading Philosophy Behind the Pattern
This setup is remarkably similar to the classic "Power of Three" reversal structure, where:
The First Candle shows the final push of the current trend (either greed in an uptrend or fear in a downtrend)
The Second Candle traps retail traders by creating false breakouts (where smart money accumulates or distributes)
The Third Candle confirms the reversal by closing beyond the extreme of the second candle
Why This Works Like Smart Money Trading
Institutional traders often use these false breakouts to enter positions against the crowd
The third candle's close beyond the extreme shows absorption of liquidity (stops being taken out before reversal)
Works particularly well near key support/resistance levels where banks and hedge funds place their orders
Advanced Confirmation Techniques
To filter out false signals and trade like the professionals:
Volume Analysis
Look for higher volume on the second candle (shows strong institutional interest)
The third candle should ideally have lower volume as retail traders get trapped
Price Action Context
Works best after strong trends (not in ranging markets)
Combine with Fibonacci levels (61.8% retracements often see reversals)
Watch for wick rejections on the third candle (shows failure of breakout)
Example: Bitcoin (BTC/USDT) Daily Chart
!
After a long uptrend, price makes a false breakout above resistance (second candle)
The next candle closes below the second candle's low, confirming reversal
This was followed by a 30% drop as smart money exited longs
When to Enter & Exit Trades
✅ Entry: At the open of the fourth candle after confirmation
✅ Stop Loss: Just beyond the extreme of the second candle
✅ Take Profit: At nearest support/resistance level or using 1:2 risk-reward
⚠️ Avoid This Pattern In:
Choppy, sideways markets
During major news events when price action becomes erratic

Double Inside Body Candles with Box & Alert + 5-Bar LinesThis indicator identifies Double Inside Body Candle patterns, where:
Candle 1 is completely inside Candle 2,
Candle 2 is completely inside Candle 3 (the parent candle),
Candle 3 has a real body (not a doji or negligible body size).
Once the pattern is detected:
A label appears below the current candle.
A highlight box is drawn around Candle 3 (the parent candle) body range.
Horizontal lines are drawn from the top and bottom of Candle 3’s body and extend forward for exactly 5 bars to visualize potential breakout levels.
The script also detects and highlights breakouts:
🔼 Bullish breakout: if price closes above Candle 3's body high.
🔽 Bearish breakout: if price closes below Candle 3's body low.
Alerts are available for:
Double Inside Body pattern detection
Bullish breakout
Bearish breakout
Traders can use this script to identify consolidation periods (double inside bars), then monitor for breakout opportunities in either direction, using the 5-bar lines as short-term breakout levels.

Candle Range Detector by TradeTech AnalysisCandle Range Detector by TradeTech Analysis
This advanced indicator identifies and visualizes price compression zones based on inside bar formations, then tracks how price behaves around those zones — offering valuable insights into liquidity sweeps, range expansions, and trap/mitigation behavior.
The script builds upon the foundational concept of range-based price action, commonly used by institutional traders, and adds automation, mitigation tracking, and sweep detection to map how price reacts around these critical ranges.
🔍 How It Works:
• Range Formation: A new range is detected when the current candle forms entirely within the high and low of the previous candle (i.e., an inside bar). This behavior often indicates price compression and potential breakout zones.
• Range Extension: Once a range is confirmed, the script projects upper and lower boundaries (using either a percentage-based multiplier or Fibonacci log extension), providing context for expected breakout zones.
• Mitigation Tracking: The script continuously monitors whether price breaks above or below the projected extensions, marking that range as mitigated — useful for confirming whether liquidity was absorbed.
• Sweep Detection: If price re-visits a mitigated zone and shows signs of a liquidity sweep (via wick + close behavior), the indicator triggers visual sweep labels and optional alerts.
🧠 Optional Visual Enhancements:
• Highlight range-forming candles with light blue background (toggle on/off)
• Midpoint dotted line for symmetry analysis
• Labels for “Range High” and “Range Low” for visual clarity
• Dynamic box drawing that adapts upon mitigation or continuation
⚙️ Customizable Features:
• Choose between Normal and Fibonacci-based detection modes
• Toggle visibility of range boxes, extension lines, and sweep markers
• Configure sweep alerts, mitigation window size, and visual transparency
⸻
🧪 Use Cases
• Identify consolidation zones before major price moves
• Confirm liquidity sweeps for entry/exit traps
• Visualize and test mitigation behavior of past zones
• Combine with Order Flow or Volume Profile tools to enhance context
⸻
⚠️ This is a fully original implementation that goes beyond classical inside-bar scanners by incorporating mitigation, extension projection, and liquidity sweeps — making it a powerful tool for intraday, swing, and even Smart Money-based trading setups.

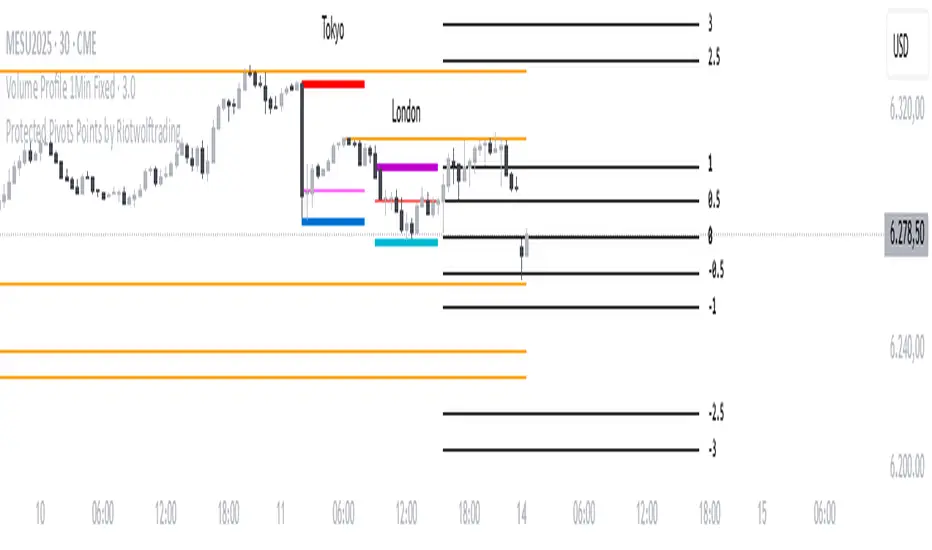
Protected Pivots Points by RiotwolftradingProtected Pivots Points by Riotwolftrading
---
You have an advanced visual tool designed for traders who want to identify and manage key price levels with maximum precision.
This script detects protected pivots (significant highs and lows) and marks them with horizontal lines on the chart. These lines automatically extend for a fixed number of bars or until price invalidates the level with a closing break.
---
🚀 What makes this indicator special?
---
✅ Protected pivot detection:
The indicator identifies protected highs and lows using a fixed pivot strength
✅ Wick break detection (liquidity sweep visualization):
When a wick crosses the pivot level **without the candle closing beyond the level, the indicator automatically changes the line’s color and style.
👉 This immediately shows the trader that the level was tested but remains structurally valid.
✅ Highly customizable visuals:
* Choose whether to show color for protected highs, lows, or wick break levels.
* Set your own colors, line styles (solid, dashed, dotted), and line widths.
---
### 🌟 Why is wick break detection so valuable?
---
💡 Instant context on price action:
No need to manually check every candle to see if a level was barely tested. The indicator changes the line’s appearance automatically, so you can focus on decisions.
💡 Clear distinction between untouched levels and tested levels:
* A level with no wick test is pristine support/resistance.
* A level tested by a wick but not invalidated is still valid — but may have been swept for liquidity.
💡 Crucial for precision trading strategies:
This is particularly important for strategies that rely on:
✅ Liquidity sweeps / stop hunts.
✅ Reversals from tested zones.
✅ Smart Money Concepts (SMC).
✅ ICT concepts, breakers, Quasimodo, BOS/MSS.
The wick break visualization helps filter false breakouts and highlights areas where institutional players may have stepped in.
💡 Avoid premature exits or entries:**
The color/style change tells you a level was tested but not broken, so you avoid overreacting to wick activity.
---
### ⚡ Example use case**
Imagine a protected low line:
🔹 Price dips and its wick touches the level — the line changes color (e.g. violet solid line).
🔹 The level is still valid because the close didn’t break it.
🔹 This could signal a stop hunt or liquidity grab, with a possible reversal opportunity right at that level.
---
### 🧭 **Why most pivot indicators don’t offer this**
Most pivot indicators:
❌ Simply mark the level and remove it after a close break.
❌ Don’t distinguish between a wick test and a true break.
🌟 **This indicator does — giving traders an extra layer of market insight.**
---
### ⚠ **Disclaimer**
This indicator is a visual aid to help identify key levels and price reactions. It does **not** generate buy or sell signals and should be used alongside your trading analysis and strategy.
---
S&P Power Hour Liquidity Sweep StrategyThis indicator is designed for intraday traders who want to take advantage of liquidity grabs, break of structure (BOS), and optimal entry points during the most volatile hours of the trading day: the NYSE Power Hours (09:30–10:30 AM and 02:30–04:00 PM EST).
Key Features:
Power Hour Detection:
Automatically identifies the two most liquid hours of the trading session.
Liquidity Sweep Detection:
Highlights when price sweeps a recent swing high or low — a common trap before reversals.
Break of Structure (BOS):
Confirms trend shift after a liquidity sweep with smart money-style BOS markers.
Fair Value Gap (FVG) Highlighting: (Optional)
Spot institutional imbalances between candles to fine-tune trade entries.
How It Works:
Wait for price to sweep a swing high or low during the power hours.
Look for a break of structure (BOS) in the opposite direction.
Enter on the next candle or FVG retest.
The indicator will plot a yellow circle for entry, a red line for stop, and a green line for the target (based on your RR setting).
Customizable Inputs:
Swing sensitivity (lookback bars)
Risk-to-reward ratio
Optional FVG visibility
Best Used With:
Higher timeframe bias (15m/1H)
Order blocks or volume analysis
Avoiding major news events
Whether you're a scalper or precision-based intraday trader, this tool helps you spot high-probability reversal setups with clean visuals and clear confirmations.

Liquidity Sweep Trap Alert (Improved)Detects high-conviction “liquidity sweep” traps (false breakouts) by comparing price against recent swing highs/lows, applying a wick-size filter and a cooldown period so that only meaningful reversal wicks trigger signals.
Shows labels on the chart and provides alert conditions when a trap occurs.
How It Works (Core Concept)
Swing High / Low Sweep
The script looks back a user-defined number of bars (Lookback Period) to identify the most recent swing high and swing low (excluding the current forming bar).
A Bull Trap is identified when price’s high exceeds that swing high intrabar but the candle closes back below it.
A Bear Trap is identified when price’s low dips below that swing low intrabar but the candle closes back above it.
Wick-Size Filter
To avoid tiny “micro-sweeps,” the script measures the length of the reversal wick (the distance beyond the swing high or below the swing low) as a percentage of the bar’s total range.
Only if this wick percentage ≥ Min Wick/Range % does the raw trap condition qualify for further consideration.
Cooldown Mechanism
After a trap fires, the same type of trap (bull or bear) is suppressed for a specified number of bars (Cooldown Bars).
This prevents back-to-back signals in choppy conditions and ensures each trap has breathing room before the next.
Confirmed on Close
Signals only trigger once the bar has closed (barstate.isconfirmed), eliminating “ghost” signals that flash intrabar and then vanish.
Chart Labels & Alerts
When a trap is confirmed, a label (“Trap ↑” for bull, “Trap ↓” for bear) is plotted above/below the bar (toggleable via Show Trap Labels).
Built-in alertcondition calls allow users to create native TradingView alerts tied to these confirmed traps.
Inputs & Usage
Lookback Period (bars)
Defines how many bars back to compute the recent swing high/low.
Shorter values catch more frequent, smaller swings; longer values focus on larger pivots.
Show Trap Labels
Toggle on/off the on-chart label markers.
Cooldown Bars
Number of bars to wait after a trap fires before allowing the same trap type again.
Higher values reduce signal frequency; set lower if you want more frequent triggers.
Min Wick/Range %
Minimum required wick length (beyond the swing level) as a percentage of that bar’s high–low range.
Increase to filter out weak or noise-driven sweeps; decrease if you want to capture smaller reversals.
Recommended Settings & Markets
Timeframes: Works on any timeframe (e.g., 5m, 15m, 1h, daily). Adjust inputs per instrument volatility.
Crypto (e.g., BTC): Typical starting values might be Lookback = 10, Min Wick % = 0.10–0.20, Cooldown = 3–5 bars.
Equities / Indices (e.g., Nifty, Bank Nifty): Use higher Min Wick % (e.g., 0.30–0.50) and adjust volume-based filters externally. Cooldown may be 3–5 bars on daily charts.
Testing: Always backtest or visually review sample signals before live trading. Tune Lookback and Min Wick % to balance hit-rate vs. false positives.
Originality & What Makes It Different
Beyond Simple Breakout Alerts: Instead of alerting on any breakout, this indicator specifically looks for false breakouts (liquidity sweeps) where smart money may trap retail stops.
Wick-Size Threshold: Many scripts flag any high above a swing high; here, the reversal wick must be a configurable percentage of the bar’s range, filtering out minor spikes.
Cooldown Logic: Prevents repeated signals in tight ranges, unlike basic breakout or pivot indicators that may fire repeatedly.
Confirmed on Close: Eliminates intrabar flicker signals, ensuring each alert is based on a completed bar.
Lightweight & Self-Contained: No external dependencies; works standalone on the chart. Users can hook native TradingView alerts to these conditions.
How to Use
Add to Chart: Apply the published script; no need for additional overlays.
Configure Inputs: Open settings and set:
Lookback Period to match swing size you target.
Min Wick/Range % to filter out small reversals.
Cooldown Bars so signals aren’t clustered.
Toggle Show Trap Labels on/off.
Set Alerts: In TradingView Alerts, choose “Bull Trap Detected” or “Bear Trap Detected” as the condition.
Interpret Signals:
Bull Trap: Price tried to break above a recent high but failed—potential short opportunity or exit long.
Bear Trap: Price tried to break below a recent low but failed—potential long opportunity or exit short.
Combine with Risk Management: Always apply your own stop-loss and take-profit rules; use the trap signal as one element of your trade decision.
Chart Examples & Annotations
Clean Example Chart: Display only this indicator on the chart using default inputs or example settings.
Annotation Guidance: If you include manual drawings in screenshots, clearly explain:
“Red label marks the bar where price spiked above the 10-bar swing high, closed below it with wick ≥ 10% of range, and no prior bull trap in last 5 bars → Bull Trap.”
Avoid unrelated scripts or decorative drawings that aren’t described.
Disclaimer
Not Financial Advice: Signals indicate potential reversal setups but do not guarantee outcomes. Trade at your own risk.
Use Proper Risk Management: Always define stop-loss, position size, and consider market context.
Test Before Live: Review historical signals and backtest manually or via strategy tester if possible.

ORB Breakout Indicator - NQ1!The purpose of this indicator is to assist traders in rapidly identifying high-probability Opening Range Breakout (ORB) setups on the NQ1! 1-minute time frame (Nasdaq Futures)
Key Features:
Opening Range: Automatically plots the high and low of the 1st 15min of the (NYSE session) (09:30–09:45 EST)
Breakout Signals : Illustrates the first candle that breaks upward or downward and:
Green arrow for a bullish breakout
Red arrow for a bearish breakout
Clean Visuals: Dynamic lines show the high and low of the ORB window for easy reference.
(DON'T USE THIS ONLY FOR ENTRY SIGNALS, PAIR THIS WITH OTHER INFLUENCES TO GET HIGH PROBABILITY BREAKOUTS)
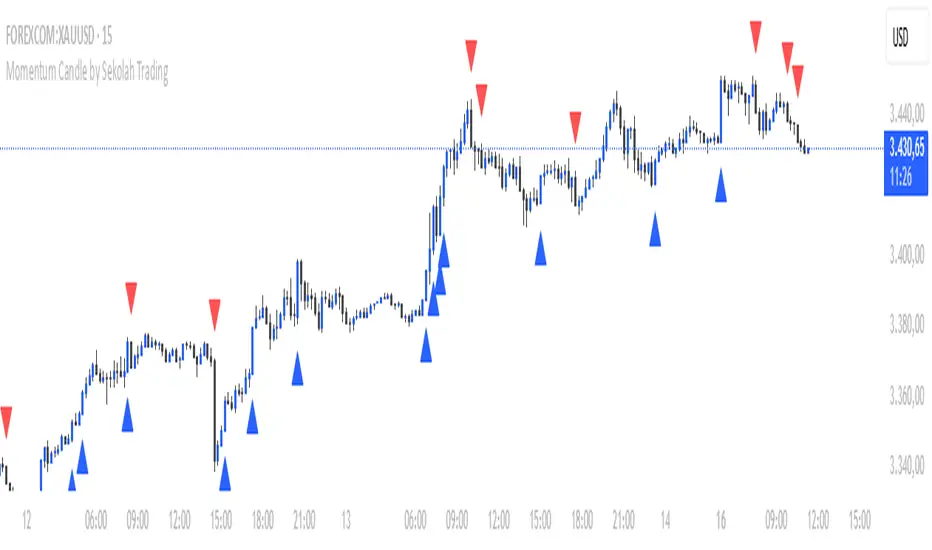
Momentum Candle by Sekolah Trading## 🔷 Introduction
**Momentum Candle by Sekolah Trading** is a proprietary price action tool that identifies high-conviction candles with large bodies and minimal wicks, based on dynamically adjusted thresholds tailored to each pair and timeframe. This script helps traders recognize moments of price acceleration that often precede breakouts, trend continuation, or sharp reversals.
---
## 🔷 What Makes This Script Unique (Originality & Utility)
Unlike traditional candle filters that rely on static size comparisons, this indicator uses:
- **Instrument-specific pip sensitivity**: Automatically detects if the pair is XAUUSD, JPY-based, or other Forex instruments.
- **Timeframe-based calibration**: Adjusts body size thresholds dynamically for 5m, 15m, 30m, and 1h.
- **Wick ratio control**: Validates only candles with short wicks (<30%), filtering indecisive moves.
- **Non-repainting logic**: Signals appear after candle close, with no future data lookahead.
This logic has been tested and refined internally by **Sekolah Trading**, designed for scalpers and intraday traders who rely on clean price action structure.
---
## 🔷 How It Works
1. **Pair & Timeframe Detection**
Adjusts `minRange` dynamically based on:
- Gold (XAUUSD), JPY pairs, or other Forex
- Timeframe: 5m to 1h
2. **Candle Structure Analysis**
- Calculates body = `abs(open - close)`
- Wick = `upper + lower shadows`
- Valid only if wick is under 30% of total candle
3. **Conditions for Signal**
- Body ≥ minRange
- Wick ≤ 30%
- Clear bullish or bearish direction
4. **Plots**
- 🔺 Blue triangle = Bullish momentum candle
- 🔻 Red triangle = Bearish momentum candle
---
## 🔷 How to Use
1. **Add to any 5m–1h chart**, ideally on XAUUSD or major Forex pairs
2. **Wait for signal triangle** to appear at the close of a candle
3. Use with:
- Trend indicators (MA, Supertrend, etc.)
- Support/resistance zones
- Breakout levels
4. **Set alerts** using:
`Momentum Candle (Body)`
---
## 🔷 Why This Script is Closed-Source
This indicator includes proprietary logic created by **Sekolah Trading** for professional and community use:
- Original dynamic pip sensitivity calibration
- Custom multi-condition filtering
- Non-reused, non-public logic with adaptive precision
The source is protected to prevent unauthorized duplication. However, all relevant logic and intent have been clearly explained above as required by TradingView’s House Rules.
---
## 🔷 Disclaimer
This indicator does not provide financial advice or guaranteed signals. Always combine with your own analysis and risk management. Historical performance does not guarantee future results.
---
## 🔷 Suggested Tags
`momentum`, `price action`, `breakout`, `forex`, `xauusd`, `jpy`, `scalping`, `candle`, `non-repainting`, `trend confirmation`
Top Right Watermark# TopRight Watermark
**Finally, a watermark that stays out of your way!**
Tired of TradingView's default watermark blocking your price action and technical analysis? This customizable watermark indicator gives you complete control over positioning and content display.
## 🎯 Key Features
**✅ Flexible Positioning** - Place anywhere: corners, sides, or edges
**✅ Multi-Slot Display** - Up to 3 customizable information slots
**✅ Individual Font Control** - Different sizes for each slot
**✅ Platform Compatibility** - TradingView OR MetaTrader timeframe formats
**✅ Clean & Professional** - Customizable colors and transparency
## 🔧 What You Can Display
- **Timeframe** - Current chart period
- **Ticker** - Symbol name (smart formatting for crypto/forex)
- **Exchange** - Broker/platform name
- **Custom Text** - Your own message
- **Empty** - Hide unused slots
## 🎨 Customization Options
- **Position**: 9 placement options (top/middle/bottom + left/center/right)
- **Colors**: Full color picker with transparency control
- **Font Sizes**: 5 sizes available per slot (tiny to huge)
- **Timeframe Style**: Choose TradingView (1m, 4H) or MetaTrader (M1, H4) format
## 🚀 Perfect For
- Traders who need clean chart visibility
- Multi-timeframe analysis
- Professional chart screenshots
- Platform migrants (MT4/MT5 to TradingView)
- Anyone wanting organized chart information
## 💡 Pro Tips
- Place in corners to avoid price action interference
- Combine Exchange + Ticker + Timeframe for complete context
- Use transparency to make it subtle but visible
**Stop letting watermarks interfere with your trading analysis. Take control of your chart display today!**
---
*Compatible with all TradingView chart types and timeframes. Easy setup with intuitive controls.*

Mariam Smart FlipPurpose
This tool identifies high-probability intraday reversals by detecting when price flips through the daily open after strong early-session commitment.
How It Works
A valid flip occurs when:
The previous daily candle is bullish or bearish
The first hour today continues in the same direction
Then, the price flips back through the daily open with a minimum break threshold (user-defined)
This setup is designed to catch liquidity grabs or fakeouts near the daily open, where early buyers or sellers get trapped after showing commitment
Signal Logic
Buy Flip
Previous day bearish → first hour bearish → price flips above open
Sell Flip
Previous day bullish → first hour bullish → price flips below open
Features
Configurable flip threshold in percentage
Signals only activate after the first hour ends
Daily open line displayed on chart
Simple triangle markers with no visual clutter
Alerts ready to use for automation or notifications
Usage Tips
Use "Once Per Bar" alert mode to get notified immediately when the flip happens
Works best in active markets like FX, indices, or crypto
Adjust threshold based on asset volatility
Suggested stop loss: use the previous daily high for sell flips or the previous daily low for buy flips
Suggested take profit: secure at least 30 pips to aim for a 1:3 risk-to-reward ratio on average

BOS mark-out (by Lumiere)Advanced BOS Detection with Strict Swing Confirmation
This indicator implements BOS detection with several unique features:
🔹 Dual-Candle Swing Validation - Unlike most BOS indicators that use single candle swings, this uses a two-candle confirmation for swing highs/lows, analyzing both the candle wicks and body transitions.
🔹 Directional Lock System - Implements a state machine that prevents duplicate signals until an opposite-direction BOS occurs, reducing noise.
🔹 Precision Wick Analysis - Compares wicks between the reversal candle and confirmation candle to identify the true swing point.
🔹 Real-Time Update & Live Market Adaptation – The indicator continuously monitors price action and instantly updates BOS signals as new candles form, ensuring you never miss a BOS.
How It Differs From Other BOS Indicators:
Most public BOS indicators use simple HH/HL or LH/LL detection.
Many don't implement the directional locking mechanism.
Few use the two-candle wick comparison approach.
Wick-Based Precision uses the extreme wicks of two candles (not just the body).
Strict Confirmation requires a close beyond the swing point (no "wick breaks" counted).
Usage Examples:
🟦 Bullish BOS:
A green candle closes, followed by a red candle. This will be the new high, and if the next candle closes above the highest wick of those two, it will be a BOS (only if we had a bearish BOS before)
🟥 Bearish BOS:
A red candle closes, followed by a green candle. This will be the new low, and if the next candle closes below the lowest wick of those two, it will be a BOS (only if we had a Bullish BOS before)

Path of Least ResistancePath of Least Resistance (PLR)
Concept Overview
The Path of Least Resistance indicator identifies key zones on your chart that act like "muddy" or "sticky" areas where price tends to get bogged down, creating choppy and unpredictable price action. Between these zones lie the "empty spaces" - clear paths where price can move freely with momentum and direction.
The Analogy: Muddy Fields vs Open Roads
Think of your chart like a landscape:
🟫 ZONES (Muddy/Sticky Areas)
Fair Value Gaps (FVGs) from higher timeframes
Pivot wick zones from higher timeframe pivots
Areas where price gets "stuck" and churns
Like walking through thick mud - slow, choppy, unpredictable movement
Price action becomes erratic and difficult to trade
🟢 EMPTY SPACES (Open Roads)
The clear areas between zones
Where price can move freely with momentum
Like driving on an open highway - smooth, directional movement
The "Path of Least Resistance" for price movement
Trading Philosophy
AVOID Trading Within Zones:
Price action is typically choppy and unpredictable
Higher probability of false signals and whipsaws
Like trying to drive through mud - you'll get stuck
TRADE Through the Empty Spaces:
Look for moves that travel between zones
Price tends to move with momentum and direction
Higher probability setups with cleaner price action
Like taking the highway instead of back roads
Zone Types Detected
Fair Value Gaps (FVGs)
Imbalances from higher timeframe candles
Areas where price "owes" a return visit
Often act as magnets, creating choppy price action
Pivot Wick Zones
Upper and lower wicks from higher timeframe pivots
Rejection areas where price previously struggled
Often create resistance/support that leads to choppy movement
Color Coding System
The zones dynamically change color based on current price position:
🔴 RED ZONES : Price is below the zone (bearish context)
🟢 GREEN ZONES : Price is above the zone (bullish context)
🔘 GRAY ZONES : Price is within the zone (neutral/choppy area)
The "Mum Trades" Strategy
The best trades - what we call "Mum trades" (trades so obvious even your mum could spot them) - happen in the empty spaces between zones:
✅ High Probability Characteristics:
Clear directional movement between zones
Less noise and false signals
Higher momentum and follow-through
Cleaner technical patterns
❌ Avoid These Areas:
Trading within the muddy zones
Expecting clean moves through sticky areas
Fighting against the natural flow of price
Key Features
Auto Timeframe Detection : Automatically selects appropriate higher timeframe
Dynamic Zone Management : Overlapping zones are automatically cleaned up
Real-time Alerts : Get notified when price enters/exits zones
Visual Clarity : Clean zone display with extending boundaries
How to Use
Identify the Zones : Let the indicator mark the muddy areas
Find the Paths : Look for clear spaces between zones
Plan Your Trades : Target moves that travel through empty space
Avoid the Mud : Stay away from trading within the zones
Follow the Flow : Trade with the path of least resistance
Remember
Price, like water, always seeks the path of least resistance. By identifying where that path is clear (empty spaces) versus where it's obstructed (zones), you can align your trading with the natural flow of the market rather than fighting against it.
The goal is simple: Trade the highways, avoid the mud.

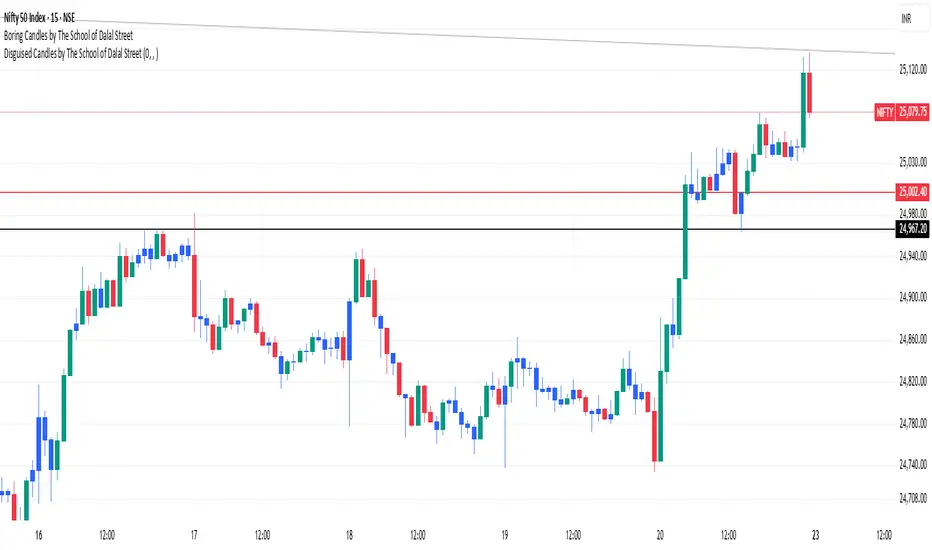
Boring Candles by The School of Dalal StreetThis indicator highlights the "boring" candles. These are candles where the body is less than 50% in length as compared to the high and low length. This allows us to quickly find the lower timeframe demand/supply without switching the chart timeframe. The use case is to quickly find our targets based on lower time frames.
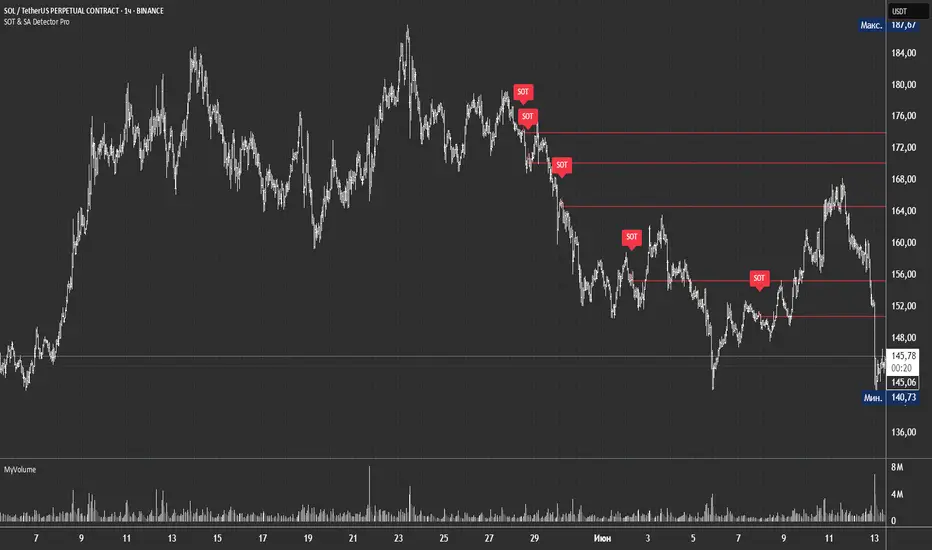
SOT & SA Detector ProSOT & SA Detector Pro- Advanced Reversal Pattern Recognition
OVERVIEW
The SOT & SA Detector is an educational indicator designed to identify potential market reversal points through systematic analysis of candlestick patterns, volume confirmation, and price wave structures. SOT (Shorting of Thrust) signals suggest potential bearish reversals after upward price movements, while SA (Selling Accumulation) signals indicate possible bullish reversals following downward trends. This tool helps traders recognize key market transition points by combining multiple technical criteria for enhanced signal reliability.
═══════════════════════════════════════════════════════════════
HOW IT WORKS
Technical Methodology
The indicator employs a multi-factor analysis approach that evaluates:
Wave Structure Analysis: Identifies minimum 2-bar directional waves (upward for SOT, downward for SA)
Price Delta Validation: Ensures closing price changes remain within specified percentage thresholds (default 0.3%) best 0.1.
Candlestick Tail Analysis: Measures rejection wicks using configurable tail multipliers
Volume Confirmation: Requires increased volume compared to previous periods
Pattern Confirmation: Validates signals through subsequent price action
Signal Generation Process
Pattern Recognition: Scans for qualifying candlestick formations with appropriate tail characteristics
Volume Verification: Confirms patterns with volume expansion using adjustable multiplier
Price Confirmation: Validates signals when price breaks and closes beyond pattern extremes
Signal Display: Places labeled markers and draws horizontal reference levels
Mathematical Foundation
Delta calculation: math.abs(close - close ) / close <= deltaPercent / 100
Tail analysis: (high - close ) >= tailMultiplier * (close - low ) for SOT
Volume filter: volume >= volume * volumeFactor
═══════════════════════════════════════════════════════════════
KEY FEATURES
Dual Pattern Recognition: Identifies both bullish (SA) and bearish (SOT) reversal candidates
Volume Integration: Incorporates volume analysis for enhanced signal validation
Customizable Parameters: Adjustable wave length, delta percentage, tail multiplier, and volume factor
Visual Clarity: Color-coded bar highlighting, labeled signals, and horizontal reference levels
Time-Based Filtering: Configurable analysis period to focus on recent market activity
Non-Repainting Signals: Confirmed signals remain stable and do not change with new price data
Alert System: Built-in notifications for both initial signals and subsequent confirmations
═══════════════════════════════════════════════════════════════
HOW TO USE
Signal Interpretation
Red SOT Labels: Appear above potential bearish reversal candles with downward-pointing markers
Green SA Labels: Display below potential bullish reversal candles with upward-pointing markers
Horizontal Lines: Extend from signal levels to provide ongoing reference points
Bar Coloring: Highlights qualifying pattern candles for visual emphasis
Trading Application
This indicator serves as an educational tool for pattern recognition and should be used in conjunction with additional analysis methods. Consider SOT signals as potential areas of selling pressure following upward moves, while SA signals may indicate buying interest after downward price action.
Best Practices
Combine with trend analysis and support/resistance levels
Consider overall market context and timeframe alignment
Use proper risk management techniques
Validate signals with additional technical indicators
═══════════════════════════════════════════════════════════════
SETTINGS
Analysis Days (Default: 20)
Controls the lookback period for signal detection. Higher values extend historical analysis while lower values focus on recent activity.
Minimum Bars in Wave (Default: 2)
Sets the minimum consecutive bars required to establish directional wave patterns. Increase for stronger trend confirmation.
Max Close Change % (Default: 0.3) best 0.1.
Defines acceptable closing price variation between consecutive bars. Lower values require tighter price consolidation.
Tail Multiplier (Default: 1.0) best 1.5 or more.
Adjusts sensitivity for candlestick tail analysis. Higher values require more pronounced rejection wicks.
Volume Factor (Default: 1.0)
Sets volume expansion threshold compared to previous period. Values above 1.0 require volume increases.
═══════════════════════════════════════════════════════════════
LIMITATIONS
Market Conditions
May produce false signals in highly volatile or low-volume conditions
Effectiveness varies across different market environments and timeframes
Requires sufficient volume data for optimal performance
Signal Timing
Signals appear after pattern completion, not in real-time during formation
Confirmation signals depend on subsequent price action
Historical signals do not guarantee future market behavior
Technical Constraints
Limited to analyzing price and volume data only
Does not incorporate fundamental analysis or external market factors
Performance may vary significantly across different trading instruments
═══════════════════════════════════════════════════════════════
IMPORTANT DISCLAIMERS
This indicator is designed for educational purposes and technical analysis learning. It does not constitute financial advice, investment recommendations, or trading signals. Past performance does not guarantee future results. Trading involves substantial risk of loss, and this tool should be used alongside proper risk management techniques and additional analysis methods.
Always conduct thorough analysis using multiple indicators and consider market context before making trading decisions. The SOT & SA patterns represent potential reversal points but do not guarantee price direction changes.
═══════════════════════════════════════════════════════════════
Credits: Original concept and Pine Script implementation by Everyday_Trader_X
Version: Pine Script v6 compatible
Category: Technical Analysis / Reversal Detection
Overlay: Yes (displays on price chart)
Volume Engulfing DetectorThis indicator is built to detect powerful shifts in market participation by analyzing volume surges during directional candles — not traditional "engulfing" patterns based on candle body structure, but volume-driven dominance by buyers or sellers.
Instead of relying on the classic visual engulfing pattern, it flags situations where a bullish or bearish candle prints with significantly higher volume than its predecessor, and where that volume also surpasses key benchmarks from previous opposing moves.
This approach is designed to capture institutional activity, smart money footprints, or hidden accumulation/distribution, which often manifest as volume spikes even in the absence of textbook candlestick formations.
🚦 Key Features
✅ 1. Volume-Based Engulfing Detection
The script identifies candles where:
A bullish candle's volume exceeds the previous candle’s total volume and the previous candle was bearish (and vice versa for bearish engulfing).
Additionally, the bullish engulfing volume must also be greater than the volume of the last bearish engulfing (and vice versa).
This helps filter out false engulfing signals and only highlights the ones with significant participation or conviction.
🔷 Plotted with: Vol↑Eng (Green label below candle)
🔻 Plotted with: Vol↓Eng (Red label above candle)
✅ 2. High-Volume Rejection Markers (Non-Engulfing)
Sometimes a candle doesn’t engulf the previous one, but the volume is so dominant that it may still indicate a powerful reversal or failed breakout. This indicator flags those too:
If a bullish candle has volume higher than any bearish engulfing volume seen today, it’s marked as a potential buy-side absorption.
If a bearish candle has volume higher than any bullish engulfing volume today, it may be a sign of sell-side rejection.
🟢 Plotted with: Vol↑Big (Lime triangle up)
🔴 Plotted with: Vol↓Big (Maroon triangle down)
⏰ Daily Reset & Filtering
All volume comparisons are done within the current trading day, so each day's context is treated independently.
The first candle of the day is ignored, preventing skewed signals due to overnight gaps or opening volatility.
🔔 Alerts Included
You can set alerts on:
Bullish or bearish volume-engulfing candles.
High-volume rejection candles.
This ensures you’re notified in real time when the market shows signs of strong accumulation or distribution, even if you're not actively monitoring the chart.
💡 Use Cases
Day Traders: Identify potential intraday reversals or trend initiations with volume confirmation.
Swing Traders: Use engulfing and high-volume patterns to time entries after pullbacks or breakouts.
Volume Analysts: Study how price responds when volume exceeds critical historical thresholds.
Tape Readers: Get a visual clue of where smart money might be stepping in based on volume surges.
📌 Final Thoughts
This indicator filters out noise and focuses on volume-dominant price actions, giving you a cleaner and more actionable view of the market. Use it to complement your existing strategy, particularly when looking for high-conviction turning points on the chart.
Whether you're trading equities, indices, or futures — this tool brings volume context to price action in a simple and visual way.

Candle Details on Mouse Hover
### Indicator Features
* **Hover for Details:** Move your mouse over any past candle to see its stats in a pop-up tooltip.
* **Live Info Label:** Shows a visible info box on the current, real-time candle.
* **Choose What You See:** Use checkboxes to turn on or off any section of the info:
* The candle's own size details.
* The comparison vs. the previous candle.
* The comparison vs. the next candle.
* **Smart "Avoid" Logic:** A switch to skip over opposite-colored candles and compare only against the last candle of the same type (e.g., Bullish vs. the last Bullish).
* *(This feature only works for the "Vs. Previous Candle" comparison.)*
* **Percentage vs. Ratio:** A dropdown to see comparisons as `+10.50%` or as a ratio like `1.10`.
* **Custom Hover Zone:** Settings to make the hover area bigger or smaller around each candle.
* **Custom Label Style:** Change the background and text color of the visible label on the last candle, or turn it off completely.
