FVG Trailing Stop [LuxAlgo]The FVG Trailing Stop indicator tracks unmitigated Fair Value Gaps (FVG) data to produce a Trailing Stop indicator able to determine if the market is uptrending or downtrending easily.
🔶 USAGE
The FVG Trailing Stop is intended to identify trend directions through its position relative to the closing price:
Bullish: Price is located above the Trailing Stop, indicating that all Bearish FVGs have been mitigated and the trend is anticipated to continue upwards.
Bearish State: Price is located below the Trailing Stop, indicating that all Bullish FVGs have been mitigated and the trend is anticipated to continue downwards.
The Trailing Stop originates from two extremities obtained from the average of respective unmitigated FVGs. The specific directional average is also displayed as a more transparent secondary line, however, the trailing stop is derived from this value and a new trend will not be detected until the opposite directional average is crossed.
Price reaching the Trailing Stop is caused by retracements and can lead to the following scenarios:
Outcome 1: The directional average is crossed next, indicating a new trend direction.
Outcome 2: The directional average is held as support or resistance, leading to a new impulse and a continuation of the trend.
🔹 Reset on Cross
While price crossing the Trailing Stop should be considered as a sign of an upcoming trend change; it is possible for the price to still evolve outside it.
As a solution, we have included the "Reset on Cross" feature, which (as the name suggests) hides and resets the Trailing Stop each time it is crossed, leading to a "Neutral" state.
This opens the opportunity for the Trailing Stop to be displayed again once the price moves again in the direction of the pre-established trend. A trader might use this to accumulate positions within a specific trend.
🔶 DETAILS
The script uses a typical identification method for FVGs. Once identified, the script collects the point of the FVG farthest from the current price when formed.
For Upwards FVGs this is the bottom of the FVG.
For Downwards FVGs this is the top of the FVG.
The data is managed only to use the last input lookback of FVGs. If an FVG is mitigated, it frees up a spot in the memory for a new FVG, however, if the lookback is full, the oldest will be deleted.
From there, it uses a "trailing" logic only to move the Trailing Stop in one direction until the trailing stop resets or the direction flips.
The extremities used to calculate the Trailing Stop are created from 2 calculation steps, the first step involves taking the raw average of the FVG mitigation levels, and the second step applies a simple moving average (SMA) smoothing of the precedent-obtained averages.
🔶 SETTINGS
Unmitigated FVG Lookback: Sets the maximum number of Unmitigated FVGs that the script will use.
Smoothing Length: Sets the smoothing length for the Trailing Stop to reduce erratic results.
Reset on Cross: When enabled, hide and reset the Trailing Stop until the price starts moving in the pre-established trend direction again.
Trend Analysis

AI Strat ATR Dinamico + ADX + Trend Adaptivo (No Repaint)Below is a fully self-contained, English-language description of every input, function, and logical block inside the “AI Strat ATR Dinamico + ADX + Trend Adaptivo (No Repaint)” indicator. You can copy and paste this into TradingView’s “Description” field when you publish, without exposing any Pine code.
---
## Indicator Name and Purpose
**Name (Short Title):**
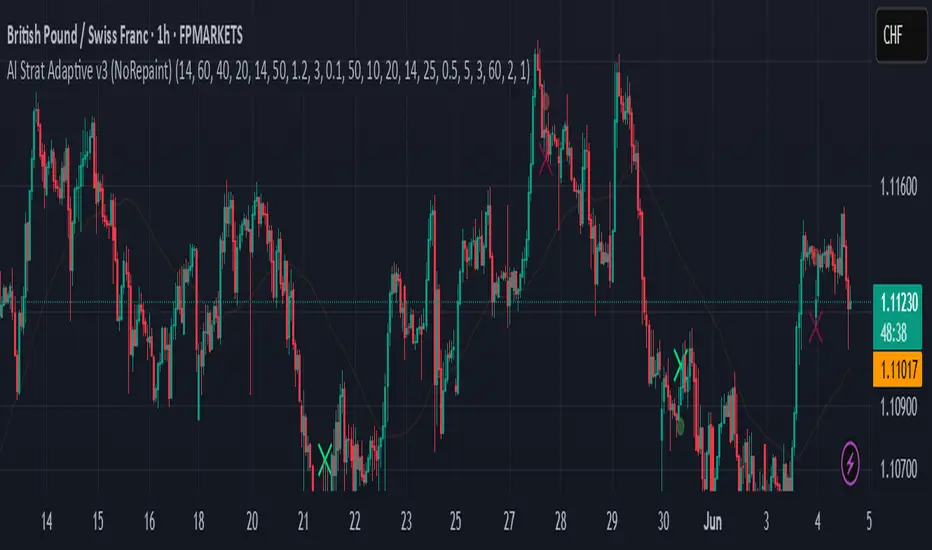
AI Strat Adaptive v3 (NoRepaint)
**Overview:**
This indicator combines multiple technical tools—RSI, EMA, ATR (with a dynamic multiplier), ADX/DI, and an “AI‐style” scoring mechanism—to generate trend-filtered and reversal signals. It also optionally confirms signals on a higher timeframe, dynamically adjusts its sensitivity based on volatility, and plots intrabar stop‐loss (SL) and take‐profit (TP) levels derived from ATR. Special care has been taken to ensure that no signals “repaint” (i.e., once drawn on a closed bar, they never disappear or shift).
---
## 1. Main Inputs
All of the inputs appear in the Settings dialog for the published indicator. Below is a detailed explanation of each input, grouped by logical category.
### A. RSI & EMA Base Parameters
1. **RSI Length (Base)**
* **Input type:** Integer (default 14)
* **Description:** Number of bars used to calculate the Relative Strength Index (RSI). A shorter RSI reacts more quickly to price changes; a longer RSI is smoother.
2. **RSI Overbought Threshold**
* **Input type:** Integer (default 60)
* **Description:** If the RSI value rises above this level, it contributes a “sell” signal component. You can adjust this (e.g., 70) to make your system more conservative.
3. **RSI Oversold Threshold**
* **Input type:** Integer (default 40)
* **Description:** If the RSI falls below this level, it contributes a “buy” signal component. Raising this threshold (e.g., 50) makes the strategy more aggressive in seeking reversals.
4. **EMA Length (Base)**
* **Input type:** Integer (default 20)
* **Description:** Number of bars for the Exponential Moving Average (EMA). A shorter EMA will produce more frequent crossovers, a longer EMA is smoother.
### B. ATR & Volatility Filter Parameters
5. **ATR Length (Base)**
* **Input type:** Integer (default 14)
* **Description:** Number of bars to calculate Average True Range (ATR). The ATR is used both for measuring volatility and for dynamic SL/TP levels.
6. **ATR SMA Length**
* **Input type:** Integer (default 50)
* **Description:** Number of bars to compute a Simple Moving Average of the ATR itself. This gives a baseline of “normal” volatility. If ATR rises significantly above this SMA, the indicator treats the market as “high volatility.”
7. **ATR Multiplier Base**
* **Input type:** Float (default 1.2, step 0.1)
* **Description:** Base multiplier for ATR when filtering for volatility. The actual threshold is computed as `ATR_SMA × (ATR_Multiplier Base) × sqrt(current_ATR / ATR_SMA)`. In other words, the multiplier becomes larger if volatility is rising, and smaller if volatility is falling.
8. **Disable Volatility Filter**
* **Input type:** Boolean (default false)
* **Description:** If enabled (true), the indicator will ignore any volatility‐based filtering, using signals regardless of ATR behavior. If disabled (false), signals only fire when ATR > (ATR\_SMA × dynamic multiplier).
### C. Price-Change & “AI Score” Parameters
9. **Price Change Period (bars)**
* **Input type:** Integer (default 3)
* **Description:** The number of bars back to measure percentage price change. Used to ensure that a “trend” signal is accompanied by a sufficiently positive (for longs) or negative (for shorts) price movement over this many bars.
10. **Base AI Score Threshold**
* **Input type:** Float (default 0.1)
* **Description:** The indicator computes a composite “AI-style” score by combining the RSI signal (overbought/oversold) and an EMA crossover signal. Only if the absolute value of that composite score exceeds this threshold will a trend signal be eligible. Raising it makes signals rarer but (potentially) higher-conviction.
### D. SMA “ICT” Trend Filter Parameters
11. **ICT SMA Long Length (Base)**
* **Input type:** Integer (default 50)
* **Description:** Number of bars for the “long” Simple Moving Average (SMA) used in the internal trend filter. Typically, price must be above this SMA (and ADX must be strong) to confirm an uptrend, or below it (and ADX strong) to confirm a downtrend.
12. **ICT SMA Short1 Length (Base)**
* **Input type:** Integer (default 10)
* **Description:** Secondary “fast” SMA used both for reversal logic (e.g., price crossing above it can count as a bullish reversal) and part of the internal trend confirmation.
13. **ICT SMA Short2 Length (Base)**
* **Input type:** Integer (default 20)
* **Description:** A second “medium” SMA used for reversal triggers (e.g., crossovers or crossunders alongside RSI conditions).
### E. ADX & DI Parameters
14. **Base ADX Length**
* **Input type:** Integer (default 14)
* **Description:** Number of bars for the ADX (Average Directional Index) moving averages, which measure trend strength. The same length is used for +DI and –DI smoothing.
15. **Base ADX Threshold**
* **Input type:** Float (default 25.0, step 0.5)
* **Description:** If ADX > this threshold and +DI > –DI, we consider an uptrend; if ADX > this threshold and –DI > +DI, we consider a downtrend. Raising this value demands stronger trends to qualify.
### F. Sensitivity & Cooldown
16. **Sensitivity (0–1)**
* **Input type:** Float between 0.0 and 1.0 (default 0.5)
* **Description:** A general “mixture” parameter used internally to weight how aggressively the indicator leans into trend versus reversal. In practice, the code uses it to fine-tune exact thresholds for switching between trend and reversal conditions. You can leave it at 0.5 unless you want to bias more heavily toward either regime.
17. **Base Cooldown Bars Between Signals**
* **Input type:** Integer (default 5, min 0)
* **Description:** Once a long or short signal fires, the indicator will wait at least this many bars before allowing a new signal in the same direction. Prevents “signal flipping” on each bar. A higher number forces fewer, more spaced-out entries.
18. **Trend Confirmation Bars**
* **Input type:** Integer (default 3, min 1)
* **Description:** After the directional filters (+DI/–DI cross, price vs. SMA), the indicator still requires that price remains on the same side of the long SMA for at least this many consecutive bars before confirming “trend up” or “trend down.” Larger values smooth out false breakouts but may lag signals.
### G. Higher Timeframe Confirmation
19. **Use Higher Timeframe Confirmation**
* **Input type:** Boolean (default true)
* **Description:** If true, the indicator will request a block of values (SMA, +DI, –DI, ADX) from a higher timeframe (default 60 minutes) and require that the higher timeframe is also in agreement (strong uptrend or strong downtrend) before confirming your current-timeframe trend. This helps filter out lower-timeframe noise.
20. **Higher Timeframe (TF) for Confirmation**
* **Input type:** Timeframe (default “60”)
* **Description:** The chart timeframe (e.g., 5, 15, 60 minutes) whose trend conditions must also be true. It’s sent through a `request.security(..., lookahead=barmerge.lookahead_off)` call so that it never “paints ahead.”
### H. Dynamic TP/SL Parameters
21. **TP as ATR Multiple**
* **Input type:** Float (default 2.0, step 0.1)
* **Description:** When a trade is open, the “take-profit” price is determined by looking at the highest high (for longs) or lowest low (for shorts) observed since entry, and then plotting a cross (“X”) at that level when the trend finally flips. This is purely for display. However, separate from that, this parameter can be adapted if you want a strictly ATR–based TP. In the “Minimal” version, TP is ≈ (highest high) once trend inverts, but you could rewrite it to use `entry_price + ATR×TP_Multiplier`.
22. **SL as ATR Multiple**
* **Input type:** Float (default 1.0, step 0.1)
* **Description:** While in a trade, a trailing SL line is plotted each bar. Its value is always `entry_price ± (ATR × SL_Multiplier)`. When the trend inverts, the SL no longer updates, and you see it on the chart.
### I. Display and Mode Options
23. **Show Debug Lines**
* **Input type:** Boolean (default true)
* **Description:** When enabled, the indicator will plot all intermediate lines—ATR SMA, ATR Threshold, +DI, –DI, ADX (current and HTF), HTF SMA, etc.—so that you can diagnose exactly what’s happening. Turn this off to hide all debug information and only see entry/exit shapes.
24. **Enable Scalping Mode**
* **Input type:** Boolean (default false)
* **Description:** If true, many of the “base” parameters are halved (e.g., RSI length becomes 7 instead of 14, ATR length becomes 7 instead of 14, ADX length becomes 7, etc.), and the ADX threshold is multiplied by 0.8. This makes all oscillators and moving averages more reactive, suited for very short-term (scalping) setups.
---
## 2. Core Calculation Blocks
Below is a high-level description of each logical block (in code order), translated from Pine into conceptual steps.
### A. Adjust Inputs if “Scalping Mode” Is On
If **Scalping Mode** = true, then:
* `RSI_Length` becomes `max(1, round(Base_RSI_Length / 2))`
* `EMA_Length` becomes `max(1, round(Base_EMA_Length / 2))`
* `ATR_Length` becomes `max(1, round(Base_ATR_Length / 2))`
* `Price_Change_Period` becomes `max(1, round(Base_Price_Change_Period / 2))`
* `SMA_Long_Length`, `SMA_Short1_Length`, and `SMA_Short2_Length` are each halved (minimum 1).
* `ADX_Length` = `max(1, round(Base_ADX_Length / 2))`
* `ADX_Threshold` = `Base_ADX_Threshold × 0.8`
* `Cooldown_Bars` = `max(0, round(Base_Cooldown_Bars / 2))`
Otherwise, all adjusted lengths = their base values.
### B. RSI, EMA & “AI Score” on Current Timeframe
1. **Compute RSI:**
* Uses the (possibly adjusted) `RSI_Length`.
* Denote this as `RSI_Value`.
2. **Compute ATR & Its SMA:**
* `ATR_Value` = `ta.atr(ATR_Length)`.
* `ATR_SMA` = `ta.sma(ATR_Value, ATR_SMA_Length)`.
* Then define `Volatility_Increase` = (`ATR_Value > ATR_SMA`).
* If the volatility has increased, the weighting of RSI vs. EMA changes.
3. **Compute Weights:**
* If `Volatility_Increase == true`, then:
* `RSI_Weight = 0.7`
* `EMA_Weight = 0.3`
* Otherwise:
* `RSI_Weight = 0.3`
* `EMA_Weight = 0.7`
4. **RSI Signal Component (`RSI_Sig`):**
* If `RSI_Value > RSI_Overbought`, then `RSI_Sig = –1`.
* Else if `RSI_Value < RSI_Oversold`, then `RSI_Sig = +1`.
* Otherwise, `RSI_Sig = 0`.
5. **EMA Value & Signal Component (`EMA_Sig`):**
* `EMA_Value` = `ta.ema(close, EMA_Length)`.
* `EMA_Sig = +1` if the current close crosses **above** the EMA; `EMA_Sig = –1` if the current close crosses **below** the EMA; else `0`.
6. **Compute Raw “AI Score”:**
$$
Raw\_AI = (RSI\_Sig \times RSI\_Weight)\;+\;(EMA\_Sig \times EMA\_Weight)
$$
Then,
$$
AI\_Score = \frac{Raw\_AI}{(RSI\_Weight + EMA\_Weight)}
$$
(This normalization ensures the score always ranges between –1 and +1 if both weights sum to 1.)
### C. Dynamic ATR Multiplier & Volatility Filter
1. **Volatility Factor:**
$$
Volatility\_Factor = \frac{ATR\_Value}{ATR\_SMA}
$$
2. **Dynamic ATR Multiplier:**
$$
ATR\_Multiplier = ATR\_Multiplier\_Base \times \sqrt{Volatility\_Factor}
$$
3. **High Volatility Condition (`High_Volatility`):**
* If `Disable_Volatility_Filter == true`, then treat `High_Volatility = true` always.
* Else, `High_Volatility = (ATR_Value > ATR_SMA × ATR_Multiplier)`.
### D. Price Change Percentage
* **Compute Price Change:**
$$
Price\_Change = \frac{(Close - Close )}{Close } \times 100
$$
* This is the percent return from `Price_Change_Period` bars ago to now.
* For a valid long‐trend signal, we require `Price_Change > 0`; for a short trend, `Price_Change < 0`.
### E. Local SMAs for Trend/Reversal Filters
* `SMA_Close_Long` = `ta.sma(close, SMA_Long_Length)`.
* `SMA_Close_Short1` = `ta.sma(close, SMA_Short1_Length)`.
* `SMA_Close_Short2` = `ta.sma(close, SMA_Short2_Length)`.
These three SMAs help define the “local trend” and reversal breakout points:
* **Primary Trend Filter:**
* Price must be above `SMA_Close_Long` for an uptrend filter, or below `SMA_Close_Long` for a downtrend filter.
* **Reversal Filter:**
* A bullish reversal is detected if **(RSI < Oversold AND close crosses above EMA)** OR **(RSI < Oversold AND close crosses above SMA\_Close\_Short1)**.
* A bearish reversal is detected if **(RSI > Overbought AND close crosses below EMA)** OR **(RSI > Overbought AND close crosses below SMA\_Close\_Short1)**.
### F. Manual +DI, –DI & ADX on Current Timeframe
Instead of relying on the built-in `ta.adx`, the script calculates DI and ADX manually. This makes it easier to replicate the exact logic on a higher timeframe via `request.security`. The steps are:
1. **Directional Movement (DM) Components:**
* `Up_Move` = `high – high `
* `Down_Move` = `low – low`
* `Plus_DM` = `Up_Move` if (`Up_Move > Down_Move` AND `Up_Move > 0`), else `0`
* `Minus_DM` = `Down_Move` if (`Down_Move > Up_Move` AND `Down_Move > 0`), else `0`
2. **True Range (TR) Components:**
* `TR1` = `high – low`
* `TR2` = `abs(high – close )`
* `TR3` = `abs(low – close )`
* `True_Range` = `max(TR1, TR2, TR3)`
3. **Smoothed Averages (RMA):**
* `Sm_TR` = `ta.rma(True_Range, ADX_Length)`
* `Sm_Plus` = `ta.rma(Plus_DM, ADX_Length)`
* `Sm_Minus`= `ta.rma(Minus_DM, ADX_Length)`
4. **Compute DI%:**
$$
Plus\_DI = \frac{Sm\_Plus}{Sm\_TR} \times 100,\quad
Minus\_DI = \frac{Sm\_Minus}{Sm\_TR} \times 100
$$
5. **DX and ADX:**
$$
DX = \frac{|Plus\_DI - Minus\_DI|}{Plus\_DI + Minus\_DI} \times 100,\quad
ADX = ta.rma(DX, ADX_Length)
$$
These values are referred to as `(plus_di, minus_di, adx_val)` for the current timeframe.
---
## 3. Higher Timeframe (HTF) Confirmation Function
If **Use Higher Timeframe Confirmation** is enabled, the script calls a single helper (Pine) function `f_htf` with two parameters: the ADX length and the SMA length (both taken from the “base” or “scaled” values). Internally, `f_htf` simply reruns the manual DI/ADX logic (same as above) on the higher timeframe’s bar data, and also includes that timeframe’s closing price and its SMA for trend comparison.
* **Request.Security Call:**
```
= request.security(
syminfo.tickerid,
higher_tf,
f_htf(adx_length, sma_long_len),
lookahead=barmerge.lookahead_off
)
```
* `lookahead=barmerge.lookahead_off` ensures that no HTF value “paints” early; you always see only confirmed HTF bars.
* The returned tuple provides:
1. `ht_close` = HTF closing price
2. `ht_sma` = HTF SMA of length `sma_long_len`
3. `ht_pdi` = HTF +DI percentage
4. `ht_mdi` = HTF –DI percentage
5. `ht_adx` = HTF ADX value
---
## 4. Trend & Reversal Filters (Current & HTF)
### A. Current-Timeframe Trend Filter
1. **Uptrend\_Basic (Current TF)**
$$
(plus\_di > minus\_di)\;\land\;(adx\_val > ADX\_Threshold)\;\land\;(close > SMA\_Close\_Long)
$$
2. **Downtrend\_Basic (Current TF)**
$$
(minus\_di > plus\_di)\;\land\;(adx\_val > ADX\_Threshold)\;\land\;(close < SMA\_Close\_Long)
$$
3. **Trend Confirmation by Bars:**
* `Bars_Since_Below` = number of bars since `close <= SMA_Close_Long`.
* `Bars_Since_Above` = number of bars since `close >= SMA_Close_Long`.
* If `Uptrend_Basic == true` AND `Bars_Since_Below ≥ Trend_Confirmation_Bars` → mark `Uptrend_Confirm = true`.
* If `Downtrend_Basic == true` AND `Bars_Since_Above ≥ Trend_Confirmation_Bars` → mark `Downtrend_Confirm = true`.
### B. Reversal Filters (Current TF)
1. **Bullish Reversal (`Rev_Bullish`):**
* If `(RSI < RSI_Oversold AND close crosses above EMA_Value)` OR
`(RSI < RSI_Oversold AND close crosses above SMA_Close_Short1)`
→ then `Rev_Bullish = true`.
2. **Bearish Reversal (`Rev_Bearish`):**
* If `(RSI > RSI_Overbought AND close crosses below EMA_Value)` OR
`(RSI > RSI_Overbought AND close crosses below SMA_Close_Short1)`
→ then `Rev_Bearish = true`.
### C. Higher-Timeframe Trend Filter (HTF)
1. **HTF Uptrend (`HT_Uptrend`):**
$$
(ht\_pdi > ht\_mdi)\;\land\;(ht\_adx > ADX\_Threshold)\;\land\;(ht\_close > ht\_sma)
$$
2. **HTF Downtrend (`HT_Downtrend`):**
$$
(ht\_mdi > ht\_pdi)\;\land\;(ht\_adx > ADX\_Threshold)\;\land\;(ht\_close < ht\_sma)
$$
3. **Combine Current & HTF:**
* If **Use\_HTF\_Confirmation == true**, then:
* `Uptrend_Confirm := Uptrend_Confirm AND HT_Uptrend`
* `Downtrend_Confirm := Downtrend_Confirm AND HT_Downtrend`
* Otherwise, just use the current timeframe’s `Uptrend_Confirm` and `Downtrend_Confirm`.
4. **Define `CurrentTrend` (Integer):**
* `CurrentTrend = +1` if `Uptrend_Confirm == true`.
* `CurrentTrend = –1` if `Downtrend_Confirm == true`.
* Otherwise, `CurrentTrend = 0`.
5. **Reset “One Trade Per Trend”:**
* There is a persistent variable `LastTradeTrend`.
* Every time `CurrentTrend` flips (i.e., `CurrentTrend != CurrentTrend `), the code sets `LastTradeTrend := 0`.
* That allows one new entry once the detected trend has changed.
---
## 5. One‐Time “Cooldown” Logic
* **`LastSignalBar`**
* A persistent integer (initially undefined).
* After each confirmed long or short entry, `LastSignalBar` is set to the bar index where that signal fired.
* **`Bars_Since_Signal`**
* If `LastSignalBar` is undefined, treat as a very large number (so that initial signals are always allowed).
* Otherwise, `Bars_Since_Signal = bar_index – LastSignalBar`.
* **Cooldown Check:**
* A new long (or short) can only be generated if `(Bars_Since_Signal > Signal_Cooldown)`.
* This prevents multiple signals in rapid succession.
---
## 6. Entry Conditions (No Repaint)
All of the conditions below are calculated “intrabar,” but the script only actually registers a **signal** on **bar close** (`barstate.isconfirmed`) so that signals never repaint.
### A. Trend‐Based “Raw” Conditions
1. **Trend\_Long\_Raw:**
$$
(AI\_Score > AI\_Score\_Threshold)\;\land\;Uptrend\_Confirm\;\land\;High\_Volatility\;\land\;(Price\_Change > 0)
$$
2. **Trend\_Short\_Raw:**
$$
(AI\_Score < -AI\_Score\_Threshold)\;\land\;Downtrend\_Confirm\;\land\;High\_Volatility\;\land\;(Price\_Change < 0)
$$
### B. Reversal “Raw” Conditions
1. **Rev\_Long\_Raw:**
$$
Rev\_Bullish\;\land\;(CurrentTrend eq +1)
$$
2. **Rev\_Short\_Raw:**
$$
Rev\_Bearish\;\land\;(CurrentTrend eq -1)
$$
### C. Combine Raw Signals
* `Raw_Long = Trend_Long_Raw OR Rev_Long_Raw`.
* `Raw_Short = Trend_Short_Raw OR Rev_Short_Raw`.
### D. Confirmed Long/Short Signal Flags
On each new bar **close** (`barstate.isconfirmed == true`):
* **Long\_Signal\_Confirmed** can fire if:
1. `Raw_Long == true`
2. `LastTradeTrend != +1` (we haven’t already taken a long in this same trend)
3. `Bars_Since_Signal > Signal_Cooldown`
If all three hold, then on this bar close the code sets:
* `Long_Signal = true`
* `LastTradeTrend := +1`
* `LastSignalBar := bar_index`
Otherwise, `Long_Signal := false` on this bar.
* **Short\_Signal\_Confirmed** works the same way but with `Raw_Short`, `LastTradeTrend != -1`, etc.
If triggered, it sets `Short_Signal = true`, `LastTradeTrend := -1`, and `LastSignalBar := bar_index`. Otherwise `Short_Signal := false`.
* **Important:** If the bar is still forming (`else` branch of `barstate.isconfirmed`), then both `Long_Signal` and `Short_Signal` are forced to `false`. This guarantees that no shape or alert appears until the bar actually closes.
---
## 7. Plotting Entry/Exit Shapes
1. **Trend Long Signal (Triangle Up)**
* Condition: `Long_Signal == true` **AND** `Trend_Long_Raw == true`.
* Appearance: A small, semi-transparent lime green triangle drawn **below** the bar.
2. **Trend Short Signal (Triangle Down)**
* Condition: `Short_Signal == true` **AND** `Trend_Short_Raw == true`.
* Appearance: A small, semi-transparent maroon triangle drawn **above** the bar.
3. **Reversal Long Signal (Circle)**
* Condition: `Long_Signal == true` **AND** `Rev_Long_Raw == true`.
* Appearance: A tiny, more transparent green circle drawn **below** the bar.
4. **Reversal Short Signal (Circle)**
* Condition: `Short_Signal == true` **AND** `Rev_Short_Raw == true`.
* Appearance: A tiny, more transparent red circle drawn **above** the bar.
Since `Long_Signal` and `Short_Signal` only ever become true at bar close, these shapes are never repainted or removed once drawn.
---
## 8. Unified Alert Message
* As soon as a new bar closes with either `Long_Signal` or `Short_Signal == true`, an alert message is sent:
* If `Long_Signal`, then `alert_msg = "action=BUY"`.
* If `Short_Signal`, then `alert_msg = "action=SELL"`.
* If neither, `alert_msg = ""` (no alert).
* The code calls `alert(alert_msg, freq=alert.freq_once_per_bar)` only if `barstate.isconfirmed` and `alert_msg` is non‐empty. This ensures exactly one alert per confirmed bar, no intrabar pops.
---
## 9. Dynamic TP/SL Logic (Minimal Implementation)
Once a long or short position is “open,” the script tracks these variables:
1. **Persistent Flags and Prices** (all persist between bars until reset):
* `InLong` (Boolean)
* `InShort` (Boolean)
* `Long_Max` (Float)
* `Short_Min` (Float)
* `Entry_Price` (Float)
2. **On Bar Close:**
* If `Long_Signal == true` →
* Set `InLong := true`,
* `Entry_Price := close` of that bar,
* `Long_Max := high ` (last bar’s high, so that we’re not using “future” data).
* If `Short_Signal == true` →
* Set `InShort := true`,
* `Entry_Price := close`,
* `Short_Min := low `.
3. **While `InLong == true`:**
* Continuously update `Long_Max = max(Long_Max, current high)` on each bar (intrabar, but finalized each close).
* Compute a dynamic SL:
$$
SL_{Long} = Entry\_Price - (ATR \times SL\_ATR\_Multiplier).
$$
* If **current trend** flips to non-uptrend (`CurrentTrend != +1`), mark `ExitLong = true`.
* Then the routine plots `TP_Long = Long_Max` as a cross (“X”) at that level.
* Set `InLong := false` so that no further changes to `Long_Max` or `Entry_Price` happen on future bars.
4. **While `InShort == true`:**
* Continuously update `Short_Min = min(Short_Min, current low)`.
* Compute a dynamic SL:
$$
SL_{Short} = Entry\_Price + (ATR \times SL\_ATR\_Multiplier).
$$
* If trend flips to non-downtrend (`CurrentTrend != –1`), mark `ExitShort = true`.
* Then the routine plots `TP_Short = Short_Min`.
* Set `InShort := false` to freeze those values.
5. **Plotting TP/SL if “Show Debug” is On:**
* **TP Shapes:**
* When `ExitLong == true`, plot a solid lime “X” at `TP_Long` (highest high).
* When `ExitShort == true`, plot a solid maroon “X” at `TP_Short` (lowest low).
* **SL Lines:**
* If still `InLong`, draw a thin red line at `SL_Long` on each bar.
* If still `InShort`, draw a thin green line at `SL_Short`.
Thus, your charts visually show the highest‐high take-profit cross for longs, the lowest-low take-profit cross for shorts, and a continuously updating trailing SL until the trend flips. Because all of this is triggered on confirmed bars, nothing “jumps around” after the fact.
---
## 10. Debug‐Only Plot Lines (When Enabled)
When **Show Debug Lines** = true, the indicator will also plot:
1. **ATR SMA (Orange):**
* The simple moving average of ATR over `ATR_SMA_Length`.
2. **ATR Threshold (Yellow):**
* `ATR_SMA × ATR_Multiplier` (the dynamically scaled threshold).
3. **+DI & –DI (Current TF):**
* +DI plotted as a green line, –DI plotted as a red line (opacity \~70%).
4. **ADX (Current TF, Blue):**
* A blue line for the present timeframe’s ADX.
5. **ADX Threshold (Gray):**
* A horizontal gray line showing `ADX_Threshold`.
6. **+DI & –DI (HTF, Darker Colors):**
* If HTF confirmation is on, “HTF +DI” is a greener but more transparent line; “HTF –DI” is a redder but more transparent line.
7. **ADX (HTF, Blue but Transparent):**
* HTF ADX plotted in blue (high transparency).
8. **HTF SMA (Orange, Transparent):**
* The higher timeframe’s SMA (same length as `SMA_Long_Length`), drawn in fainter orange.
9. **Volatility Zone Fill (Yellow Tinted Area):**
* Fills the area between `ATR_SMA` and `ATR_SMA × ATR_Multiplier`.
* Indicates “normal” versus “high‐volatility” regimes.
These debug lines are purely visual aids. Disable them if you want a cleaner chart.
---
## 11. Putting It All Together — Step-By-Step Flow
1. **Read Inputs** (RSI lengths, EMA length, ATR settings, etc.).
2. **Optionally Halve All Lengths** if “Scalping Mode” is checked.
3. **Calculate Current TF Indicators:**
* RSI, ATR, ATR\_SMA, EMA, price change, various SMAs, DI/ADX.
4. **Compute “AI Score”** (weighted sum of RSI and EMA signals).
5. **Compute Dynamic ATR Multiplier** and decide if “High Volatility” is true.
6. **Compute Raw Trend/Reversal Conditions** on the current timeframe (without triggering yet).
7. **Fetch HTF Values** in one `request.security` call (SMAs, DI/ADX).
8. **Combine Current & HTF Trend Filters** to confirm `Uptrend_Confirm` or `Downtrend_Confirm`.
9. **Check Reversal Conditions** (price crossing EMA or SMA short, in overbought/oversold zones).
10. **Enforce “One Trade Per Trend”** (clear `LastTradeTrend` whenever `CurrentTrend` flips).
11. **Enforce Cooldown** (must wait at least `Signal_Cooldown` bars since the prior signal).
12. **On Bar Close:**
* If `Raw_Long` AND not already in a long trend AND cooldown met, then fire `Long_Signal`.
* Else if `Raw_Short` AND not already in a short trend AND cooldown met, then fire `Short_Signal`.
* Otherwise, no new signal on this bar.
13. **Plot Long/Short Entry Shapes** according to whether it was a Trend signal or a Reversal signal.
14. **Send Alert** (“action=BUY” or “action=SELL”) exactly once per confirmed bar.
15. **If New Long/Short Signal, Set `InLong`/`InShort`, Record Entry Price, Initialize `Long_Max`/`Short_Min`.**
16. **While `InLong` is true:** Update `Long_Max = max(previous Long_Max, current high)`. Compute `SL_Long`. If the current trend flips (no longer uptrend), set `ExitLong = true`, plot a “TP X,” and close the position logic.
17. **While `InShort` is true:** Similarly update `Short_Min`, compute `SL_Short`, and if trend flips, set `ExitShort = true`, plot a “TP X,” and close the position logic.
18. **Optionally Display Debug Lines** (ATR SMA, ATR threshold, DI/ADX, HTF DI/ADX, etc.).
---
## 12. How to Use in TradingView Community
When you publish this indicator to the TradingView community—choosing “Protected” or “Invite-only” visibility—you can paste the above description into the “Description” field. Users will see exactly what each input does, how signals are generated, and what the various plotted lines represent, **without ever seeing the script source**. In this way, the code itself remains hidden but the logic is fully documented.
1. **Go to “Create New Indicator”** on TradingView.
2. **Paste Your Pine Code** (the full indicator script) in the Pine editor and save it.
3. **Set Visibility = Protected** (or Invite-only).
4. **In the “Description” Text Box, paste the entirety of this document** (steps 1–11).
5. **Click “Publish Script.”**
Users who view your indicator will see its name (“AI Strat Adaptive v3 (NoRepaint)”), a list of all inputs (with default values), and the detailed English description above. They can then load it on any chart, adjust inputs, and see the plotted signals, TP/SL lines, and optional debug overlays—without accessing the underlying Pine code.
---
### Summary of Key Points
* **RSI, EMA, ATR, DI/ADX, and “AI Score”** work together to define “trend vs. reversal.”
* **Dynamic volatility filter** uses ATR and ATR\_SMA to adapt the weighting of RSI vs. EMA and decide whether “volatility is high enough” to permit a trend trade.
* **One trade per detected trend** and a **cooldown period** prevent over‐trading.
* **Higher timeframe confirmation** (optional) further filters out noise.
* **No-repaint logic**:
* All signals only appear at bar close (`barstate.isconfirmed`).
* HTF values are fetched with `lookahead=barmerge.lookahead_off`.
* **Entry shapes** (triangles and circles) clearly mark trend vs. reversal entries.
* **Dynamic TP/SL**: highest‐high (or lowest‐low) since entry is used as TP, ATR×multiplier as SL.
* **Debug mode** (optional) shows every intermediate line for full transparency.
Use this description verbatim (or adapt it slightly for your personal style) when publishing. That way, your community sees exactly how each component works—inputs, functions, filters—while the Pine source code remains private.
Kaufman Trend Strength Signal█ Overview
Kaufman Trend Strength Signal is an advanced trend detection tool that decomposes price action into its underlying directional trend and localized oscillation using a vector-based Kalman Filter.
By integrating adaptive smoothing and dynamic weighting via a weighted moving average (WMA), this indicator provides real-time insight into both trend direction and trend strength — something standard moving averages often fail to capture.
The core model assumes that observed price consists of two components:
(1) a directional trend, and
(2) localized noise or oscillation.
Using a two-step Predict & Update cycle, the filter continuously refines its trend estimate as new market data becomes available.
█ How It Works
This indicator employs a Kalman Filter model that separates the trend from short-term fluctuations in a price series.
Predict & Update Cycle : With each new bar, the filter predicts the price state and updates that prediction using the latest observed price, producing a smooth but adaptive trend line.
Trend Strength Normalization : Internally, the oscillator component is normalized against recent values (N periods) to calculate a trend strength score between -100 and +100.
(Note: The oscillator is not plotted on the chart but is used for signal generation.)
Filtered MA Line : The trend component is plotted as a smooth Kalman Filter-based moving average (MA) line on the main chart.
Threshold Cross Signals : When the internal trend strength crosses a user-defined threshold (default: ±60), visual entry arrows are displayed to signal momentum shifts.
█ Key Features
Adaptive Trend Estimation : Real-time filtering that adjusts dynamically to market changes.
Visual Buy/Sell Signals : Entry arrows appear when the trend strength crosses above or below the configured threshold.
Built-in Range Filter : The MA line turns blue when trend strength is weak (|value| < 10), helping you filter out choppy, sideways conditions.
█ How to Use
Trend Detection :
• Green MA = bullish trend
• Red MA = bearish trend
• Blue MA = no trend / ranging market
Entry Signals :
• Green triangle = trend strength crossed above +Threshold → potential bullish entry
• Red triangle = trend strength crossed below -Threshold → potential bearish entry
█ Settings
Entry Threshold : Level at which the trend strength triggers entry signals (default: 60)
Process Noise 1 & 2 : Control the filter’s responsiveness to recent price action. Higher = more reactive; lower = smoother.
Measurement Noise : Sets how much the filter "trusts" price data. High = smoother MA, low = faster response but more noise.
Trend Lookback (N2) : Number of bars used to normalize trend strength. Lower = more sensitive; higher = more stable.
Trend Smoothness (R2) : WMA smoothing applied to the trend strength calculation.
█ Visual Guide
Green MA Line → Bullish trend
Red MA Line → Bearish trend
Blue MA Line → Sideways/range
Green Triangle → Entry signal (trend strengthening)
Red Triangle → Entry signal (trend weakening)
█ Best Practices
In high-volatility conditions, increase Measurement Noise to reduce false signals.
Combine with other indicators (e.g., RSI, MACD, EMA) for confirmation and filtering.
Adjust "Entry Threshold" and noise settings depending on your timeframe and trading style.
❗ Disclaimer
This script is provided for educational purposes only and should not be considered financial advice or a recommendation to buy/sell any asset.
Trading involves risk. Past performance does not guarantee future results.
Always perform your own analysis and use proper risk management when trading.

ZigZag Levels (Polytrends Method)Overview
This is a comprehensive technical analysis indicator that identifies price trends, support/resistance levels, and containment patterns on trading charts. It uses advanced zigzag analysis to detect trend reversals and automatically draws key levels that traders can use for decision-making.
Key Features
Trend Analysis
Zigzag Pattern Detection: Automatically identifies significant highs and lows to create a clean trend visualization
Multi-Timeframe Support: Analyze trends from any timeframe while viewing on your preferred chart timeframe
Trend Direction Alerts: Real-time notifications when trend direction changes
Support & Resistance Levels
Automatic Level Detection: Identifies key horizontal support and resistance levels based on historical price action
Smart Level Filtering: Option to show only the most relevant levels to avoid chart clutter
Customizable Level Count: Control how many support and resistance levels are displayed
Containment Analysis
Range-Bound Detection: Highlights when price is trading within defined boundaries
Visual Containment Alerts: Color-coded system to show when price breaks out of or remains within established ranges
How to Use
Getting Started
Add the Indicator: Apply Polytrends Free to your chart from the indicators menu
Configure Basic Settings: Start with the main toggle switches to enable the features you want
Customize Appearance: Adjust colors, line styles, and sizes to match your chart preferences
Essential Settings
Trend Display
Display Trend: Master toggle to show/hide all trend analysis elements
Target Time Frame: Select which timeframe to use for trend analysis (leave blank for chart timeframe)
Containment: Enable to highlight when price is contained within previous ranges
Level Settings
Enable Levels: Master toggle for support/resistance level display
Above/Below: Set how many resistance levels (above price) and support levels (below price) to show
Filter Levels: When enabled, shows only the most significant levels without intermediary ones
Max Levels: Maximum number of levels the indicator will track (reduce if experiencing performance issues)
Understanding the Visual Elements
Trend Lines
Yellow Lines: Current active trend connections
Red Lines: Contained price action (when containment is enabled)
Dotted Lines: Most recent trend segment
Support & Resistance Levels
Horizontal Lines: Key price levels where price has previously reacted
Price Labels: Exact price values displayed on the right side of levels (when enabled)
Timeframe Labels: Shows which timeframe generated each level (when enabled)
Advanced Configuration
Visual Customization
Line Styles: Choose between solid, dashed, or dotted lines for trends and levels
Line Width: Adjust thickness from 1-50 pixels
Colors: Customize colors for different trend states and level types
Label Sizes: Set font size for price and timeframe labels
Performance Optimization
Relevance Factor: Controls how far back the indicator looks for levels (higher values = more historical data)
Max Levels: Limit the total number of levels tracked to improve performance
Price Offset: Adjust horizontal position of price labels
Practical Applications
For Day Traders
Use lower timeframes (15m, 1H) for intraday support/resistance levels
Enable containment detection to identify breakout opportunities
Set alerts for trend direction changes
For Swing Traders
Analyze daily or 4-hour timeframes for major trend direction
Focus on key support/resistance levels for entry and exit points
Use level filtering to see only the most significant price levels
For Position Traders
Use weekly or monthly timeframes for long-term trend analysis
Identify major support/resistance zones for portfolio allocation decisions
Monitor containment patterns for market structure changes
Alert System
The indicator provides three types of alerts:
Direction Changed: Triggers when trend direction changes (either bullish to bearish or vice versa)
Bullish Direction: Specifically triggers when trend changes from bearish to bullish
Bearish Direction: Specifically triggers when trend changes from bullish to bearish
To set up alerts, use TradingView's alert system and select the appropriate Polytrends alert condition.
Best Practices
Setup Recommendations
Start with default settings and gradually customize based on your trading style
Use higher timeframes for trend direction and lower timeframes for precise entries
Enable containment analysis during ranging markets
Reduce max levels if chart becomes cluttered
Interpretation Tips
Treat support/resistance levels as zones rather than exact prices
Look for confluence between multiple timeframe levels
Use containment patterns to identify potential breakout setups
Confirm trend changes with other technical indicators
Troubleshooting
Performance Issues
Reduce the "Max Levels" setting
Lower the "Relevance Factor"
Disable features you're not actively using
Too Many/Few Levels
Adjust "Above" and "Below" settings to control level quantity
Use "Filter Levels" to show only the most significant levels
Modify "Relevance Factor" to change how far back the indicator looks
Visual Clarity
Adjust line width and colors for better visibility
Use different line styles to distinguish between trend types
Modify label sizes based on your screen resolution
Limitations
The indicator works best on liquid markets with clear trend patterns
Very choppy or low-volume markets may produce less reliable signals
Performance may be affected on lower-end devices with very high "Max Levels" settings
Historical levels are based on past price action and don't predict future movements

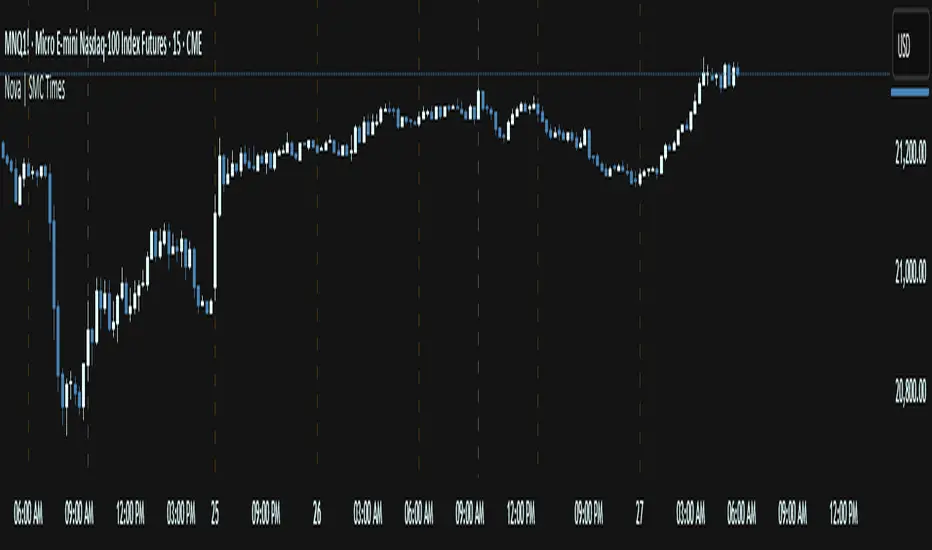
Nova SMC Key TimesThe Nova SMC Key Times is a focused TradingView® indicator tailored for futures traders who want clear visual markers at key session transitions. Designed with simplicity in mind, it automatically plots two dashed vertical lines each trading day to highlight the pre-market and official market-open times (adjusted for Micro E-mini S&P 500 and Micro Gold contracts).
Pre-Market Marker: A semi-transparent white dashed line drawn at the start of pre-market activity, helping you observe early liquidity movements and potential order accumulation.
Market-Open Marker: A fully opaque white dashed line at the exact opening bar of the main session, providing a clear reference for breakout attempts and volatility spikes.
Because LSF detects the appropriate timestamps based on the loaded symbol (MES1! or MGC1!), you never need to manually set session times. If applied to other symbols, it remains silent, ensuring that charts stay uncluttered.
You can easily customize line colors to match your visual preferences under the provided style settings. By visually framing these two critical moments each day, Nova LSF helps traders anticipate stop hunts, breakout retests, and initial momentum moves—making it a useful complement to any liquidity-oriented or order-flow strategy.
CISD Levels by HAZEDCISD Levels by HAZED - Advanced Market Structure Analysis
📊 Overview
The CISD Levels indicator is a sophisticated market structure analysis tool that automatically identifies and plots critical support and resistance levels based on Change in State Direction (CISD) methodology. This indicator helps traders visualize key market turning points and potential breakout/breakdown levels with precision.
🎯 What are CISD Levels?
CISD (Change in State Direction) levels represent significant price points where market sentiment shifts from bullish to bearish or vice versa. These levels are dynamically calculated based on:
Market structure breaks (higher highs/lower lows)
Pullback patterns and trend continuations
Real-time price action analysis
Dynamic level updates as market conditions evolve
✨ Key Features
🔥 Smart Level Detection
Automatically identifies bullish (+CISD) and bearish (-CISD) levels
Real-time updates as market structure evolves
Intelligent pullback detection algorithm
🎨 Full Customization
Colors: Customize bullish/bearish level colors
Line Styles: Choose from solid, dotted, or dashed lines
Text Labels: Fully customizable text, size, and font options
Transparency: Adjustable line transparency (0-100%)
Extensions: Control how far lines extend into the future
📈 Historical Analysis
Show All Levels: Option to display historical CISD levels
Max Levels Control: Limit the number of historical levels shown (1-50)
Level Management: Automatic cleanup of old levels
🚨 Smart Alerts
Bullish Alerts: Get notified when price breaks above +CISD levels
Bearish Alerts: Get notified when price breaks below -CISD levels
Alert Frequency: Choose between "Once Per Bar" or "Once Per Bar Close"
📊 Statistics Table
Market State: Current bullish/bearish market condition
Active Levels: Count of currently active CISD levels
Latest Levels: Display of most recent +CISD and -CISD values
Positioning: 5 different table positions available
🛠️ How to Use
For Swing Traders:
Use CISD levels as key support/resistance zones
Enter positions on level breaks with proper risk management
Set stop losses below/above opposite CISD levels
For Day Traders:
Watch for price reactions at CISD levels
Use levels for entry/exit timing
Combine with volume analysis for confirmation
For Position Traders:
Identify major market structure changes
Use higher timeframe CISD levels for strategic entries
Monitor level breaks for trend continuation signals
⚙️ Settings Guide
CISD Level Settings
Bullish/Bearish Colors: Customize level appearance
Custom Text: Add your own labels to levels
Alert Setup: Enable notifications for level breaks
Historical Levels: Choose to show past levels for context
Appearance Customization
Line Width: 1-5 pixel thickness options
Line Style: Solid, dotted, or dashed
Extension Bars: Control future projection (1-50 bars)
Text Options: Size, font, and bold formatting
Statistics Table
Enable/Disable: Toggle table visibility
Position: 5 placement options on chart
Real-time Data: Live market state and level information
🎯 Best Practices
Multi-Timeframe Analysis: Use CISD levels across different timeframes for confluence
Risk Management: Always use proper position sizing and stop losses
Confirmation: Combine with volume, momentum, or other indicators
Market Context: Consider overall market conditions and news events
Backtesting: Test the levels on historical data before live trading
📋 Technical Specifications
Overlay: True (plots directly on price chart)
Max Lines: 500 (handles multiple historical levels)
Max Labels: 500 (supports extensive labeling)
Real-time Updates: Dynamic level calculation and alerts
Performance: Optimized code for smooth chart operation
🚀 Why Choose CISD Levels?
Precision: Advanced algorithm for accurate level identification
Flexibility: Extensive customization options for any trading style
Reliability: Proven market structure analysis methodology
User-Friendly: Intuitive settings with helpful tooltips
Professional: Clean, professional appearance on any chart
📞 Support & Updates
This indicator is actively maintained and updated. For questions, suggestions, or feature requests, feel free to reach out through TradingView messaging.
⚠️ Disclaimer: This indicator is for educational and informational purposes only. Always conduct your own analysis and risk management. Past performance does not guarantee future results.

OA - SMESSmart Money Entry Signals (SMES)
The SMES indicator is developed to identify potential turning points in market behavior by analyzing internal price dynamics, rather than relying on external volume or sentiment data. It leverages normalized price movement, directional volatility, and smoothing algorithms to detect potential areas of accumulation or distribution by market participants.
Core Concepts
Smart Money Flow calculation based on normalized price positioning
Directional VHF (Vertical Horizontal Filter) used to enhance signal directionality
Overbought and Oversold regions defined with optional glow visualization
Entry and Exit signals based on dynamic crossovers
Highly customizable input parameters for precision control
Key Inputs
Smart Money Flow Period
Smoothing Period
Price Analysis Length
Fibonacci Lookback Length
Visual toggle options (zones, glow effects, signal display)
Usage
This tool plots the smoothed smart money flow as a standalone oscillator, designed to help traders identify potential momentum shifts or extremes in market sentiment. Entry signals are generated through crossover logic, while optional filters based on price behavior can refine those signals. Exit signals are shown when the smart money line exits extreme regions.
Important Notes
This indicator does not repaint
Works on all timeframes and instruments
Best used as a confirmation tool with other technical frameworks
All calculations are based strictly on price data
Disclaimer
This script is intended for educational purposes only. It does not provide financial advice or guarantee performance. Please do your own research and apply appropriate risk management before making any trading decisions.

Kaufman Trend Strategy# ✅ Kaufman Trend Strategy – Full Description (Script Publishing Version)
**Kaufman Trend Strategy** is a dynamic trend-following strategy based on Kaufman Filter theory.
It detects real-time trend momentum, reduces noise, and aims to enhance entry accuracy while optimizing risk.
⚠️ _For educational and research purposes only. Past performance does not guarantee future results._
---
## 🎯 Strategy Objective
- Smooth price noise using Kaufman Filter smoothing
- Detect the strength and direction of trends with a normalized oscillator
- Manage profits using multi-stage take-profits and adaptive ATR stop-loss logic
---
## ✨ Key Features
- **Kaufman Filter Trend Detection**
Extracts directional signal using a state space model.
- **Multi-Stage Profit-Taking**
Automatically takes partial profits based on color changes and zero-cross events.
- **ATR-Based Volatility Stops**
Stops adjust based on swing highs/lows and current market volatility.
---
## 📊 Entry & Exit Logic
**Long Entry**
- `trend_strength ≥ 60`
- Green trend signal
- Price above the Kaufman average
**Short Entry**
- `trend_strength ≤ -60`
- Red trend signal
- Price below the Kaufman average
**Exit (Long/Short)**
- Blue trend color → TP1 (50%)
- Oscillator crosses 0 → TP2 (25%)
- Trend weakens → Final exit (25%)
- ATR + swing-based stop loss
---
## 💰 Risk Management
- Initial capital: `$3,000`
- Order size: `$100` per trade (realistic, low-risk sizing)
- Commission: `0.002%`
- Slippage: `2 ticks`
- Pyramiding: `1` max position
- Estimated risk/trade: `~0.1–0.5%` of equity
> ⚠️ _No trade risks more than 5% of equity. This strategy follows TradingView script publishing rules._
---
## ⚙️ Default Parameters
- **1st Take Profit**: 50%
- **2nd Take Profit**: 25%
- **Final Exit**: 25%
- **ATR Period**: 14
- **Swing Lookback**: 10
- **Entry Threshold**: ±60
- **Exit Threshold**: ±40
---
## 📅 Backtest Summary
- **Symbol**: USD/JPY
- **Timeframe**: 1H
- **Date Range**: Jan 3, 2022 – Jun 4, 2025
- **Trades**: 924
- **Win Rate**: 41.67%
- **Profit Factor**: 1.108
- **Net Profit**: +$1,659.29 (+54.56%)
- **Max Drawdown**: -$1,419.73 (-31.87%)
---
## ✅ Summary
This strategy uses Kaufman filtering to detect market direction with reduced lag and increased smoothness.
It’s built with visual clarity and strong trade management, making it practical for both beginners and advanced users.
---
## 📌 Disclaimer
This script is for educational and informational purposes only and should not be considered financial advice.
Use with proper risk controls and always test in a demo environment before live trading.

Curved Trend Channels (Zeiierman)█ Overview
Curved Trend Channels (Zeiierman) is a next-generation trend visualization tool engineered to adapt dynamically to both linear and non-linear market behavior. It introduces a novel curvature-based channeling system that grows over time during trending conditions, mirroring the natural acceleration of price trends, while simultaneously leveraging adaptive range filtering and dual-layer candle trend logic.
This tool is ideal for traders seeking smooth yet reactive dynamic channels that evolve with market structure. Whether used in curved mode or traditional slope mode, it provides exceptional clarity on trend transitions, volatility compression, and breakout development.
█ How It Works
⚪ Adaptive Range Filter Foundation
The core of the system is a volatility-based range filter that determines the underlying structure of the bands:
Pre-Smoothing of High/Low Data – Highs and lows are smoothed using a selectable moving average (SMA, EMA, HMA, KAMA, etc.) before calculating the volatility range.
Volatility Envelope – The range is scaled using a fixed factor (2.618) and further adjusted by a Band Multiplier to form the primary envelope around price.
Smoothed Volatility Curve – Final bands are stabilized using a long lookback, ensuring clean visual structure and trend clarity.
⚪ Curved Channel Logic
In Curved Mode, the trend channel grows over time when the trend direction remains unchanged:
Base Step Size (× ATR) – Sets the minimum unit of slope change.
Growth per Bar (× ATR) – Defines the acceleration rate of the channel slope with time.
Trend Persistence Recognition – The longer a trend persists, the more pronounced the slope becomes, mimicking real market accelerations.
This dynamic, time-dependent logic enables the channel to "curve" upward or downward, tracking long-standing trends with increasing confidence.
⚪ Trend Slope
As an alternative to curved logic, traders can activate a regular Trend slope using:
Slope Length – Determines how quickly the trend line adapts to price shifts.
Multiplicative Factor – Amplifies the sensitivity of the slope, useful in fast-moving markets or lower timeframes.
⚪ Candle Trend Confirmation
A robust second-layer trend detection method, the Candle Trend System evaluates directional pressure by analyzing smoothed price action:
Multi-tier Smoothing – Trend lines are derived from short-, medium-, and long-term candle movement.
█ How to Use
⚪ Trend Identification
When the Trend Line direction and Candle Colors are in agreement, this indicates strong, persistent directional conviction. Use these moments to enter with trend confirmation and manage risk more confidently.
⚪ Retest
During ongoing trends, the price will often pull back into the dynamic channel. Look for:
Support/resistance interactions at the upper or lower bands.
█ Settings
Scaled Volatility Length – Controls the historical depth used to stabilize the volatility bands.
Smoothing Type – Choose from HMA, KAMA, VIDYA, FRAMA, Super Smoother, etc. to match your asset and trading style.
Volatility MA Length – Smoothing length for the calculated range; shorter = more reactive.
High/Low Smoother Length – Additional smoothing to reduce noise from spikes or false pivots.
Band Multiplier – Widens or tightens the band range based on personal preference.
Enable Curved Channel – Toggle between curved or regular trend slope behavior.
Base Step (× ATR) – The starting point for curved slope progression.
Growth per Bar (× ATR) – How much the slope accelerates per bar during a sustained trend.
Slope – Reactivity of the standard trend line to price movements.
Multiplicative Factor – Sensitivity adjustment for HyperTrend slope.
Candle Trend Length – Lookback period for trend determination from candle structure.
-----------------
Disclaimer
The content provided in my scripts, indicators, ideas, algorithms, and systems is for educational and informational purposes only. It does not constitute financial advice, investment recommendations, or a solicitation to buy or sell any financial instruments. I will not accept liability for any loss or damage, including without limitation any loss of profit, which may arise directly or indirectly from the use of or reliance on such information.
All investments involve risk, and the past performance of a security, industry, sector, market, financial product, trading strategy, backtest, or individual's trading does not guarantee future results or returns. Investors are fully responsible for any investment decisions they make. Such decisions should be based solely on an evaluation of their financial circumstances, investment objectives, risk tolerance, and liquidity needs.

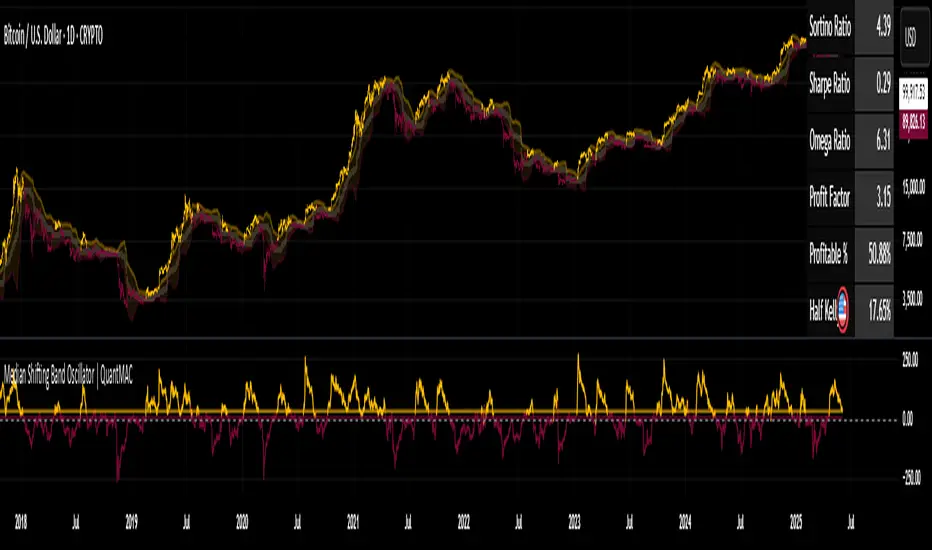
Median Shifting Band Oscillator | QuantMAC📊 Median Shifting Band Oscillator | QuantMAC
🚀 Revolutionary Trend Analysis with Integrated Performance Metrics
The Median Shifting Band Oscillator (MSBO) is a sophisticated technical analysis tool that combines dynamic median-based band calculations with a powerful oscillator to deliver precise trend identification across all market conditions and asset classes.
🎯 Core Features & Functionality
📈 Advanced Median Band Technology
Dynamic median calculation using customizable lookback periods (default 54 bars)
Adaptive standard deviation bands that adjust to market volatility
Real-time band positioning with visual overlay on price charts
Intelligent band fill visualization for enhanced trend clarity
⚡Precision Oscillator System
Normalized oscillator ranging from -50 to +50 for consistent readings
Customizable threshold levels for long (80) and short (54) signals
Multi-timeframe compatibility with real-time signal generation
Color-coded visualization with 9 professional color schemes
📊 Integrated Performance Dashboard
Real-time metrics calculation with professional statistics
Comprehensive risk metrics: Sharpe, Sortino, Omega ratios
Advanced position sizing with Half Kelly percentage
Maximum drawdown tracking and profit factor analysis
Customizable metrics table positioning (6 locations available)
🛠️ Trading Modes & Flexibility
🎭 Dual Trading Strategies
Long/Short Mode: Full bidirectional trading with short positions
Long/Cash Mode: Conservative approach with cash positions during bearish signals
🎨 Visual Customization
9 professional color schemes (Classic through Classic9)
Configurable date range limiter for backtesting
Force overlay plots for seamless chart integration
Dynamic bar coloring based on trend direction
📈 Performance Metrics Suite
The MSBO includes a comprehensive metrics table displaying:
Risk Analysis: Maximum Drawdown %, Sharpe Ratio, Sortino Ratio
Performance Metrics: Net Profit %, Profit Factor, Win Rate %
Advanced Statistics: Omega Ratio, Half Kelly %, Total Trades
Real-time Updates: Live calculation with every bar confirmation
🌍 Universal Asset Compatibility
✅ Cryptocurrencies - Bitcoin, altcoins, and DeFi tokens
✅ Stock Markets - Individual stocks, ETFs, and indices
🎯 Key Advantages
🔄 Adaptive Intelligence
The median-based approach provides superior noise filtering compared to traditional moving averages, automatically adjusting to changing market volatility patterns.
⚡ Real-time Precision
Advanced signal generation with customizable thresholds ensures optimal entry and exit timing while minimizing false signals.
📊 Professional Analytics
Built-in performance tracking eliminates the need for external backtesting tools, providing instant strategy validation and optimization insights.
🎨 User Experience
Intuitive interface with professional-grade customization options suitable for both retail traders and institutional analysts.
🚀 Getting Started
Add the indicator to your chart
Configure your preferred color scheme and trading mode
Adjust threshold levels based on your risk tolerance
Enable the metrics table for performance tracking
Set date range for historical analysis (optional)
💡 Pro Tips
Trend Confirmation: Use oscillator position relative to zero line for primary trend bias
Signal Quality: Higher threshold values reduce signal frequency but increase accuracy
Multi-Timeframe: Combine with higher timeframe analysis for enhanced precision
Risk Management: Monitor Half Kelly % for optimal position sizing guidance
---
🏆 Professional-Grade Tool for Serious Traders
The Median Shifting Band Oscillator represents the evolution of technical analysis, combining time-tested statistical methods with modern computational power to deliver actionable trading insights across all market conditions.
💬 Questions? Comments? Share your them below! 👇
---
📝 Disclaimer: This indicator is for educational and informational purposes only. Past performance does not guarantee future results. Always conduct your own analysis and manage risk appropriately.
CNN Statistical Trading System [PhenLabs]📌 DESCRIPTION
An advanced pattern recognition system utilizing Convolutional Neural Network (CNN) principles to identify statistically significant market patterns and generate high-probability trading signals.
CNN Statistical Trading System transforms traditional technical analysis by applying machine learning concepts directly to price action. Through six specialized convolution kernels, it detects momentum shifts, reversal patterns, consolidation phases, and breakout setups simultaneously. The system combines these pattern detections using adaptive weighting based on market volatility and trend strength, creating a sophisticated composite score that provides both directional bias and signal confidence on a normalized -1 to +1 scale.
🚀 CONCEPTS
• Built on Convolutional Neural Network pattern recognition methodology adapted for financial markets
• Six specialized kernels detect distinct price patterns: upward/downward momentum, peak/trough formations, consolidation, and breakout setups
• Activation functions create non-linear responses with tanh-like behavior, mimicking neural network layers
• Adaptive weighting system adjusts pattern importance based on current market regime (volatility < 2% and trend strength)
• Multi-confirmation signals require CNN threshold breach (±0.65), RSI boundaries, and volume confirmation above 120% of 20-period average
🔧 FEATURES
Six-Kernel Pattern Detection:
Simultaneous analysis of upward momentum, downward momentum, peak/resistance, trough/support, consolidation, and breakout patterns using mathematically optimized convolution kernels.
Adaptive Neural Architecture:
Dynamic weight adjustment based on market volatility (ATR/Price) and trend strength (EMA differential), ensuring optimal performance across different market conditions.
Professional Visual Themes:
Four sophisticated color palettes (Professional, Ocean, Sunset, Monochrome) with cohesive design language. Default Monochrome theme provides clean, distraction-free analysis.
Confidence Band System:
Upper and lower confidence zones at 150% of threshold values (±0.975) help identify high-probability signal areas and potential exhaustion zones.
Real-Time Information Panel:
Live display of CNN score, market state with emoji indicators, net momentum, confidence percentage, and RSI confirmation with dynamic color coding based on signal strength.
Individual Feature Analysis:
Optional display of all six kernel outputs with distinct visual styles (step lines, circles, crosses, area fills) for advanced pattern component analysis.
User Guide
• Monitor CNN Score crossing above +0.65 for long signals or below -0.65 for short signals with volume confirmation
• Use confidence bands to identify optimal entry zones - signals within confidence bands carry higher probability
• Background intensity reflects signal strength - darker backgrounds indicate stronger conviction
• Enter long positions when blue circles appear above oscillator with RSI < 75 and volume > 120% average
• Enter short positions when dark circles appear below oscillator with RSI > 25 and volume confirmation
• Information panel provides real-time confidence percentage and momentum direction for position sizing decisions
• Individual feature plots allow granular analysis of specific pattern components for strategy refinement
💡Conclusion
CNN Statistical Trading System represents the evolution of technical analysis, combining institutional-grade pattern recognition with retail accessibility. The six-kernel architecture provides comprehensive market pattern coverage while adaptive weighting ensures relevance across all market conditions. Whether you’re seeking systematic entry signals or advanced pattern confirmation, this indicator delivers mathematically rigorous analysis with intuitive visual presentation.

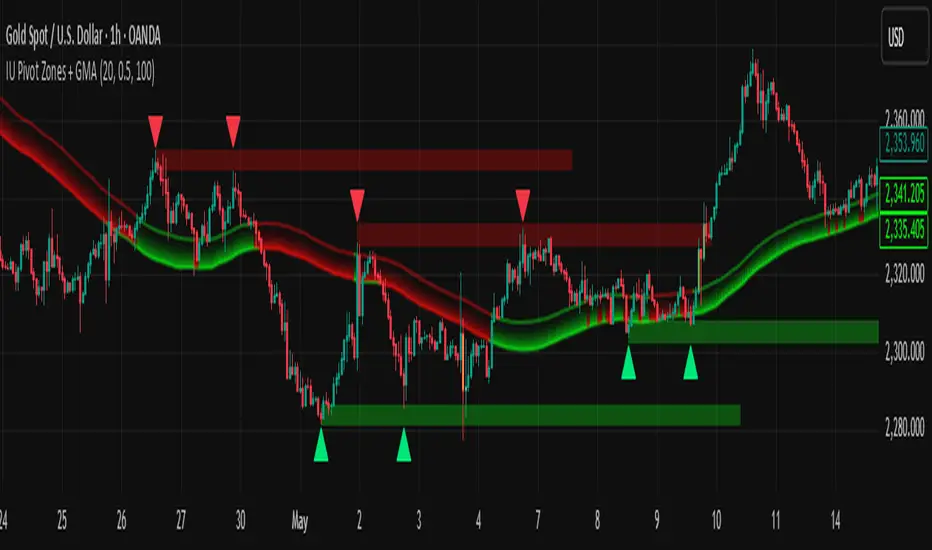
IU Pivot Zones + GMADESCRIPTION:
IU Pivot Zones + GMA is a smart price-action-based indicator that detects meaningful support and resistance zones formed through pivot highs/lows while combining them with dynamic zone generation and Geometric Moving Averages (GMA). This tool is built to help traders visualize institutional breakout/rejection zones with clear, logical mapping and live box management — helping you stay ahead of the move.
The indicator is designed for intraday, swing, and positional traders who want to enhance their trading decisions with visual confluence zones and market structure logic.
USER INPUTS
* Pivot point Lengths: Number of bars used to detect pivot highs/lows
* Zone length: Controls the thickness of the support/resistance zone; higher values create wider zones
* GMA Length: Period for calculating the geometric moving averages based on highs and lows
* Allow Bar/candle Color: Enables or disables special candle coloring when price interacts with the zones
LOGIC OF THE INDICATOR:
* Detects pivot highs and pivot lows using the user-defined length
* Compares consecutive pivot levels to determine if they fall within a valid ATR-based price band to form a zone
* If confirmed, the indicator dynamically plots a resistance or support box between those pivot points, colored respectively (red for resistance, green for support)
* The boxes update in real-time based on price action. If price respects the zone, the box extends forward. If price breaks the zone, the box disappears
* Geometric Moving Averages (GMA) based on logarithmic mean of highs and lows are plotted to offer a trend bias
* Candles that touch the top of the support zone are colored yellow, and those touching the bottom of the resistance zone are orange, enhancing zone reaction visibility
WHY IT IS UNIQUE:
* Uses logarithmic-based GMAs, which are smoother and less reactive than traditional moving averages
* ATR-based zone logic makes it adaptive to volatility instead of using fixed-width zones
* Combines structural levels (pivots), volatility filters (ATR), and trend overlays (GMA) in one unified tool
* Real-time zone extension and disappearance logic based on price interaction
HOW USER CAN BENEFIT FROM IT:
* Spot high-probability breakout or reversal zones that price respects consistently
* Use the GMA cloud for trend confirmation — for example, bullish bias when price is above both GMAs
* Build price action strategies around zone touches, breakouts, or rejections
* Use color-coded candles as real-time alerts for potential entry/exit signals near S/R levels
* Save time by avoiding manual marking of zones on charts across timeframes
DISCLAIMER:
This indicator is created for educational and informational purposes only. It does not constitute financial advice or a recommendation to buy or sell any asset. All trading involves risk, and users should conduct their own analysis or consult with a qualified financial advisor before making any trading decisions. The creator is not responsible for any losses incurred through the use of this tool. Use at your own discretion.
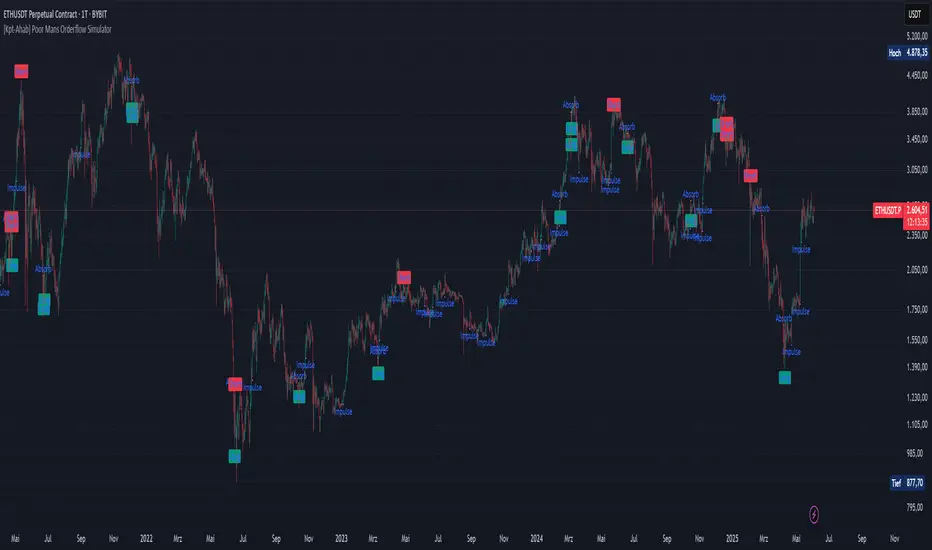
[Kpt-Ahab] Poor Mans Orderflow SimulatorScript Description – Poor Mans Orderflow Simulator
Purpose of the Script
This script simulates a simplified order flow approach ("Poor Man's Orderflow") without access to actual Bid/Ask data. The goal is to detect, quantify, and visualize patterns such as absorption, impulsive moves, and structured re-entry behaviors.
Calculation Logic
Absorption Candles
A candle is classified as "absorption" if:
The ratio of body size to full candle range is below a defined threshold,
Volume is significantly higher than the average of the last N periods,
The candle direction is negative (for long absorption) or positive (for short absorption).
These conditions define a candle with high activity but minimal price movement in the respective direction.
Impulse Candles
A candle is classified as "impulse" if:
The body-to-range ratio is high (indicating a strong directional move),
Volume exceeds the average significantly,
The price closes in the direction of the candle body (bullish or bearish).
Additionally, the average range of previous candles serves as a minimum benchmark for the impulse.
Cluster Detection
A cluster is detected when:
A minimum number of absorption candles is counted within a defined lookback period,
Either the long or short version of the absorption logic is used,
The result is a binary condition: cluster active or inactive.
Entry Signals (Re-entry)
An entry signal is generated when:
One or more absorption candles occurred in the last two bars,
A pullback against the direction of absorption occurs,
The current candle shows a directional move confirmed by a close in the expected direction.
These re-entry signals are evaluated separately for long and short scenarios.
Cluster-Confirmed Signals
A separate signal is generated when a valid re-entry setup occurs while a cluster is active. This represents a combined logic condition.
Alert Logic
The script provides a multi-layer alert framework:
Signal selection (Alertmode):
The user defines which signal type should trigger an alert (e.g. re-entry only, cluster only, combination, or impulse).
Optional filter (Filtermode):
A secondary filter limits alerts to cases where an additional condition (e.g. absorption cluster) is active.
Signal output:
As a simple binary value (+1 / –1) for classic alerts,
Or via an encoded Multibit signal, compatible with other modules in the djmad ecosystem.
These alerts are intended for integration with external systems or for use within platform-native visual or automation features.
SMT Divergence [Dova Lazarus]Title: SMT
Description:
The SMT (Smart Money Technique) indicator is designed to help traders identify potential divergences between correlated assets, a key concept used in smart money trading strategies. It compares price action across two or more instruments to reveal hidden strength or weakness that may not be visible on a single chart.
Key Features:
Custom asset selection: Compare your main chart with any other TradingView symbol (e.g., BTC/USD vs. ETH/USD).
Real-time SMT divergence detection: Highlights potential bullish or bearish divergences when one asset makes a higher high/lower low while the other does not.
Visual markers: Plots intuitive visual cues directly on the chart to signal divergence.
Configurable timeframes: Use on any timeframe for both intraday and swing trading setups.
How to Use:
Select your base symbol (e.g., BTCUSD) on the chart.
In the indicator settings, choose a comparison symbol (e.g., ETHUSD).
Look for divergence signals:
Bearish SMT Divergence: Base symbol makes a higher high, comparison symbol fails to make a higher high → possible sell signal.
Bullish SMT Divergence: Base symbol makes a lower low, comparison symbol fails to make a lower low → possible buy signal.
This tool is ideal for traders following ICT (Inner Circle Trader) concepts or anyone interested in identifying smart money manipulation and market inefficiencies.

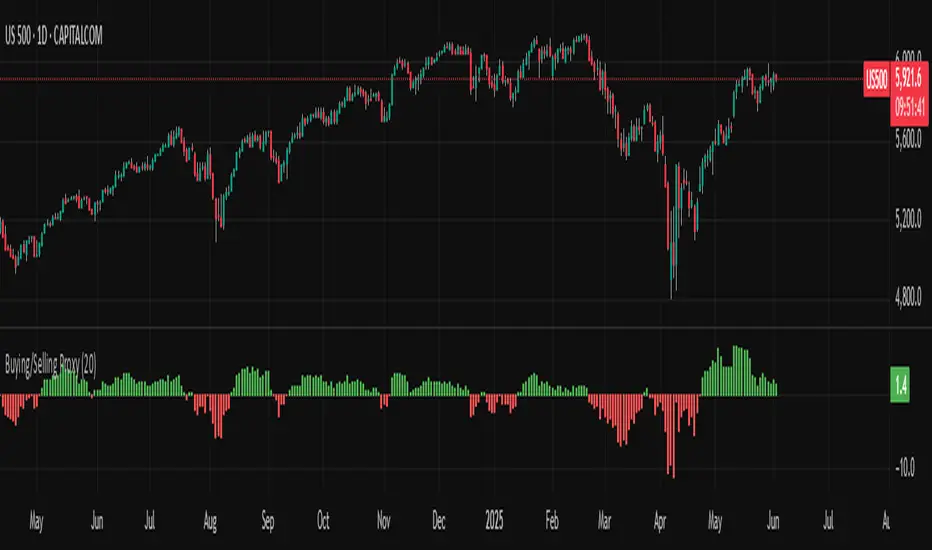
Buying/Selling ProxyTiltFolio Buying/Selling Proxy
This simple but effective indicator visualizes short-term buying or selling pressure using log returns over a rolling window.
How It Works:
Calculates the average of logarithmic returns over the past N bars (default: 20).
Positive values suggest sustained buying pressure; negative values indicate selling pressure.
Plotted as a color-coded histogram:
✅ Green = net buying
❌ Red = net selling
Why Use It:
This proxy helps traders gauge directional bias and momentum beneath the surface of price action — especially useful for confirming breakout strength, timing entries, or filtering signals.
- Inspired by academic return normalization, but optimized for practical use.
- Use alongside TiltFolio's Breakout Trend indicator for added context.
PLR-Z For Loop🧠 Overview
PLR-Z For Loop is a trend-following indicator built on the Power Law Residual Z-score model of Bitcoin price behavior. By measuring how far price deviates from a long-term power law regression and applying a custom scoring loop, this tool identifies consistent directional pressure in market structure. Designed for BTC, this indicator helps traders align with macro trends.
🧩 Key Features
Power Law Residual Model: Tracks deviations of BTC price from its long-term logarithmic growth curve.
Z-Score Normalization: Applies long-horizon statistical normalization (400/1460 bars) to smooth residual deviations into a usable trend signal.
Loop-Based Trend Filter: Iteratively scores how often the current Z-score exceeds prior values, emphasizing trend persistence over volatility.
Optional Smoothing: Toggleable exponential smoothing helps filter noise in choppier market conditions.
Directional Regime Coloring: Aqua (bullish) and Red (bearish) visuals reinforce trend alignment across plots and candles.
🔍 How It Works
Power Law Curve: Price is compared against a logarithmic regression model fitted to historical BTC price evolution (starting July 2010), defining structural support, resistance, and centerline levels.
Residual Z-Score: The residual is calculated as the log-difference between price and the power law center.
This residual is then normalized using a rolling mean (400 days) and standard deviation (1460 days) to create a long-term Z-score.
Loop Scoring Logic:
A loop compares the current Z-score to a configurable number of past bars.
Each higher comparison adds +1, and each lower one subtracts -1.
The result is a trend persistence score (z_loop) that grows with consistent directional momentum.
Smoothing Option: A user-defined EMA smooths the score, if enabled, to reduce short-term signal noise.
Signal Logic:
Long signal when trend score exceeds long_threshold.
Short signal when score drops below short_threshold.
Directional State (CD): Internally manages the current market regime (1 = long, -1 = short), controlling all visual output.
🔁 Use Cases & Applications
Macro Trend Alignment: Ideal for traders and analysts tracking Bitcoin’s structural momentum over long timeframes.
Trend Persistence Filter: Helps confirm whether the current move is part of a sustained trend or short-lived volatility.
Best Suited for BTC: Built specifically on the BNC BLX price history and Bitcoin’s power law behavior. Not designed for use with other assets.
✅ Conclusion
PLR-Z For Loop reframes Bitcoin’s long-term power law model into a trend-following tool by scoring the persistence of deviations above or below fair value. It shifts the focus from valuation-based mean reversion to directional momentum, making it a valuable signal for traders seeking high-conviction participation in BTC’s broader market cycles.
⚠️ Disclaimer
The content provided by this indicator is for educational and informational purposes only. Nothing herein constitutes financial or investment advice. Trading and investing involve risk, including the potential loss of capital. Always backtest and apply risk management suited to your strategy.

Supply/Demand Zones + Engulfment-based ExecutionSupply/Demand Zones + Engulfment-Based Execution
Strategy Overview
This strategy combines institutional trading concepts—supply/demand zones and engulfing candle patterns—to generate high-probability long and short trade setups. The system uses aggregated price action to identify potential reversal zones and confirms entries with engulfing candle patterns, ensuring trades are only taken when market structure shows commitment in the direction of the trade.
Core Concepts
• Supply & Demand Zones: These are automatically detected by analyzing aggregated bullish and bearish candle structures over user-defined intervals. Supply zones are formed after bearish continuation patterns; demand zones appear after bullish continuation patterns.
• Engulfing Entries: Once price enters a zone, the strategy waits for a bullish engulfing pattern (in a demand zone) or a bearish engulfing pattern (in a supply zone) before executing a trade. This adds confirmation and reduces false signals.
• Risk Management: Stop-loss is placed at the low (for long trades) or high (for short trades) of the engulfed candle. Take-profit can be calculated using a fixed R-multiple (risk-to-reward ratio) or a user-defined target price.
Key Features
Fully customizable aggregation factor for zone detection
Visual zone boxes, entry/SL/TP boxes, and engulfing pattern labels
Optional removal of mitigated zones for cleaner charting
Configurable trade mode (Long only, Short only, or Both)
Support for trading sessions and date filtering
Alerts for price entering supply or demand zones
How to Use
Select Aggregation Factor: Choose how many candles to group together for identifying key zones (e.g., 4x timeframe).
Enable Zones: Turn on supply and/or demand zones as needed.
Set Execution Parameters:
– Choose R-multiple (e.g., 2:1 risk-reward)
– Or use a fixed take-profit price
Define Trade Time Window:
– Set the date and time ranges to restrict execution
– Use Start Hour and End Hour to limit trades to specific sessions (e.g., London/New York)
Run on Desired Timeframe: Typically used on 15m–4H charts, depending on your strategy and the asset’s volatility.
Ideal For
• Traders using Smart Money Concepts (SMC)
• Those who value high-confluence entries
• Intraday to swing traders looking for structure-based automation
⚠️ Important Notes
• The strategy requires engulfing confirmation within the zone to enter a position.
• This script does not repaint and executes trades on a bar close basis.
• Backtest results may vary based on session filters and aggregation factor.
© Attribution
This strategy was developed by The_Forex_Steward and is licensed under the Mozilla Public License 2.0.
You are free to use, modify, and distribute it under the terms of that license.

Auto Fractal [theUltimator5]This indicator is what I call the Auto Fractal. It is a unique algorithm that looks back in time, finds a segment on the chart that closest matches the recent price action, then projects the price forwards. It effectively finds chart patterns and shows you what the price did the last time the same/similar chart pattern was observed.
Creating an algorithm to match abstract curves to other abstract curves and provide a confidence score was the fundamental problem that needed to be solved in order to create this indicator, which curve matches with surprising accuracy.
The most effective method to "curve match" that I found is the Pearson Coefficient, set by a segment length and a lookback period. After the highest coefficient curve is located, the curve then gets scaled and offset to match the current price.
The past segment is drawn over the current price (orange line), giving a visualization of the two curves and how closely they match each other. The indicator then projects the price forwards in time based on the price action of the chart from the historical segment (dashed fuchsia line).
A bounding box also gets drawn around the historical segment to give you a clear visual of where the price is getting pulled from for proper analysis and ease of use.
The Pearson Coefficient % is shown in a table in the top right-hand corner of the chart and can be toggled off if desired. The values range from -100% (perfectly inverse correlation) to +100% (perfectly correlated) with 0 meaning no correlation whatsoever. The closer to +100% the value is, the better the segment match.
As with most/all of my indicators, user interface and simplicity was at the top of my priority list. I designed this to be easily readable and intuitive to both novice and veteran traders, without cluttering the chart.
Note:
This indicator is extremely heavy in terms of memory usage due to nested for loops, and takes several seconds to initially load the chart overlay. If the lookback period is increased too high (>600) then the indicator may time out and fail to load anything. If nothing loads on the chart, try reducing the lookback length and wait up to 10 seconds for lines to appear.

Demand Index (Hybrid Sibbet) by TradeQUODemand Index (Hybrid Sibbet) by TradeQUO \
\Overview\
The Demand Index (DI) was introduced by James Sibbet in the early 1990s to gauge “real” buying versus selling pressure by combining price‐change information with volume intensity. Unlike pure price‐based oscillators (e.g. RSI or MACD), the DI highlights moves backed by above‐average volume—helping traders distinguish genuine demand/supply from false breakouts or low‐liquidity noise.
\Calculation\
\
\ \Step 1: Weighted Price (P)\
For each bar t, compute a weighted price:
```
Pₜ = Hₜ + Lₜ + 2·Cₜ
```
where Hₜ=High, Lₜ=Low, Cₜ=Close of bar t.
Also compute Pₜ₋₁ for the prior bar.
\ \Step 2: Raw Range (R)\
Calculate the two‐bar range:
```
Rₜ = max(Hₜ, Hₜ₋₁) – min(Lₜ, Lₜ₋₁)
```
This Rₜ is used indirectly in the exponential dampener below.
\ \Step 3: Normalize Volume (VolNorm)\
Compute an EMA of volume over n₁ bars (e.g. n₁=13):
```
EMA_Volₜ = EMA(Volume, n₁)ₜ
```
Then
```
VolNormₜ = Volumeₜ / EMA_Volₜ
```
If EMA\_Volₜ ≈ 0, set VolNormₜ to a small default (e.g. 0.0001) to avoid division‐by‐zero.
\ \Step 4: BuyPower vs. SellPower\
Calculate “raw” BuyPowerₜ and SellPowerₜ depending on whether Pₜ > Pₜ₋₁ (bullish) or Pₜ < Pₜ₋₁ (bearish). Use an exponential dampener factor Dₜ to moderate extreme moves when true range is small. Specifically:
• If Pₜ > Pₜ₋₁,
```
BuyPowerₜ = (VolNormₜ) / exp
```
otherwise
```
BuyPowerₜ = VolNormₜ.
```
• If Pₜ < Pₜ₋₁,
```
SellPowerₜ = (VolNormₜ) / exp
```
otherwise
```
SellPowerₜ = VolNormₜ.
```
Here, H₀ and L₀ are the very first bar’s High/Low—used to calibrate the scale of the dampening. If the denominator of the exponential is near zero, substitute a small epsilon (e.g. 1e-10).
\ \Step 5: Smooth Buy/Sell Power\
Apply a short EMA (n₂ bars, typically n₂=2) to each:
```
EMA_Buyₜ = EMA(BuyPower, n₂)ₜ
EMA_Sellₜ = EMA(SellPower, n₂)ₜ
```
\ \Step 6: Raw Demand Index (DI\_raw)\
```
DI_rawₜ = EMA_Buyₜ – EMA_Sellₜ
```
A positive DI\_raw indicates that buying force (normalized by volume) exceeds selling force; a negative value indicates the opposite.
\ \Step 7: Optional EMA Smoothing on DI (DI)\
To reduce choppiness, compute an EMA over DI\_raw (n₃ bars, e.g. n₃ = 1–5):
```
DIₜ = EMA(DI_raw, n₃)ₜ.
```
If n₃ = 1, DI = DI\_raw (no further smoothing).
\
\Interpretation\
\
\ \Crossing Zero Line\
• DI\_raw (or DI) crossing from below to above zero signals that cumulative buying pressure (over the chosen smoothing window) has overcome selling pressure—potential Long signal.
• Crossing from above to below zero signals dominant selling pressure—potential Short signal.
\ \DI\_raw vs. DI (EMA)\
• When DI\_raw > DI (the EMA of DI\_raw), bullish momentum is accelerating.
• When DI\_raw < DI, bullish momentum is weakening (or bearish acceleration).
\ \Divergences\
• If price makes new highs while DI fails to make higher highs (DI\_raw or DI declining), this hints at weakening buying power (“bearish divergence”), possibly preceding a reversal.
• If price makes new lows while DI fails to make lower lows (“bullish divergence”), this may signal waning selling pressure and a potential bounce.
\ \Volume Confirmation\
• A strong price move without a corresponding rise in DI often indicates low‐volume “fake” moves.
• Conversely, a modest price move with a large DI spike suggests true institutional participation—often a more reliable breakout.
\
\Usage Notes & Warnings\
\
\ \Never Use DI in Isolation\
It is a \filter\ and \confirmation\ tool—combine with price‐action (trendlines, support/resistance, candlestick patterns) and risk management (stop‐losses) before executing trades.
\ \Parameter Selection\
• \Vol EMA length (n₁)\: Commonly 13–20 bars. Shorter → more responsive to volume spikes, but noisier.
• \Buy/Sell EMA length (n₂)\: Typically 2 bars for fast smoothing.
• \DI smoothing (n₃)\: Usually 1 (no smoothing) or 3–5 for moderate smoothing. Long DI\_EMA (e.g. 20–50) gives a slower signal.
\ \Market Adaptation\
Works well in liquid futures, indices, and heavily traded stocks. In thinly traded or highly erratic markets, adjust n₁ upward (e.g., 20–30) to reduce noise.
---
\In Summary\
The Demand Index (James Sibbet) uses a three‐stage smoothing (volume → Buy/Sell Power → DI) to reveal true demand/supply imbalance. By combining normalized volume with price change, Sibbet’s DI helps traders identify momentum backed by real participation—filtering out “empty” moves and spotting early divergences. Always confirm DI signals with price action and sound risk controls before trading.

3 Bar Reversal3 Bar Reversal
This pattern is described in John Carter's "Mastering the Trade"
The 3 Bar Reversal indicator is a simple but effective price action tool designed to highlight potential short-term reversals in market direction. It monitors consecutive bar behavior and identifies turning points based on a three-bar pattern. This tool can assist traders in spotting trend exhaustion or early signs of a reversal, particularly in scalping or short-term trading strategies.
How It Works
This indicator analyzes the relationship between consecutive bar closes:
It counts how many bars have passed since the price closed higher than the previous close (barssince(close >= close )) — referred to as an "up streak".
It also counts how many bars have passed since the price closed lower than the previous close (barssince(close <= close )) — known as a "down streak".
A reversal condition is met when:
There have been exactly 3 bars in a row moving in one direction (up or down), and
The 4th bar closes in the opposite direction.
When this condition is detected, the script performs two actions:
Plots a triangle on the chart to signal the potential reversal:
A green triangle below the bar for a possible long (buy) opportunity.
A red triangle above the bar for a possible short (sell) opportunity.
Triggers an alert condition so users can set notifications for when a reversal is detected.
Interpretation
Long Signal: The market has printed 3 consecutive lower closes, followed by a higher close — suggesting bullish momentum may be emerging.
Short Signal: The market has printed 3 consecutive higher closes, followed by a lower close — indicating possible bearish momentum.
These patterns are common in market retracements and can act as confirmation signals when used with other indicators such as RSI, MACD, support/resistance, or volume analysis.
Usage Examples
Scalping: Use the reversal signal to quickly enter short-term trades after a short-term exhaustion move.
Swing Trading: Combine this with trend indicators (e.g., moving averages) to time pullbacks within larger trends.
Confirmation Tool: Use this indicator alongside candlestick patterns or support/resistance zones to validate entry or exit points.
Alert Setup: Enable alerts based on the built-in alertcondition to receive instant notifications for potential trade setups.
Limitations
The 3-bar reversal logic does not guarantee a trend change; it signals potential reversals, which may need confirmation.
Best used in conjunction with broader context such as trend direction, market structure, or other technical indicators.

Enhanced Zones with Volume StrengthEnhanced Zones with Volume Strength
Your reliable visual guide to market zones — now with Multi-Timeframe (MTF) power!
What you get:
Clear visual zones on your chart — color-coded boxes that highlight important price areas.
Blue Boxes for neutral zones — easy to spot areas of indecision or balance.
Gray Boxes to show normal volume conditions, giving you context without clutter.
Green Boxes highlighting bullish zones where strength is showing.
Red Boxes marking bearish zones where weakness might be in play.
Multi-Timeframe Support:
Seamlessly visualize these zones from higher timeframes directly on your current chart for a bigger-picture view, helping you make smarter trading decisions.
How to use it:
Adjust the box width (in bars) to fit your trading style and timeframe.
Customize colors and opacity to suit your chart theme.
Toggle neutral blue and gray volume boxes on/off to focus on what matters most to you.
Set the maximum number of boxes to keep your chart clean and performant.
Why you’ll love it:
This indicator cuts through the noise by visually marking zones where volume and price action matter the most — without overwhelming your chart. The MTF feature means you’re always aligned with higher timeframe trends without switching views.
Pro tip:
Use these boxes as dynamic support/resistance areas or to confirm trade setups alongside your favorite indicators.
No complicated formulas here, just crisp, actionable visuals designed for clarity and confidence.

Adaptive Volume‐Demand‐Index (AVDI)Demand Index (according to James Sibbet) – Short Description
The Demand Index (DI) was developed by James Sibbet to measure real “buying” vs. “selling” strength (Demand vs. Supply) using price and volume data. It is not a standalone trading signal, but rather a filter and trend confirmer that should always be used together with chart structure and additional indicators.
---
\ 1. Calculation Basis\
1. Volume Normalization
$$
\text{normVol}_t
= \frac{\text{Volume}_t}{\mathrm{EMA}(\text{Volume},\,n_{\text{Vol}})_t}
\quad(\text{e.g., }n_{\text{Vol}} = 13)
$$
This smooths out extremely high volume spikes and compares them to the average (≈ 1 means “average volume”).
2. Price Factor
$$
\text{priceFactor}_t
= \frac{\text{Close}_t - \text{Open}_t}{\text{Open}_t}.
$$
Positive values for bullish bars, negative for bearish bars.
3. Component per Bar
$$
\text{component}_t
= \text{normVol}_t \times \text{priceFactor}_t.
$$
If volume is above average (> 1) and the price rises slightly, this yields a noticeably positive value; conversely if the price falls.
4. Raw DI (Rolling Sum)
Over a window of \$w\$ bars (e.g., 20):
$$
\text{RawDI}_t
= \sum_{i=0}^{w-1} \text{component}_{\,t-i}.
$$
Alternatively, recursively for \$t \ge w\$:
$$
\text{RawDI}_t
= \text{RawDI}_{t-1}
+ \text{component}_t
- \text{component}_{\,t-w}.
$$
5. Optional EMA Smoothing
An EMA over RawDI (e.g., \$n\_{\text{DI}} = 50\$) reduces short-term fluctuations and highlights medium-term trends:
$$
\text{EMA\_DI}_t
= \mathrm{EMA}(\text{RawDI},\,n_{\text{DI}})_t.
$$
6.Zero Line
Handy guideline:
RawDI > 0: Accumulated buying power dominates.
RawDI < 0: Accumulated selling power dominates.
2. Interpretation & Application
Crossing Zero
RawDI above zero → Indication of increasing buying pressure (potential long signal).
RawDI below zero → Indication of increasing selling pressure (potential short signal).
Not to be used alone for entry—always confirm with price action.
RawDI vs. EMA_DI
RawDI > EMA\_DI → Acceleration of demand.
RawDI < EMA\_DI → Weakening of demand.
Divergences
Price makes a new high, RawDI does not make a higher high → potential weakness in the uptrend.
Price makes a new low, RawDI does not make a lower low → potential exhaustion of the downtrend.
3. Typical Signals (for Beginners)
\ 1. Long Setup\
RawDI crosses zero from below,
RawDI > EMA\_DI (acceleration),
Price closes above a short-term swing high or resistance.
Stop-Loss: just below the last swing low, Take-Profit/Trailing: on reversal signals or fixed R\:R.
2. Short Setup
RawDI crosses zero from above,
RawDI < EMA\_DI (increased selling pressure),
Price closes below a short-term swing low or support.
Stop-Loss: just above the last swing high.
---
4. Notes and Parameters
Recommended Values (Beginners):
Volume EMA (n₍Vol₎) = 13
RawDI window (w) = 20
EMA over DI (n₍DI₎) = 50 (medium-term) or 1 (no smoothing)
Attention:\
NEVER use in isolation. Always in combination with price action analysis (trendlines, support/resistance, candlestick patterns).
Especially during volatile news phases, RawDI can fluctuate strongly → EMA\_DI helps to avoid false signals.
---
Conclusion The Demand Index by James Sibbet is a powerful filter to assess price movements by their volume backing. It shows whether a rally is truly driven by demand or merely a short-term volume anomaly. In combination with classic chart analysis and risk management, it helps to identify robust entry points and potential trend reversals earlier.

FVG Range Filter0x278's FVG Range Filter
Overview
The FVG Range Filter is a TradingView indicator designed to identify and display Fair Value Gaps (FVGs) on your chart. FVGs are areas of price imbalance that often act as significant zones for potential price retracement or reversal. This indicator filters out irrelevant gaps, showing only those that are within a specified price range and time frame, making it easier to focus on high-probability trading opportunities.
This guide is crafted to help both novice and experienced traders understand how to use this indicator effectively, even if you're new to the concept of FVG trading. We'll cover what FVGs are, how the indicator works, how to interpret its visual elements, and how to apply it in various trading scenarios.
What are Fair Value Gaps (FVGs)?
Fair Value Gaps occur when the price of an asset moves so quickly in one direction that it leaves a 'gap' or 'void' on the chart where no trading activity occurred. These gaps represent areas of imbalance between supply and demand, often created by strong buying or selling pressure. Traders use FVGs to identify potential areas where price might return to 'fill' the gap, offering opportunities for entries or exits.
Bullish FVG : This happens when price jumps upward, leaving a gap below. It suggests strong buying pressure and often acts as a support zone when price retraces.
Bearish FVG : This occurs when price drops sharply, leaving a gap above. It indicates strong selling pressure and often acts as a resistance zone when price retraces.
How the FVG Range Filter Works
The FVG Range Filter indicator automatically detects these gaps based on a specific three-bar pattern that identifies significant price imbalances. It then applies filters to ensure only relevant FVGs are displayed:
Range Filter : Only shows FVGs whose midpoint is within a user-defined percentage of the current price. This keeps the focus on gaps that are close enough to be actionable.
Time Filter : Only displays FVGs that are younger than a specified number of bars, ensuring you're looking at recent and relevant price action.
Invalidation : Once the price trades through the midpoint of an FVG, the gap is considered 'filled' or invalidated, and it is removed from the chart.
This filtering mechanism declutters your chart, highlighting only the most pertinent FVGs for your trading decisions.
Indicator Settings
The FVG Range Filter offers customizable inputs to tailor its behavior to your trading style:
Display Range (%) : This sets the percentage range from the current price within which FVGs are shown. A lower value (e.g., 1.0%) shows only gaps very close to the current price, while a higher value (e.g., 5.0%) includes gaps further away. Default is 1.0%.
Look-back Bars : This determines how far back in time the indicator looks for FVGs. It also limits how long a gap remains visible if it hasn't been invalidated. Default is 1000 bars.
Show Bullish FVGs : Toggle to display bullish FVGs (green boxes by default). Default is enabled.
Show Bearish FVGs : Toggle to display bearish FVGs (red boxes by default). Default is enabled.
Box Opacity (0-100) : Adjusts the transparency of the FVG boxes on the chart. A value of 0 is fully transparent (invisible), while 100 is fully opaque. Default is 33 for a subtle appearance.
Visual Elements and Interpretation
The indicator draws rectangular boxes on your chart to represent FVGs. Understanding these visual elements is key to using the indicator effectively:
Green Boxes : Represent bullish FVGs. These are areas where price gapped upward, suggesting potential support zones. If price retraces to this area, it might bounce off as buyers step in to defend the level.
Red Boxes : Represent bearish FVGs. These are areas where price gapped downward, indicating potential resistance zones. If price retraces to this area, it might face selling pressure and reverse downward.
Box Position and Extension : Each box starts at the bar where the FVG was detected and extends to the right, updating dynamically as new bars form. This extension helps maintain visibility until the gap is either invalidated or falls out of the look-back period.
Disappearance of Boxes : A box disappears from the chart in two scenarios:
Price Moves Away : If the midpoint of the FVG moves outside the specified display range percentage from the current price, or if the FVG becomes older than the look-back bars limit, the box is removed (though the gap data persists in memory for potential re-display if conditions are met again).
Invalidation : If price trades through the midpoint of the FVG (i.e., the low of a candle goes below the midpoint for a bullish FVG, or the high goes above the midpoint for a bearish FVG), the gap is considered filled, and the box is permanently removed from the chart.
Trading Scenarios with FVG Range Filter
Below are detailed trading scenarios to help you understand how to use the FVG Range Filter in practical situations. These scenarios assume you're trading with the trend or looking for reversals at key levels.
Scenario 1: Bullish FVG as Support for Long Entry
Setup : You're trading a stock in an uptrend on a 15-minute chart. The FVG Range Filter displays a green box (bullish FVG) after a sharp upward move earlier in the day.
Interpretation : This green box indicates a zone of imbalance where price gapped up, likely due to strong buying interest. Since it's still within the display range and look-back period, it's a relevant support zone.
Action : Wait for price to retrace back to the top edge of the green box. Look for confirmation of support, such as a bullish candlestick pattern (e.g., hammer or engulfing) or increased volume, indicating buyers are stepping in.
Entry : Enter a long position near the top of the FVG box, setting a stop-loss just below the bottom of the box to protect against a breakdown.
Target : Aim for the next resistance level or a predefined risk-reward ratio (e.g., 1:2). If another bullish FVG forms above, consider that as a potential target.
Exit : Exit the trade if price breaks below the bottom of the FVG (invalidation), or if the box disappears due to price trading through the midpoint, signaling the gap is filled.
Scenario 2: Bearish FVG as Resistance for Short Entry
Setup : You're trading a cryptocurrency on a 1-hour chart during a downtrend. The indicator shows a red box (bearish FVG) after a sharp downward move a few hours ago.
Interpretation : The red box marks a zone where price gapped down, indicating strong selling pressure. As long as it's within the display range and look-back period, it remains a potential resistance zone.
Action : Wait for price to rally back to the bottom edge of the red box. Look for signs of rejection, such as a bearish candlestick pattern (e.g., shooting star or engulfing) or decreasing volume, suggesting sellers are defending this level.
Entry : Enter a short position near the bottom of the FVG box, placing a stop-loss just above the top of the box to guard against a breakout.
Target : Target the next support level or a favorable risk-reward ratio. If a new bearish FVG appears below, it could serve as a potential target.
Exit : Exit if price breaks above the top of the FVG (invalidation), or if the box disappears because price has traded through the midpoint, indicating the gap is no longer relevant.
Scenario 3: Filtering Out Irrelevant FVGs During Choppy Markets
Setup : You're trading forex on a 5-minute chart during a period of consolidation with no clear trend. The chart shows frequent small price jumps, but the FVG Range Filter displays very few boxes.
Interpretation : The indicator is filtering out FVGs that are either too far from the current price (outside the display range percentage) or too old (beyond the look-back bars). This helps avoid false signals in a non-trending market.
Action : Recognize that the absence of FVGs on the chart suggests no high-probability setups at the moment. Avoid forcing trades based on minor price movements that don't meet the filter criteria.
Entry : Wait for a clear trend to emerge and for new FVGs to appear within the filter parameters before considering any trades.
Target/Exit : Follow the trend direction once FVGs are displayed, using the edges of the boxes as potential entry or exit zones as described in the previous scenarios.
Scenario 4: Using FVGs for Risk Management
Setup : You're already in a long position on an index futures contract on a 30-minute chart, and the FVG Range Filter shows a green box below your entry point.
Interpretation : The green box represents a bullish FVG that could act as a support zone. Since price hasn't yet reached the midpoint (which would invalidate the FVG), it remains a valid reference point for managing risk.
Action : Adjust your stop-loss to just below the bottom of the green box. This placement uses the FVG as a logical invalidation level, assuming that a break below this support zone negates the bullish premise of your trade.
Entry : No new entry is needed since you're already in the trade.
Target/Exit : Keep your original target unless a new bearish FVG forms above, which might indicate resistance. Exit if price breaks below the FVG or if the box disappears due to invalidation.
Tips for Using the FVG Range Filter
Combine with Trend Analysis : FVGs are most effective when traded in the direction of the prevailing trend. Use higher timeframe analysis or other indicators to confirm the overall market direction before acting on FVGs.
Adjust Settings for Market Conditions : In volatile markets (like cryptocurrencies), you might increase the display range percentage to capture more FVGs. In less volatile markets (like certain stocks), a tighter range might be more appropriate.
Timeframe Selection : The indicator works on all timeframes, but lower timeframes (1-15 minutes) might show more frequent FVGs for scalping, while higher timeframes (1-4 hours) are better for swing trading with larger, more significant gaps.
Confirmation Tools : Don't rely solely on FVGs for entries. Use additional confirmation from price action (candlestick patterns), volume, or other indicators to increase the probability of success.
Monitor Invalidation : If an FVG box disappears from the chart due to price trading through its midpoint, consider it a signal that the gap is no longer relevant. Adjust your strategy accordingly.
Limitations
Not a Standalone System : The FVG Range Filter identifies potential zones of interest but does not provide entry signals, stop-loss, or take-profit levels on its own. It should be used as part of a broader trading strategy.
Market Conditions : FVGs may be less effective in strongly trending markets where price doesn't retrace to fill gaps, or in very choppy markets where too many small gaps are filtered out.
Lag in Detection : Since FVGs are based on a three-bar pattern, there is a slight delay in identifying them after the price movement has occurred.
Good Luck!
The FVG Range Filter is a powerful tool for traders looking to capitalize on price imbalances in the market. By focusing only on relevant Fair Value Gaps within a specified range and time frame, it helps declutter your chart and highlights high-probability zones for potential trades. Whether you're new to FVG trading or an experienced trader, this indicator can enhance your analysis by visually identifying key areas of support and resistance based on market inefficiencies.
Experiment with the settings to match your trading style and market conditions, and always combine the indicator's insights with other forms of analysis for the best results. Happy trading!
