Feigenbaum Projection Zones [ALLDYN]🔷 Feigenbaum Projection Zones
This tool visualizes non-overlapping projection zones above and below a manually defined price range (C.E. – Center Equilibrium) using Feigenbaum constants as spacing multipliers. It’s ideal for traders who prefer structured, mathematically grounded projection layers over standard Fibonacci tools.
📌 Features:
Manual high/low range input (C.E. zone)
Feigenbaum-based zone scaling with interleaved gaps
Color-coded zones (🟥 below CE, 🟩 above CE, 🟨 CE range)
Dotted midlines through each zone
Timeframe-restricted to 15m and below for clarity
Clean label/box/line management for minimal clutter
🔒 Source code is protected to preserve custom zone spacing logic.
🧠 Designed for advanced technical analysts who want mathematical projection zones based on deterministic scaling constants.
🔍 Feigenbaum Projections: Overview
Feigenbaum Projections are derived from chaos theory, specifically Mitchell Feigenbaum’s work on bifurcations and the universality of nonlinear systems. In market terms, they attempt to map fractal or recursive structures in price movements, especially those that might echo repeating patterns in chaotic systems.
✅ Benefits:
Captures fractal and nonlinear dynamics better than Fibonacci.
Self-similarity and scaling laws can offer insights into repeating structures not seen with classical tools.
Can help model transitions between trend and consolidation through bifurcation patterns.
Tied to mathematical constants (Feigenbaum constants), offering theoretical rigor in modeling chaotic price movement.
***Compact chart view to show the full range of the FGBZ Calculations***
Trend Analysis

wma+ tendance🟢 Wma+ tendance– Trend Ribbon with Weighted Moving Averages and Alerts
Description:
Wma+ tendance is a visual trend indicator that uses two Weighted Moving Averages (WMA) – a fast and a slow one – to clearly highlight market direction. It fills the space between the two WMAs with dynamic colors and includes alerts for trend changes.
🟩 Green: Uptrend – the fast WMA is above the slow WMA, and both are rising.
🟥 Red: Downtrend – the fast WMA is below the slow WMA, and both are falling.
⬜ Gray: No clear trend – indicating potential sideways or consolidating price action.
Features:
Trend ribbon visualized between fast and slow WMAs
Alerts for bullish and bearish trend detection
Customizable inputs for MA lengths and price source
Use cases:
Spot early trend formations
Combine with other indicators for confirmation
Adaptable for intraday and swing trading strategies
This script helps traders stay on the right side of the trend with minimal noise and real-time alerts.

Ichimoku Cloud Breakout Only LongThis is a very simple trading strategy based exclusively on the Ichimoku Cloud. There are no additional indicators or complex rules involved. The key condition is that we only open long positions when the price is clearly above the cloud — indicating a bullish trend.
For optimal results, the recommended timeframes are 1D (daily) or 1W (weekly) charts. These higher timeframes help filter out market noise and provide more reliable trend signals.
We do not short the market under any circumstances. The focus is purely on riding upward momentum when the price breaks out or stays above the cloud.
This strategy works best when applied to growth stocks with strong upward trends and good fundamentals — such as Google (GOOGL), Tesla (TSLA), Apple (AAPL), or NVIDIA (NVDA).

CANX Supply and Demand - Order Block - Candle Identification© CanxStixTrader
CANX Supply and Demand - Order Block - Candle Identification
Description
Designed as a visual aid, to highlight the last up or down candle before a fractal break. We can assume these candles where the point of origin that generated enough strength to break recent structure. By using them as reference points, traders are expected to follow their own set of rules and mark higher probability supply and demand zones in the area.
How to use:
Expect price to retest in these areas, and if they fail, a potential retest in the opposite direction . The greater the number of times a zone is tested, the more likely it is to break. A fresh zone that has not yet been tested will have a higher probability of a bounce.
Fractal period and candle break type can be customized in the settings. This works on all time frames.
**The indicator is set to my optimal settings for the 5 minute or 15 minute time frame** Please mess around to find your comfort zone and back test the results.
The lower the period number the more noise this creates on the market. The higher the number the less noise and more potential for a stronger zone.
Keep it simple
PhenLabs - Market Fluid Dynamics📊 Market Fluid Dynamics -
Version: PineScript™ v6
📌 Description
The Market Fluid Dynamics - Phen indicator is a new thinking regarding market analysis by modeling price action, volume, and volatility using a fluid system. It attempts to offer traders control over more profound market forces, such as momentum (speed), resistance (thickness), and buying/selling pressure. By visualizing such dynamics, the script allows the traders to decide on the prevailing market flow, its power, likely continuations, and zones of calmness and chaos, and thereby allows improved decision-making.
This measure avoids the usual difficulty of reconciling multiple, often contradictory, market indications by including them within a single overarching model. It moves beyond traditional binary indicators by providing a multi-dimensional view of market behavior, employing fluid dynamic analogs to describe complex interactions in an accessible manner.
🚀 Points of Innovation
Integrated Fluid Dynamics Model: Combines velocity, viscosity, pressure, and turbulence into a single indicator.
Normalized Metrics: Uses ATR and other normalization techniques for consistent readings across different assets and timeframes.
Dynamic Flow Visualization: Main flow line changes color and intensity based on direction and strength.
Turbulence Background: Visually represents market stability with a gradient background, from calm to turbulent.
Comprehensive Dashboard: Provides an at-a-glance summary of key fluid dynamic metrics.
Multi-Layer Smoothing: Employs several layers of EMA smoothing for a clearer, more responsive main flow line.
🔧 Core Components
Velocity Component: Measures price momentum (first derivative of price), normalized by ATR. It indicates the speed and direction of price changes.
Viscosity Component: Represents market resistance to price changes, derived from ATR relative to its historical average. Higher viscosity suggests it’s harder for prices to move.
Pressure Component: Quantifies the force created by volume and price range (close - open), normalized by ATR. It reflects buying or selling pressure.
Turbulence Detection: Calculates a Reynolds number equivalent to identify market stability, ranging from laminar (stable) to turbulent (chaotic).
Main Flow Indicator: Combines the above components, applying sensitivity and smoothing, to generate a primary signal of market direction and strength.
🔥 Key Features
Advanced Smoothing Algorithm: Utilizes multiple EMA layers on the raw flow calculation for a fluid and responsive main flow line, reducing noise while maintaining sensitivity.
Gradient Flow Coloring: The main flow line dynamically changes color from light to deep blue for bullish flow and light to deep red for bearish flow, with intensity reflecting flow strength. This provides an immediate visual cue of market sentiment and momentum.
Turbulence Level Background: The chart background changes color based on calculated turbulence (from calm gray to vibrant orange), offering an intuitive understanding of market stability and potential for erratic price action.
Informative Dashboard: A customizable on-screen table displays critical metrics like Flow State, Flow Strength, Market Viscosity, Turbulence, Pressure Force, Flow Acceleration, and Flow Continuity, allowing traders to quickly assess current market conditions.
Configurable Lookback and Sensitivity: Users can adjust the base lookback period for calculations and the sensitivity of the flow to viscosity, tailoring the indicator to different trading styles and market conditions.
Alert Conditions: Pre-defined alerts for flow direction changes (positive/negative crossover of zero line) and detection of high turbulence states.
🎨 Visualization
Main Flow Line: A smoothed line plotted below the main chart, colored blue for bullish flow and red for bearish flow. The intensity of the color (light to dark) indicates the strength of the flow. This line crossing the zero line can signal a change in market direction.
Zero Line: A dotted horizontal line at the zero level, serving as a baseline to gauge whether the market flow is positive (bullish) or negative (bearish).
Turbulence Background: The indicator pane’s background color changes based on the calculated turbulence level. A calm, almost transparent gray indicates low turbulence (laminar flow), while a more vibrant, semi-transparent orange signifies high turbulence. This helps traders visually assess market stability.
Dashboard Table: An optional table displayed on the chart, showing key metrics like ‘Flow State’, ‘Flow Strength’, ‘Market Viscosity’, ‘Turbulence’, ‘Pressure Force’, ‘Flow Acceleration’, and ‘Flow Continuity’ with their current values and qualitative descriptions (e.g., ‘Bullish Flow’, ‘Laminar (Stable)’).
📖 Usage Guidelines
Setting Categories
Show Dashboard - Default: true; Range: true/false; Description: Toggles the visibility of the Market Fluid Dynamics dashboard on the chart. Enable to see key metrics at a glance.
Base Lookback Period - Default: 14; Range: 5 - (no upper limit, practical limits apply); Description: Sets the primary lookback period for core calculations like velocity, ATR, and volume SMA. Shorter periods make the indicator more sensitive to recent price action, while longer periods provide a smoother, slower signal.
Flow Sensitivity - Default: 0.5; Range: 0.1 - 1.0 (step 0.1); Description: Adjusts how much the market viscosity dampens the raw flow. A lower value means viscosity has less impact (flow is more sensitive to raw velocity/pressure), while a higher value means viscosity has a greater dampening effect.
Flow Smoothing - Default: 5; Range: 1 - 20; Description: Controls the length of the EMA smoothing applied to the main flow line. Higher values result in a smoother flow line but with more lag; lower values make it more responsive but potentially noisier.
Dashboard Position - Default: ‘Top Right’; Range: ‘Top Right’, ‘Top Left’, ‘Bottom Right’, ‘Bottom Left’, ‘Middle Right’, ‘Middle Left’; Description: Determines the placement of the dashboard on the chart.
Header Size - Default: ‘Normal’; Range: ‘Tiny’, ‘Small’, ‘Normal’, ‘Large’, ‘Huge’; Description: Sets the text size for the dashboard header.
Values Size - Default: ‘Small’; Range: ‘Tiny’, ‘Small’, ‘Normal’, ‘Large’; Description: Sets the text size for the metric values in the dashboard.
✅ Best Use Cases
Trend Identification: Identifying the dominant market flow (bullish or bearish) and its strength to trade in the direction of the prevailing trend.
Momentum Confirmation: Using the flow strength and acceleration to confirm the conviction behind price movements.
Volatility Assessment: Utilizing the turbulence metric to gauge market stability, helping to adjust position sizing or avoid choppy conditions.
Reversal Spotting: Watching for divergences between price and flow, or crossovers of the main flow line above/below the zero line, as potential reversal signals, especially when combined with changes in pressure or viscosity.
Swing Trading: Leveraging the smoothed flow line to capture medium-term market swings, entering when flow aligns with the desired trade direction and exiting when flow weakens or reverses.
Intraday Scalping: Using shorter lookback periods and higher sensitivity to identify quick shifts in flow and turbulence for short-term trading opportunities, particularly in liquid markets.
⚠️ Limitations
Lagging Nature: Like many indicators based on moving averages and lookback periods, the main flow line can lag behind rapid price changes, potentially leading to delayed signals.
Whipsaws in Ranging Markets: During periods of low volatility or sideways price action (high viscosity, low flow strength), the indicator might produce frequent buy/sell signals (whipsaws) as the flow oscillates around the zero line.
Not a Standalone System: While comprehensive, it should be used in conjunction with other forms of analysis (e.g., price action, support/resistance levels, other indicators) and not as a sole basis for trading decisions.
Subjectivity in Interpretation: While the dashboard provides quantitative values, the interpretation of “strong” flow, “high” turbulence, or “significant” acceleration can still have a subjective element depending on the trader’s strategy and risk tolerance.
💡 What Makes This Unique
Fluid Dynamics Analogy: Its core strength lies in translating complex market interactions into an intuitive fluid dynamics framework, making concepts like momentum, resistance, and pressure easier to visualize and understand.
Market View: Instead of focusing on a single aspect (like just momentum or just volatility), it integrates multiple factors (velocity, viscosity, pressure, turbulence) to provide a more comprehensive picture of market conditions.
Adaptive Visualization: The dynamic coloring of the flow line and the turbulence background provide immediate, adaptive visual feedback that changes with market conditions.
🔬 How It Works
Price Velocity Calculation: The indicator first calculates price velocity by measuring the rate of change of the closing price over a given ‘lookback’ period. The raw velocity is then normalized by the Average True Range (ATR) of the same lookback period. Normalization enables comparison of momentum between assets or timeframes by scaling for volatility. This is the direction and speed of initial price movement.
Viscosity Calculation: Market ‘viscosity’ or resistance to price movement is determined by looking at the current ATR relative to its longer-term average (SMA of ATR over lookback * 2). The further the current ATR is above its average, the lower the viscosity (less resistance to price movement), and vice-versa. The script inverts this relationship and bounds it so that rising viscosity means more resistance.
Pressure Force Measurement: A ‘pressure’ variable is calculated as a function of the ratio of current volume to its simple moving average, multiplied by the price range (close - open) and normalized by ATR. This is designed to measure the force behind price movement created by volume and intraday price thrusts. This pressure is smoothed by an EMA.
Turbulence State Evaluation: A equivalent ‘Reynolds number’ is calculated by dividing the absolute normalized velocity by the viscosity. This is the proclivity of the market to move in a chaotic or orderly fashion. This ‘reynoldsValue’ is smoothed with an EMA to get the ‘turbulenceState’, which indicates if the market is laminar (stable), transitional, or turbulent.
Main Flow Derivation: The ‘rawFlow’ is calculated by taking the normalized velocity, dampening its impact based on the ‘viscosity’ and user-input ‘sensitivity’, and orienting it by the sign of the smoothed ‘pressureSmooth’. The ‘rawFlow’ is then put through multiple layers of exponential moving average (EMA) smoothing (with ‘smoothingLength’ and derived values) to reach the final ‘mainFlow’ line. The extensive smoothing is designed to give a smooth and clear visualization of the overall market direction and magnitude.
Dashboard Metrics Compilation: Additional metrics like flow acceleration (derivative of mainFlow), and flow continuity (correlation between close and volume) are calculated. All primary components (Flow State, Strength, Viscosity, Turbulence, Pressure, Acceleration, Continuity) are then presented in a user-configurable dashboard for ease of monitoring.
💡 Note:
The “Market Fluid Dynamics - Phen” indicator is designed to offer a unique perspective on market behavior by applying principles from fluid dynamics. It’s most effective when used to understand the underlying forces driving price rather than as a direct buy/sell signal generator in isolation. Experiment with the settings, particularly the ‘Base Lookback Period’, ‘Flow Sensitivity’, and ‘Flow Smoothing’, to find what best suits your trading style and the specific asset you are analyzing. Always combine its insights with robust risk management practices.

MTF Trend + Crossover AlertsMulti-Timeframe Trend Dashboard + Crossover Signals
This indicator provides a clean, real-time visual dashboard of trend directions across multiple timeframes (1m, 5m, 15m, 30m, 1H, 4H, 1D), based on moving average crossovers.
🔹 Trend Detection Logic:
When the fast MA is above the slow MA → Bullish trend 🚀
When the fast MA is below the slow MA → Bearish trend 🐻
When both are equal or ranging → Neutral
📊 Dashboard Features:
Displays trend status for each selected timeframe
Color-coded cells (green = bullish, red = bearish, gray = neutral)
Includes emojis for visual clarity
🔔 Buy/Sell Alerts:
On the active chart timeframe, buy and sell signals are plotted when the fast MA crosses above or below the slow MA. You can also enable TradingView alerts based on these events.
🧩 Customizable Inputs:
Fast MA period
Slow MA period
MA type (EMA or SMA)
🔧 Ideal for traders who want a quick snapshot of market structure across multiple timeframes and receive real-time crossover signals on their current chart.

Volume-Weighted Price MovementThe Volume-Weighted Price Movement (VWPM) indicator is an easy to read technical analysis tool that analyses how volume and price movement work together to drive market momentum.
How It Works
The VWPM indicator tracks two primary components:
Bullish Movement (green line): Measures the upward price movement weighted by volume. When price closes above the open, this component calculates how much buying pressure exists by multiplying the price change (close - open) by the volume of that period.
Bearish Movement (red line): Measures the downward price movement weighted by volume. When price closes below the open, this component calculates how much selling pressure exists by multiplying the price change (open - close) by the volume of that period.
Bull-Bear Difference (lime/orange line): Shows the net momentum by subtracting bearish movement from bullish movement, providing an at-a-glance view of which force is dominant.
The VWPM integrates volume data to identify whether price movements are backed by significant participation. A large price move with low volume carries less weight than the same move with high volume, providing a more accurate reflection of market strength.
A shorter lookback period makes the indicator more responsive to recent price action, while a longer period smooths out market noise for trend identification.
Interpretation
Bullish Signals
When the green line (bull movement) rises and stays above the red line
When the Bull-Bear Difference line crosses above zero and maintains positive momentum
Divergence between price making lower lows but the bull line making higher lows (hidden strength)
Bearish Signals
When the red line (bear movement) rises and stays above the green line
When the Bull-Bear Difference line crosses below zero and maintains negative momentum
Divergence between price making higher highs but the bull line making lower highs (hidden weakness)
open source, if anyone makes the script better please let me know :)

Dynamic and ATR Supertrend**Dynamic and ATR Supertrend Indicator**
The Dynamic and ATR Supertrend indicator is a powerful tool for traders who want to identify trends and make informed decisions about their investments. This indicator combines the benefits of the Supertrend indicator with the dynamic multiplier adjustment and ATR (Average True Range) calculation to provide a more accurate and reliable trend identification system.
**Key Features:**
* **Dynamic Multiplier Adjustment:** The indicator uses a dynamic multiplier adjustment to adapt to changing market conditions. This ensures that the indicator remains sensitive to trend changes and provides accurate signals.
* **ATR Calculation:** The indicator uses the ATR (Average True Range) calculation to determine the volatility of the market. This helps to identify the optimal multiplier value for the Supertrend calculation.
* **Supertrend Calculation:** The indicator uses the Supertrend calculation to identify trends and provide buy and sell signals.
* **Higher Timeframe Analysis:** The indicator allows for higher timeframe analysis, which enables traders to identify trends and make decisions based on a broader market perspective.
* **Alert System:** The indicator includes an alert system that notifies traders of trend changes and price crosses, allowing them to make timely and informed decisions.
**How it Works:**
1. The indicator calculates the ATR (Average True Range) of the market to determine the volatility.
2. The indicator uses the dynamic multiplier adjustment to adapt to changing market conditions.
3. The indicator calculates the Supertrend value using the ATR and dynamic multiplier.
4. The indicator identifies trends and provides buy and sell signals based on the Supertrend value.
5. The indicator includes an alert system that notifies traders of trend changes and price crosses.
**Benefits:**
* **Improved Trend Identification:** The indicator provides a more accurate and reliable trend identification system, allowing traders to make informed decisions.
* **Adaptability:** The indicator adapts to changing market conditions, ensuring that it remains sensitive to trend changes and provides accurate signals.
* **Flexibility:** The indicator allows for higher timeframe analysis, enabling traders to identify trends and make decisions based on a broader market perspective.
* **Alert System:** The indicator includes an alert system that notifies traders of trend changes and price crosses, allowing them to make timely and informed decisions.
**Conclusion:**
The Dynamic and ATR Supertrend indicator is a powerful tool for traders who want to identify trends and make informed decisions about their investments. With its dynamic multiplier adjustment, ATR calculation, and Supertrend calculation, this indicator provides a more accurate and reliable trend identification system. The indicator's adaptability, flexibility, and alert system make it an essential tool for traders who want to stay ahead of the market and make profitable trades.

P1 & P2 Helper by Brighter DataThis script draws the current high & low on the chart for multiple timeframes in P1/P2 format: P1 is either the highest or lowest point of the timeframe, whichever came first. P2 is whichever came second.
For example, on the daily timeframe if the daily low is marked out as P1 and the daily high is P2, it means that the daily low was put in before the daily high. This mapping of highs/lows is used as support for the BD dashboard and its statistics.

Support and Resistance Power Channel [ChartPrime]The Support and Resistance Power Channel indicator helps traders visualize key support and resistance zones, along with buy and sell power within those zones. By identifying the highest and lowest prices within a defined range, this indicator provides insight into potential price reversals and market strength. It calculates the strength of buy and sell pressure within the zones and includes additional features like midline values and delayed signals to reduce false breakouts.
⯁ KEY FEATURES AND HOW TO USE
⯌ Support and Resistance Zones :
This indicator identifies dynamic support (lower zone) and resistance (upper zone) levels, allowing traders to easily visualize key price levels. These zones are customizable with settings for the length of the channel and how far the zones extend into the future. The zones can be used to predict areas of potential price reversal or consolidation.
⯌ Buy and Sell Power :
Within the upper resistance zone, the indicator calculates Sell Power based on the number of bearish candles, while the lower support zone calculates Buy Power based on bullish candles. This feature helps traders understand the strength of buying or selling activity within each zone.
Example of buy and sell power tracking:
⯌ Highest, Lowest, and Mid Price Levels :
The indicator marks the highest and lowest price levels within the channel with an "X," and displays these values at the end of the channel. Additionally, the midline (average of the high and low) is plotted with a dotted line, showing a key area that the price often retests during trends.
⯌ Delayed Signal Markers :
To prevent false breakouts, the indicator includes a 2-bar delay for signals. These signals are plotted when the price crosses above or below the resistance or support zones, confirming potential reversals or breakouts. Arrows or diamonds are used to mark these signals on the chart.
Example of delayed breakout signals on the chart:
⯌ Extend Zones into the Future :
In the settings, traders can extend the support and resistance zones further into the future, allowing for ongoing analysis even after the initial levels have been identified. This feature can help with forward-looking trade planning.
⯁ USER INPUTS
Length : Defines the number of bars used to calculate the support and resistance zones.
Extend : Sets how far the support and resistance zones should be extended into the future.
Top and Bottom Colors : Allows customization of the colors for the support and resistance zones.
⯁ CONCLUSION
The Support and Resistance Power Channel indicator provides a powerful and visually intuitive way to track key market levels, buy and sell pressure, and potential reversals. With its real-time zone plotting and the calculation of power within each zone, it offers traders essential insights for making more informed trading decisions.

Interest Zones | @CRYPTOKAZANCEVEnglish Description.
🧠 What This Script Does
This script automatically detects price interest zones — areas where the price repeatedly reacts by forming local swing highs or lows , suggesting heightened supply/demand or market attention. It uses a custom volatility-adjusted range (pseudo-ATR) to dynamically group significant swing points and highlights these zones visually on the chart.
The script is not a mashup or copy of built-in indicators. It’s an original implementation that performs a meaningful calculation based on market structure and volatility to help traders identify important price areas.
⚙️ How It Works
1. Swing Point Detection:
The script identifies swing highs and lows using a configurable lookback window.
2. Zone Candidate Evaluation:
Each swing is checked against a custom zone width (based on ATR and your multiplier). If multiple swings fall within this range, it’s marked as a potential zone.
3. Filtering:
The script keeps only those zones that:
• Contain at least a user-defined number of swing points.
• Do not overlap with stronger (higher swing count) zones.
4. Visualization:
• The strongest zones are drawn as semi-transparent boxes.
• Zones are limited by time (last X candles).
• Optional: Swing highs/lows can be shown on chart.
📊 How to Use
• Use it on any timeframe or asset to identify price regions of interest.
• Combine with volume, trend, or candlestick analysis for entries/exits.
• The number of touches (swing points in a zone) gives insight into zone significance.
This tool is particularly useful for identifying support/resistance areas based on actual price structure rather than arbitrary levels.
🔧 Settings
• Swing Lookback Period: Controls how many candles on each side of a pivot the script checks to detect a local high/low.
• Zone Width Multiplier: Adjusts the volatility-based range. Larger values create wider zones.
• Min Swing Count: Zones with fewer swing points than this won't be shown.
• Max Zones Displayed: Limits the number of zones shown on screen.
• Max Candles for Analysis: Old swing points beyond this range are ignored.
📌 Notes
• No third-party code or mashups used.
• This is a standalone implementation of a concept similar to market structure mapping, tailored to be dynamic and responsive to volatility.
• Ideal for traders who prefer clean, price-action-based analysis.
🇷🇺 Русское описание
🧠 Что делает этот индикатор:
Индикатор автоматически определяет зоны интереса цены — области, где цена многократно формирует локальные максимумы или минимумы (свинги) . Эти зоны могут сигнализировать о повышенном внимании рынка, предложении или спросе. Скрипт использует псевдо-ATR (волатильность на основе среднего диапазона), чтобы динамически определять такие области и выделяет их на графике.
Это не копия стандартных индикаторов и не микс чужих скриптов — это оригинальная разработка , полезная для всех, кто ищет автоматическую разметку важных ценовых уровней.
⚙️ Как работает индикатор
1. Поиск свинг-точек:
Определяются локальные экстремумы с учетом указанного периода.
2. Формирование кандидатов в зоны:
Каждая свинг-точка проверяется, есть ли в её диапазоне другие свинги. Если таких достаточно — зона считается потенциальной.
3. Фильтрация зон:
• Учитываются только зоны с минимумом заданных свингов.
• Перекрывающиеся зоны удаляются в пользу более значимых.
4. Визуализация:
• Отображаются зоны с наибольшим числом касаний.
• Зоны ограничиваются последними X свечами.
• При желании можно отобразить сами свинг-точки.
📊 Как использовать
• Работает на любом таймфрейме и инструменте.
• Используйте совместно с объёмами, трендом или свечным анализом.
• Количество касаний помогает оценить важность зоны.
Полезен тем, кто предпочитает анализ на основе структуры цены, а не произвольных уровней.
🔧 Настройки
• Период свингов: Сколько свечей учитывается по бокам для поиска экстремумов.
• Множитель зоны: Увеличивает диапазон зоны на основе волатильности.
• Мин. количество свингов: Минимум точек в зоне для её отображения.
• Макс. зон на графике: Ограничение по количеству отображаемых зон.
• Макс. свечей анализа: Старые точки за пределами не учитываются.
📌 Примечания
• Не содержит чужих индикаторов или шаблонов.
• Самостоятельная реализация механизма анализа структуры рынка.

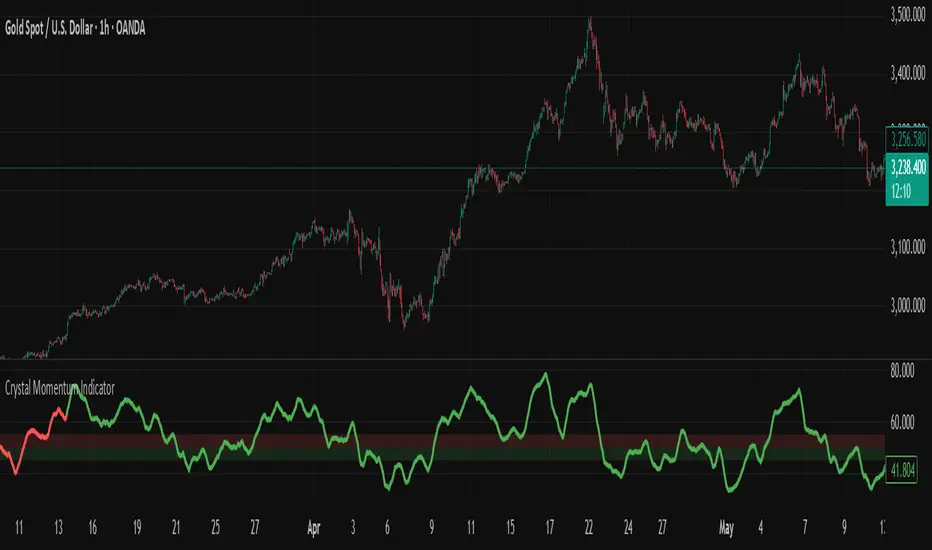
Crystal Momentum Indicator📈 Crystal Momentum Indicator
The Crystal Momentum Indicator is designed to help traders identify momentum shifts and trend continuation opportunities across multiple timeframes. It's especially useful for scalpers on the M1 chart and intraday traders using the H1 timeframe.
🔍 How to Use:
When the momentum line turns green and finds support from the green zone, it suggests bullish conditions. Combine this signal with your trading strategy to look for buy opportunities or trend continuation setups.
When the momentum line turns red, especially after resistance near the red zone, it reflects bearish conditions. Use this to align with your strategy for sell opportunities or bearish momentum continuation.
✅ Key Features:
Multi-timeframe momentum detection
Clear visual cues (green = bullish, red = bearish)
Optimized for scalping and short-term trading
Automatically adjusts to selected timeframe
⚠️ Disclaimer:
Always trade with proper risk management. This tool is for educational and analytical purposes only. It works best when combined with your own strategy and a disciplined trading plan.
Liquidity ZonesWhat It Does:
Liquidity Zones identifies key areas where institutional traders target stop orders. The indicator automatically detects significant price swings and maps the upper and lower wick zones where liquidity pools form. These zones represent high-probability areas where price is likely to return to collect stop orders before continuing its next move.
How To Use:
Identify Key Zones:
-Red zones highlight Buy Side Liquidity (resistance areas)
-Green zones highlight Sell Side Liquidity (support areas)
Trading Opportunities:
-Enter trades when price respects these zones
-Watch for zone breaks and re-tests for continuation signals
-Use alerts to notify you when price enters a zone or when new zones form
Optimization Tips:
-Adjust lookback periods based on volatility (higher for calmer markets)
-Enable auto-threshold for adaptive sensitivity to market conditions (default setting)
-Most effective on timeframes 4H and above
The indicator tracks when zones are broken and automatically removes them when price returns, providing a clean, uncluttered view of the most relevant liquidity areas on your chart.

GOYD📊 GOYD (Daily Average Percentage Change) Indicator
Created by: Emre Yavuz - @emreyavuz84
This indicator calculates and displays the average daily percentage change for each day of the week. It helps traders identify which days tend to be more volatile, offering valuable insights for timing strategies and market behavior analysis.
=================================================================================
🔧 How It Works
Daily Percentage Change Calculation:
For each candle, the indicator calculates the percentage change using the formula:
Percentage Change = (High - Low) / Low * 100
=================================================================================
Day-Based Data Collection:
The script stores the daily percentage changes in separate arrays for each day of the week:
Monday → mondayChanges
Tuesday → tuesdayChanges
...
Sunday → sundayChanges
================================================================================
Average Calculation:
For each day, the script calculates the average of all recorded percentage changes. This gives a historical view of how volatile each weekday tends to be.
=================================================================================
Visual Table Display:
A table is displayed in the top-right corner of the chart, showing:
Column 1: Day of the week
Column 2: Average percentage change for that day
=================================================================================
🎯 Use Cases
This indicator is useful for:
Weekly Volatility Analysis: Identify which days are historically more volatile.
Timing Strategies: Optimize entry/exit points based on day-specific behavior.
Data-Driven Decisions: Make informed choices using historical volatility trends.
================================================================================
🎨 Customization
The table color can be customized via the _tc input parameter.
The indicator is set to display directly on the chart (overlay=true).
If you find this indicator helpful, feel free to like, comment, or add it to your favorites. Your feedback is always appreciated! 📈

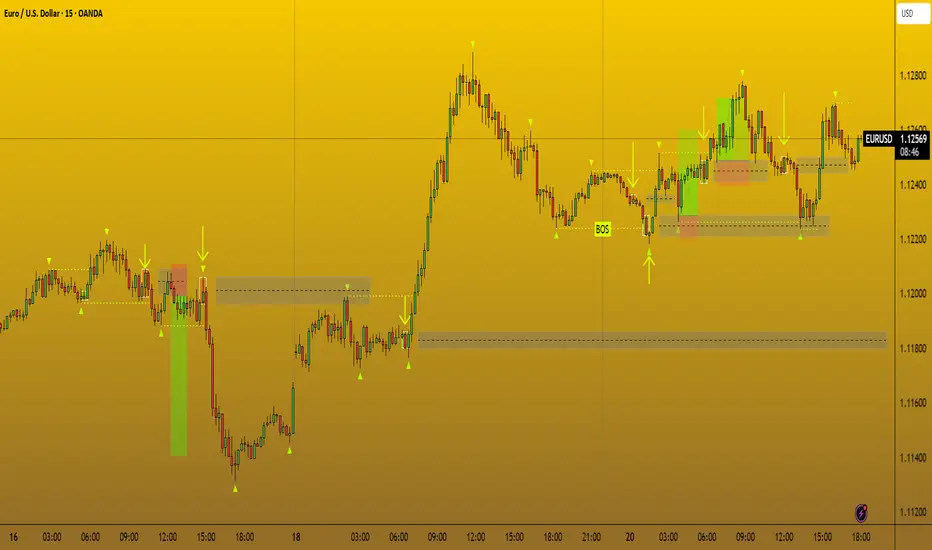
CandelaCharts - Turtle Soup Model📝 Overview
The ICT Turtle Soup Model indicator is a precision-engineered tool designed to identify high-probability reversal setups based on ICT’s renowned Turtle Soup strategy.
The Turtle Soup Model is a classic reversal setup that exploits false breakouts beyond previous swing highs or lows. It targets areas where retail traders are trapped into breakout trades, only for the price to reverse sharply in the opposite direction.
Price briefly breaks a previous high (for short setups) or low (for long setups), triggering stop orders and pulling in breakout traders. Once that liquidity is taken, smart money reverses price back inside the range, creating a high-probability fade setup.
📦 Features
Liquidity Levels: Projects forward-looking liquidity levels after a Turtle Soup model is formed, highlighting potential price targets. These projected zones act as magnet levels—areas where price is likely to reach based on the liquidity draw narrative. This allows traders to manage exits and partials with more precision.
Market Structure Shift (MSS): Confirms reversal strength by detecting a bullish or bearish MSS after a sweep. Acts as a secondary confirmation to filter out weak setups.
Custom TF Pairing: Choose your own combination of entry timeframe and context timeframe. For example, trade 5m setups inside a 1h HTF bias — perfect for aligning microstructure with macro intent.
HTF & LTF PD Arrays: Displays HTF PD Arrays (e.g., Fair Value Gaps, Inversion Fair Value Gaps) to serve as confluence zones.
History: Review and backtest past Turtle Soup setups directly on the chart. Toggle historical models on/off to study model behavior across different market conditions.
Killzone Filter: Limit signals to specific trading sessions or time blocks (e.g., New York AM, London, Asia, etc). Avoid signals in low-liquidity or choppy environments.
Standard Deviation: Calculates and projects four levels of standard deviation from the point of model confirmation. These zones help identify overextended moves, mean-reversion opportunities, and confluence with liquidity or PD arrays.
Dashboard: The dashboard displays the active model type, remaining time of the HTF candle, current bias, asset name, and date—providing real-time context and signal clarity at a glance.
⚙️ Settings
Core
Status: Filter models based on status
Bias: Controls what model type will be displayed, bullish or bearish
Fractal: Controls the timeframe pairing that will be used
High Probability Models: Detects and plots only the high-probability models
Sweeps
Sweep: Shows the sweep that forms a model
I-sweep: Controls the visibility of invalidated sweeps
D-purge: Plots the double purge sweeps
S-area: Highlights the sweep area
Liquidity
Liquidity: Displays the liquidity levels that belong to the model
MSS
MSS: Displays the Market Structure Shift for a model
History
History: Controls the number of past models displayed on the chart
Filters
Asia: Filter models based on Asia Killzone hours
London: Filter models based on London Killzone hours
NY AM: Filter models based on NY AM Killzone hours
NY Launch: Filter models based on NY Launch Killzone hours
NY PM: Filter models based on NY PM Killzone hours
Custom: Filter models based on user Custom hours
HTF
Candles: Controls the number of HTF candles that will be visible on the chart
Candles T: Displays the model’s third timeframe candle, which serves as a confirmation of directional bias
NY Open: Display True Day Open line
Offset: Controls the distance of HTF from the current chart
Space: Controls the space between HTF candles
Size: Controls the size of HTF candles
PD Array: Displays ICT PD Arrays
CE Line: Style the equilibrium line of PD Array
Border: Style the border of the PD Array
LTF
H/L Line: Displays on the LTF chart the High and Low of each HTF candle
O/C Line: Displays on the LTF chart the Open and Close of each HTF candle
PD Array: Displays ICT PD Arrays
CE Line: Style the equilibrium line of PD Array
Border: Style the border of the PD Array
Standard Deviation
StDev: Controls standard deviation of available levels
Labels: Controls the size of standard deviation levels
Lines: Controls the line widths and color of standard deviation levels
Dashboard
Panel: Display information about the current model
💡 Framework
The Turtle Soup Model is designed to detect and interpret false breakout patterns by analyzing key price action components, each playing a vital role in identifying liquidity traps and generating actionable reversal signals.
The model incorporates the following timeframe pairing:
15s - 5m - 15m
1m - 5m - 1H
2m - 15m - 2H
3m - 30m - 3H
5m - 60m - 4H
15m - 1H - 8H
30m - 3H - 12H
1H - 4H - 1D
4H - 1D - 1W
1D - 1W - 1M
1W - 1M - 6M
1M - 6M - 12M
Below are the key components that make up the model:
Sweep
D-purge
MSS
Liquidity
Standard Deviation
HTF & LTF PD Arrays
The Turtle Soup Model operates through a defined lifecycle that identifies its current state and determines the validity of a trade opportunity.
The model's lifecycle includes the following statuses:
Formation (grey)
Invalidation (red)
Pre-Invalidation (purple)
Success (green)
By incorporating the phases of Formation, Invalidation, and Success, traders can effectively manage risk, optimize position handling, and capitalize on the high-probability opportunities presented by the Turtle Soup Model.
⚡️ Showcase
Introducing the Turtle Soup Model — a powerful trading tool engineered to detect high-probability false breakout reversals. This indicator helps you pinpoint liquidity sweeps, confirm market structure shifts, and identify precise entry and exit points, enabling more confident, informed, and timely trading decisions.
LTF PD Array
LTF PD Arrays are essential for model formation—a valid Turtle Soup setup will only trigger if a qualifying LTF PD Array is present near the sweep zone.
HTF PD Array
HTF PD Arrays provide macro-level context and are used to validate the direction and strength of the potential reversal.
Timeframe Alignment
In the Turtle Soup trading model, timeframe alignment is an essential structural component. The model relies on multi-timeframe context to identify high-probability reversal setups based on failed breakouts.
High-Probability Model
A high-probability setup forms when key elements align: a Sweep, Market Structure Shift (MSS), LTF and HTF PD Arrays.
Killzone Filters
Filter Turtle Soup Models based on key market sessions: Asia, London, New York AM, New York Launch, and New York PM . This allows you to focus on high-liquidity periods where smart money activity is most likely to occur, improving both the quality and timing of your trade setups.
Unlock your trading edge with the Turtle Soup Model — your go-to tool for sharper insights, smarter decisions, and more confident execution in the markets.
🚨 Alerts
This script offers alert options for all model types. The alerts need to be set up manually from TradingView.
Bearish Model
A bearish model alert is triggered when a model forms, signaling a high sweep, MS,S and LTF PD Array.
Bullish Model
A bullish model alert is triggered when a model forms, signaling a low sweep, MSS and LTF PD Array.
⚠️ Disclaimer
These tools are exclusively available on the TradingView platform.
Our charting tools are intended solely for informational and educational purposes and should not be regarded as financial, investment, or trading advice. They are not designed to predict market movements or offer specific recommendations. Users should be aware that past performance is not indicative of future results and should not rely on these tools for financial decisions. By using these charting tools, the purchaser agrees that the seller and creator hold no responsibility for any decisions made based on information provided by the tools. The purchaser assumes full responsibility and liability for any actions taken and their consequences, including potential financial losses or investment outcomes that may result from the use of these products.
By purchasing, the customer acknowledges and accepts that neither the seller nor the creator is liable for any undesired outcomes stemming from the development, sale, or use of these products. Additionally, the purchaser agrees to indemnify the seller from any liability. If invited through the Friends and Family Program, the purchaser understands that any provided discount code applies only to the initial purchase of Candela's subscription. The purchaser is responsible for canceling or requesting cancellation of their subscription if they choose not to continue at the full retail price. In the event the purchaser no longer wishes to use the products, they must unsubscribe from the membership service, if applicable.
We do not offer reimbursements, refunds, or chargebacks. Once these Terms are accepted at the time of purchase, no reimbursements, refunds, or chargebacks will be issued under any circumstances.
By continuing to use these charting tools, the user confirms their understanding and acceptance of these Terms as outlined in this disclaimer.

Breakout Indicator + OB & FVG📈 Breakout Indicator + OB & FVG
This script is designed to assist with identifying potential breakout zones following periods of low volatility or price consolidation. It integrates price structure analysis with optional lunar phase filtering for enhanced visual insights.
🔍 Key Features
Consolidation Detection: Automatically identifies price ranges with low volatility over a user-defined lookback period.
Breakout Signals: Highlights potential breakout zones when price moves beyond consolidation range highs or lows.
Take-Profit & Stop-Loss Levels: Automatically calculates three TP levels and one SL level based on user-defined multipliers.
Lunar Filter (Optional): Applies a visual overlay during full moon phases as a unique experimental timing filter.
Visual Elements:
Entry/TP/SL levels shown on chart with colored lines and labels.
Consolidation zones shaded with customizable colors.
Dynamic panel with volatility metrics and last signal info.
⚙️ Inputs & Customization
Adjustable lookback period, volatility threshold, and risk multipliers.
Optional lunar phase aggression multiplier.
Full customization of zone colors, label visibility, and transparency.
📌 Disclaimer
This indicator is a visual tool for analysis and does not provide financial advice or guaranteed outcomes. Its purpose is to support discretionary decision-making, not replace it. Past signals do not guarantee future performance. Always test tools thoroughly and use appropriate risk management.
🧠 Developer Notes
Based on simple volatility and price action mechanics.
The lunar filter is symbolic and not based on real astronomical data.
No repainting or future leaks; signals are generated based on confirmed candle closes.

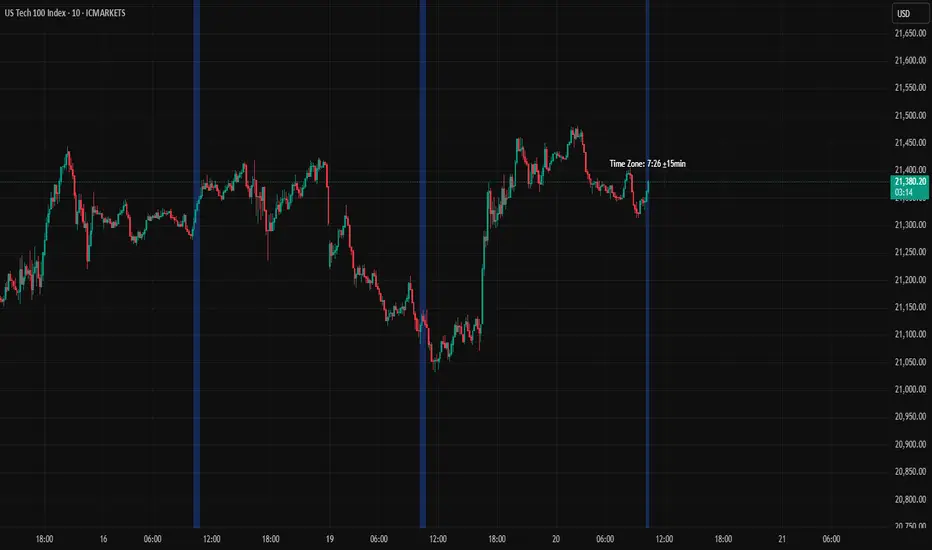
Current Time Zone HighlighterHow the indicator works:
Highlights with a background color the zone of 15 minutes before and 15 minutes after the current time for each day
Displays a vertical dashed line at the exact moment corresponding to the current time
Adds reference points at price highs and lows for the current time
Includes an informative label showing the current time and the set interval
Configurable parameters:
Color of the highlighted time zone
Number of minutes before and after the current time (default 15 minutes)
Option to show or hide the line at the exact current time
Color of the current time line
How to use the indicator:
Open TradingView and access the Pine Script editor
Copy the code from the artifact above
Save the script
Apply the indicator to any chart
The indicator will work automatically, highlighting the time zone that falls within the interval of ±15 minutes (or other interval you configure) from the current time, for each day in history and in real-time for the current day.
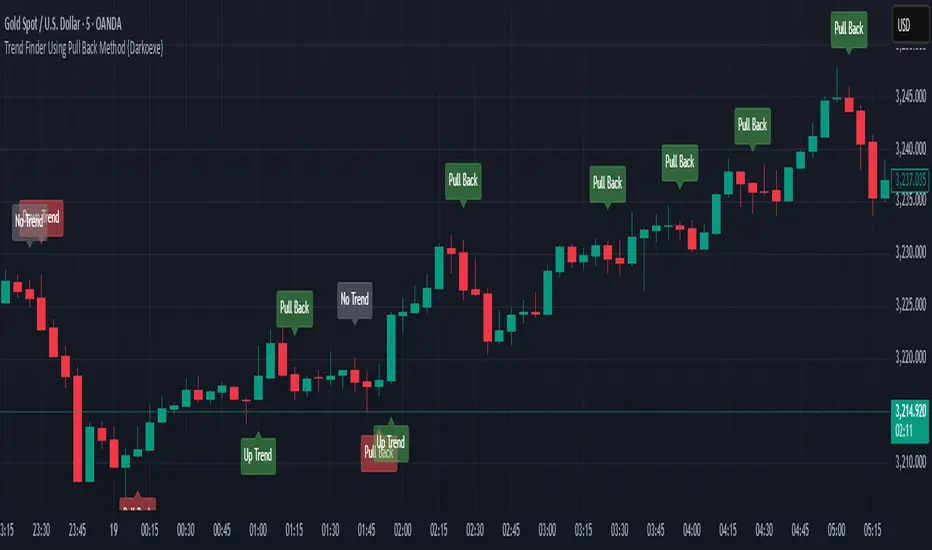
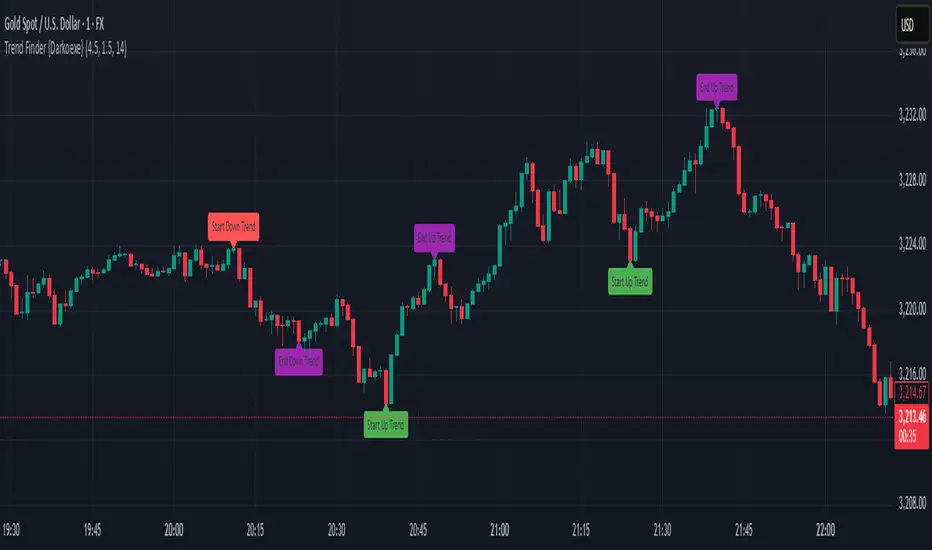
Trend Finder Using Pull Back Method {Darkoexe}This indicator predicts trends using pull backs structure to predict the trend direction. It builds off the flag pattern concept but it uses precise precise measurements to determine trend direction.
A pull back occurs every time the price direction switches then closes either below or above the open of the previous candle depending on the type of pull back, bullish or bearish.
For an up trend to be a defined, when a bullish pull back occurs and does not go below the previous low, if the price then passes above the start of the pull back, an up trend signal will be printed. Only bullish pull backs will be displayed during an up trend.
For a down trend to be defined, when a bearish pull back occurs and does not go above the previous high, if the price then passes below the start of the pull back, a down trend signal will be printed. Only bearish pull backs will be displayed during a down trend.
If the conditions for an up trend or down trend are not met, no trend will be printed. Both bearish and bullish pull backs will be displayed during a no trend.
All the labels colors can be changed.
//Darkoexe
Trend Finder {Darkoexe}This indicator displays the end and start of trends using an ATR factor.
The ATR with trend factor is used to determine the minimum length for a trend to be considered a trend.
The ATR against trend factor is used to determine the minimum length price needs to move against a trend for it to break the trend.
The ATR factors are multiplied with the ATR to determine these lengths.
The labels indicate the starts and ends of trends;
The green label indicates the start of an up trend.
The red label indicates the start of a down trend.
The black/gray label indicates the start of a trend and the end of another trend at the same location.
The purple/pink label indicates the end of a trend.
All the label colors can be changed.
IMPORTANT NOTE: This is a repainting indicator, it should only be used to back test and analyze previous trends. Do not use this indicator for live trading.
Sunday OpenSunday Open – Weekly Open Levels
Description
The "Sunday Open" indicator automatically displays the market open levels for Sunday. These levels are often used by traders as potential support and resistance zones. The script requires no manual data input and works on any timeframe.
Functionality
- Displays the N most recent Sunday Open levels, including the current and previous ones.
- The color of the current level differs from the older ones, making it easier to identify on the chart.
- Lines can be customized by style, thickness, and label visibility.
- Alerts are triggered when the price crosses any Sunday Open level (either up or down).
User Settings
- Number of levels to display (1–100)
- Color for the current and past levels
- Line style: solid, dashed, dotted
Line thickness
- Display text labels on the chart
- Enable/disable alerts for price crossing
Useful For
- Quickly identifying key reference points at the beginning of the week
- Setting up trading scenarios around the open zone
- Receiving signals for breakouts or touches of the levels
Important !
All elements are created automatically—no manual drawing required.
If you want to create alerts for when the price crosses a Sunday Open level, you need to go to "Alerts" at the top of the screen and select "SO" in the "Condition" field.

CCT Volatility Index📘 CCT Volatility Index
The CCT Volatility Index is a refined adaptation of the LS Volatility Index , originally presented by Brazilian traders Alexandre Wolwacz (Stormer), Fabrício Lorenz, and Fábio Figueiredo (Vlad) . This implementation respects the core logic of the original concept but introduces two important enhancements:
Bollinger Band Width Percentage (BBWP)
Average True Range (ATR)
These are incorporated into the traditional formula (price deviation from a moving average divided by historical volatility), producing a normalized and responsive oscillator.
🧠 Conceptual Summary
This is a volatility indicator, not a directional trend tool. It measures the degree of price dispersion and tension in the market. It can be applied in two primary contexts:
🔁 Reversal Scenarios
When the index approaches extreme levels (near 100), it may signal exhaustion of volatility and potential mean reversion, especially if price is far from the moving average (SMA21 by default).
📈 Trend Continuation
If price stays near the average and the index maintains an elevated or rising profile, it may suggest trend acceptance with ongoing momentum. In this case, volatility expansion aligns with continuation.
🎯 Strategy Guidelines
Trigger points may come from the index crossing its own moving average (white line), either as a breakout or via retest confirmation.
Overlay colors identify BBWP compression/expansion zones:
- Blue: BBWP is 2% above its historical mean.
- Red: BBWP is 98% above.
These zones can help identify breakout setups or mean-reverting conditions.
📊 Info Panel
The indicator includes a dynamic panel showing:
The current price
The moving average used as reference
The percentage deviation between them
This allows you to evaluate if the asset is currently "stretched" or "fair" under current volatility.
⚠️ Disclaimer
This tool is for educational and informational purposes only. It does not constitute investment advice and should not be used in isolation. Always combine it with other tools, market context, and proper risk management.

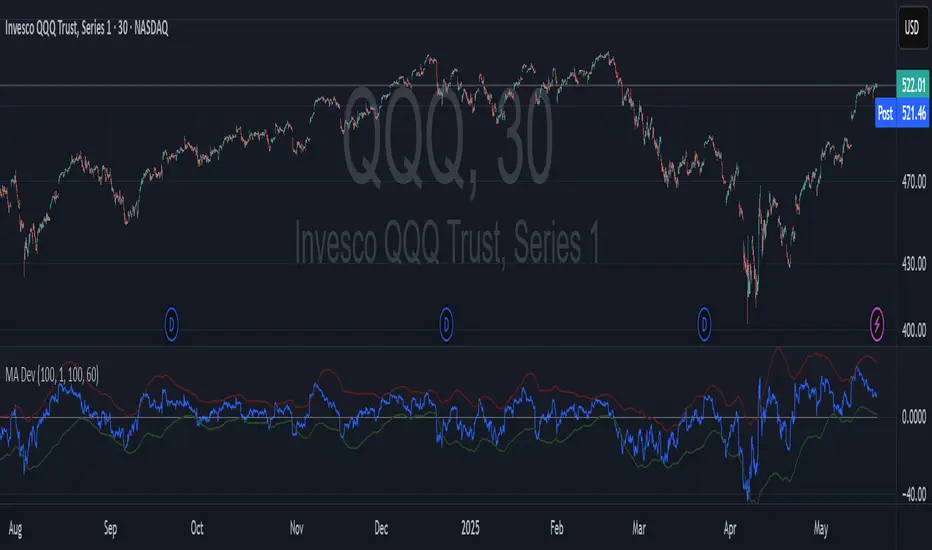
Moving Average Price Deviation Spread
**Moving Average Price Deviation Spread (MA Dev)**
This indicator visualizes the deviation of price from its exponential moving average (EMA) and scales it within dynamic upper and lower bounds. The core logic measures the smoothed spread between price and EMA, then calculates standard deviation over a rolling window to define statistical thresholds.
* **Spread**: EMA of (Close - EMA), highlighting directional bias.
* **Upper/Lower Bounds**: EMA of ±1.96 \* standard deviation of the spread, framing high/low deviation zones.
* **Use Case**: Spot overextended conditions, mean reversion setups, or volatility-driven breakouts. Ideal for timing entries and exits around price extremes.
HTF ReversalsHTF Reversals — Big Turtle Soup & Relief Patterns
A multi-timeframe reversal indicator based on the logic of how pivots form and how true reversals begin. Designed for traders who want to catch high-probability turning points on higher timeframes, with visual clarity and actionable signals.
“Reversals don’t start from nowhere — they begin with a failed expansion and a reclaim of a prior range. This script helps you spot those moments, before the crowd.”
How It Works
Detects High Timeframe (HTF) “CR” Candles:
The script scans for large-bodied candles (“CR” candles) on higher timeframes (Monthly, Weekly, 3-Day). These candles often mark the end of a trend expansion and the start of a potential reversal zone.
Looks for “Inside” Candles:
After a CR candle, the script waits for a smaller “inside” candle, which signals a pause or failed continuation. The relationship between the CR and inside candle is key for identifying a possible reversal setup.
Engulfing Confirmation (Optional):
If the inside candle doesn’t immediately trigger a reversal, the script can wait for an engulfing move in the opposite direction, confirming the failed expansion and increasing the probability of a reversal.
Entry & Target Calculation:
For each valid setup, the script calculates a retracement entry (using Fibonacci levels like 0.382 or 0.618) and a logical target (usually the CR candle’s high or low).
Visuals: Lines & Boxes:
Each signal is marked with a horizontal line (entry) and a colored box extending from the HTF close to the entry price, visually highlighting the reversal zone for the same duration as the signal’s expected play-out.
Dashboard & Alerts:
A dashboard table summarizes the latest signals for each timeframe. Custom alerts notify you of new setups in real time.
Why It Works
Pivot Logic:
Reversals often start when a strong expansion candle (pivot) is followed by a failed attempt to continue in the same direction. This script codifies that logic, looking for the “pause” after the expansion and the first sign of a reclaim.
Multi-Timeframe Edge:
By focusing on higher timeframes, the indicator filters out noise and highlights only the most significant reversal opportunities.
Objective, Repeatable Rules:
All conditions are clearly defined and repeatable, removing subjectivity from reversal trading.
Visual Clarity:
The combination of lines and boxes makes it easy to see where reversals are likely to start and where your risk/reward lies.
How to Use
Add the indicator to your chart and select your preferred timeframes (Monthly, Weekly, 3-Day).
Watch for new signals on the dashboard or via alerts.
Use the entry line and box as your trade zone; the target is also displayed.
Combine with your own confluence (price action, volume, etc.) for best results.
This indicator is best used as a framework for understanding where high-probability reversals are likely to occur, not as a standalone buy/sell tool. Always use proper risk management.
