Grid TLong V1The “Grid TLong V1” strategy is based on the classic Grid strategy, but in the mode of buying and selling in favor of the trend and only on Long. This allows to take advantage of large uptrend movements to maximize profits in bull markets. For this reason, excessively sideways or bearish markets may not be very conducive to this strategy.
Like our Grid strategies in favor of the trend, you can enter and exit with the balance with controlled risk, as the distance between each grid functions as a natural and adaptable stop loss and take profit. What differentiates it from bidirectional strategies is that Short uses a minimum amount of follow-through, so that the percentage distance between the grids is maintained.
In this version of the script the entries and exits can be chosen at market or limit , and are based on the profit or loss of the current position, not on the percentage change in price.
The user may also notice that the strategy setup is risk-controlled, because it risks 5% on each trade, has a fairly standard commission and modest initial capital, all in order to protect the strategy user from unrealistic results.
As with all strategies, it is strongly recommended to optimize the parameters for the strategy to be effective for each asset and for each time frame.
Trend Analysis

Previous Highs & Lows (Customizable)Previous Highs & Lows (Customizable)
This Pine Script indicator displays horizontal lines and labels for high, low, and midpoint levels across multiple timeframes. The indicator plots levels from the following periods:
Today's session high, low, and midpoint
Yesterday's high, low, and midpoint
Current week's high, low, and midpoint
Last week's high, low, and midpoint
Last month's high, low, and midpoint
Last quarter's high, low, and midpoint
Last year's high, low, and midpoint
Features
Individual Controls: Each timeframe has separate toggles for showing/hiding high/low levels and midpoint levels.
Custom Colors: Independent color selection for lines and labels for each timeframe group.
Display Options:
Adjustable line width (1-5 pixels)
Variable label text size (tiny, small, normal, large, huge)
Configurable label offset positioning
Organization: Settings are grouped by timeframe in a logical sequence from most recent (today) to least recent (last year).
Display Logic: Lines span the current trading day only. Labels are positioned to the right of the price action. The indicator automatically removes previous drawings to prevent chart clutter.

HTF Candle Breakout Fibonacci LevelsThis indicator automatically plots Fibonacci retracement levels on a lower timeframe (LTF) after detecting a breakout candle on a selected higher timeframe (HTF).
🔍 How It Works
When a candle on your selected HTF closes beyond the high or low of the previous candle, the indicator automatically draws Fibonacci levels on the LTF.
These levels remain visible until the next HTF candle is formed — allowing you to trade retracements with contextual precision.
⸻
⚙️ Customization Options
From the indicator settings, you can modify:
• The HTF candle timeframe (default is 1D)
• Fibonacci levels and colors
• Enable or disable “Show Only the Latest Levels” — ideal for live trading to keep the chart clean and focused.
⸻
🟪 HTF Candles Preview
After applying the indicator, you’ll see 3 vertical bars on the right edge of your LTF chart. These represent a live preview of the last three HTF candles and update in real-time.
If you prefer a cleaner chart, disable this feature via the “Show HTF Candles” toggle in the settings.
⸻
Feel free to reach out if you have any questions.

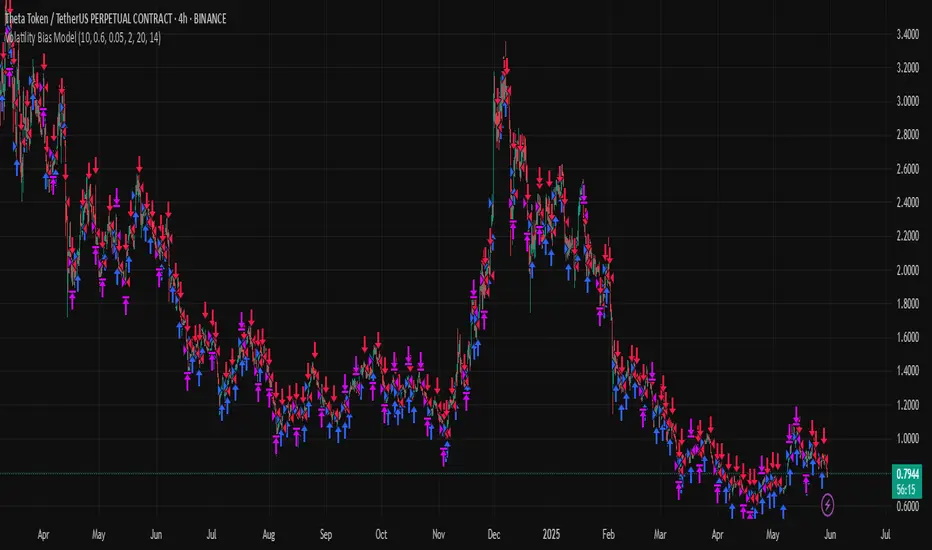
Volatility Bias ModelVolatility Bias Model
Overview
Volatility Bias Model is a purely mathematical, non-indicator-based trading system that detects directional probability shifts during high volatility market phases. Rather than relying on classic tools like RSI or moving averages, this strategy uses raw price behavior and clustering logic to determine potential breakout direction based on recent market bias.
How It Works
Over a defined lookback window (default 10 bars), the strategy counts how many candles closed in the same direction (i.e., bullish or bearish).
Simultaneously, it calculates the price range during that window.
If volatility is above a minimum threshold and a clear directional bias is detected (e.g., >60% of closes are bullish), a trade is opened in the direction of that bias.
This approach assumes that when high volatility is coupled with directional closing consistency, the market is probabilistically more likely to continue in that direction.
ATR-based stop-loss and take-profit levels are applied, and trades auto-exit after 20 bars if targets are not hit.
Key Features
- 100% non-indicator-based logic
- Statistically-driven directional bias detection
- Works across all timeframes (1H, 4H, 1D)
- ATR-based risk management
- No pyramiding, slippage and commissions included
- Compatible with real-world backtesting conditions
Realism & Assumptions
To make this strategy more aligned with actual trading environments, it includes 0.05% commission per trade and a 1-point slippage on every entry and exit.
Additionally, position sizing is set at 10% of a $10,000 starting capital, and no pyramiding is allowed.
These assumptions help avoid unrealistic backtest results and make the performance metrics more representative of live conditions.
Parameter Explanation
Bias Window (10 bars): Number of past candles used to evaluate directional closings
Bias Threshold (0.60): Required ratio of same-direction candles to consider a bias valid
Minimum Range (1.5%): Ensures the market is volatile enough to avoid noise
ATR Length (14): Used to dynamically define stop-loss and target zones
Risk-Reward Ratio (2.0): Take-profit is set at twice the stop-loss distance
Max Holding Bars (20): Trades are closed automatically after 20 bars to prevent stagnation
Originality Note
Unlike common strategies based on oscillators or moving averages, this script is built on pure statistical inference. It models the market as a probabilistic process and identifies directional intent based on historical closing behavior, filtered by volatility. This makes it a non-linear, adaptive model grounded in real-world price structure — not traditional technical indicators.
Disclaimer
This strategy is for educational and experimental purposes only. It does not constitute financial advice. Always perform your own analysis and test thoroughly before applying with real capital.
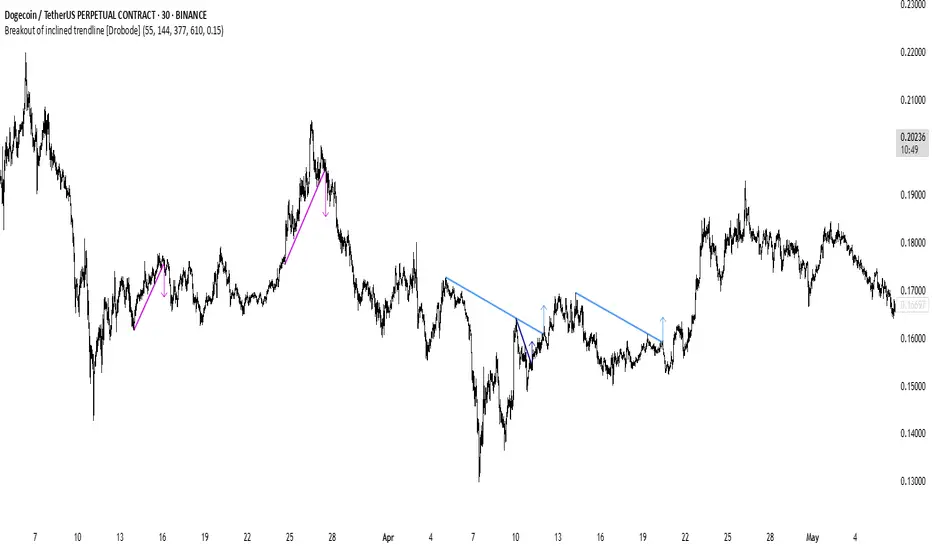
Breakout of inclined trendline [Drobode]█ DESCRIPTION
The script is designed to automatically detect a possible trendline breakout under the conditions of the popular "Slanted Trendline Breakout" strategy. The algorithm assumes that during the movement the price approaches the slanted (trend) line several times. With each subsequent approach (touch) to the trend line, the price consolidates more and more near this line, the distances between the extremes (touches) decrease, which indicates a high probability of a breakout of this line. The script checks the number of touches (approaches) of the extremes and the distances between the extremes. If all conditions are met, the script draws a slanted (trend) line in the corresponding area and an arrow with a possible price breakout direction. The length of the arrow is half the height of the slanted (trend) line and may indicate the level (price) at which it is advisable to fix the profit. In the script, you can enable or disable additional analysis periods (history length, number of bars), the more periods are enabled, the slower the script may load. For example, when placing the script on M-15, we can additionally enable the period 300 or 500, which will allow us to take into account a larger number of historical bars, and this can be considered as the extremes of the older timeframe. The script calculates each period separately, so one large period will not be able to take into account and analyze smaller periods. You can set the percentage deviation of the distance of the extremes from the trend line that touch the inclined line, depending on your needs and style of technical analysis. The smaller the percentage, the more accurate and closer to the inclined line the price extreme should be and vice versa. The main goal of the script is to facilitate the trader's routine work of identifying a possible trend line breakout. However, it should be understood that the script is not a full-fledged self-sufficient strategy, in case of receiving a signal, it is recommended to additionally conduct a comprehensive thorough analysis before taking trading actions. The script can be useful for traders of all levels, both beginners and experienced analysts. Like any other strategy or script, this script can work better on some instruments than on others. When analyzing trading setups, it is desirable to have a clear trend, it is recommended to take into account the signal of this script with a small period when the arrow shows the direction of the trend. However, at the same time, it is necessary to deeply analyze many other factors at this stage, in particular, such as volumes, consolidation, volatility, candlestick patterns, etc.
█ SCRIPT SETTINGS
By default, the script was developed and tested on medium timeframes with cryptocurrency futures instruments USDT.P
Alert
The Alert function in the script is enabled by default, you just need to activate Alert in the TradingView window and select the signal source - Breakout of inclined trendline .
The notification provides the following information (example):
Possible breakout to the upside
Ticker- DOGEUSDT.P
Price- 0.15844
Timeframe- 30
Period length- 377
Periods length
The script allows you to set the length of the period (number of bars) for which the calculation will be performed. Different periods allow you to cover more timeframes (in particular, larger timeframes). You can change up to 4 periods at a time. However, if you choose too large periods, the script may slow down and the loading time will increase. To increase the loading speed of the script, disable additional periods 3, 4, i.e. uncheck the corresponding checkboxes and use only fields 1 and 2 for periods, where you can also set the period length you need.
Percentage deviation of extremes from the trend line
The next settings are the percentage deviation of the extremes from the sloping line. The smaller the deviation, the more accurate and closer to the line the extreme bars should be, however, in this case the number of identification signals will be smaller. By default, the rejection zone is - 0.15%. On larger timeframes, the deviation can be set to be larger.
Not All FVGs Are The Same
Overview:
"Not All FVGs Are The Same" is a powerful TradingView indicator designed to pinpoint high-quality Fair Value Gaps (FVGs) on your chart. Unlike generic FVG tools, this indicator uses advanced filtering to highlight only the most significant gaps, helping traders identify high-probability setups with precision and clarity. With customizable visuals and real-time alerts, it’s built for traders who want to focus on meaningful market opportunities.
Why It’s Different:
This indicator stands out by detecting FVGs that meet strict criteria for quality, ensuring you’re not distracted by minor or unreliable gaps. It analyzes price action patterns and market volatility to confirm that each FVG represents a significant imbalance, perfect for spotting potential reversal or continuation zones.
Key Features:
High-Quality Detection: Identifies FVGs formed by strong, consistent price movements, filtering out weak or noisy gaps for reliable trading signals.
Volatility-Based Filtering: Uses market volatility to ensure only substantial FVGs are displayed, adapting to different market conditions.
Customizable Visuals: Marks FVGs with clear, semi-transparent boxes that show the gap’s range and duration, with an option to toggle labels for a clean chart.
Real-Time Alerts: Get instant notifications when new bullish or bearish FVGs are detected, keeping you ahead of the market.
Focused Display: Limits the number of FVGs shown to keep your chart uncluttered, emphasizing the most recent and relevant gaps.
User-Friendly Settings: Easily adjust sensitivity, gap size, and visual styles to match your trading strategy and preferences.
How It Helps Traders:
By focusing on high-quality FVGs, this indicator helps you identify key price levels where the market is likely to react. Whether you trade breakouts, reversals, or trend continuations, the clear visuals and precise detection make it easier to spot opportunities with confidence.
Settings:
ATR Length: Adjusts the volatility filter for FVG detection (default: 10).
Minimum FVG Size: Sets the smallest gap size to consider (default: 2 bars).
Show Last X FVGs: Controls how many recent FVGs are displayed (default: 20).
Enable Sensitivity Check: Turn on/off volatility-based filtering (default: on).
Allow Gaps Between Bars: Choose whether to include gaps with price discontinuities (default: off).
Show Labels: Toggle FVG detection labels on or off (default: on).
Style Options: Customize bullish/bearish FVG colors, text color, and label size for clear visuals.
How to Use:
Apply the indicator to your chart and tweak the settings to suit your market and timeframe. Enable alerts to stay updated on new FVGs in real-time. Use the boxes to identify key support/resistance zones and combine with your strategy for optimal trading decisions.
Note: Designed for efficiency, this indicator works smoothly across timeframes and instruments. Experiment with settings to find the best fit for your trading style, and use the toggleable labels to keep your chart clean when needed.

Algoway V4.2📌 Algoway V4.2 — Multi-layered Strategy Powered by ADX, MACD & PSO
Overview
Algoway V4.2 is a layered algorithmic strategy designed for volatility-rich assets like cryptocurrencies. While some core components (such as PSO, MACD, and ADX oscillators) are adapted from known indicator models, the original logic, state tracking, and Candle Strength Oscillator (CSO) are fully custom-developed.
This strategy is not a simple combination of tools — it implements a conditional entry-exit logic system based on ADX zone transitions, momentum structure, and MACD/PSO signal synchronization, enhanced by custom-built CSO filtering.
🧠 Key Modules and How They Work Together
PSO (Premium Stochastic Oscillator)
Used to confirm local oversold/overbought pressure. Acts as a directional filter.
MACD (Normalized)
Volatility-normalized MACD values allow consistent signal detection even on volatile pairs. It triggers entries when momentum begins shifting.
ADX Zonal Logic
Divides the market into Range / MidRange / Trend Peak zones. Entries are allowed only under specific transitions — e.g., long entries only in yellow (low volatility) zones or in trend climax zones under certain pullbacks.
CSO (Candle Strength Oscillator) — Custom Module
Designed to measure real candle momentum and price structure consistency. It avoids false breakouts and filters trend fatigue.
🔁 How Logic Works
Strategy maintains state variables to track entry type and zone.
Exit conditions depend on the entry origin: entries from "Range" exit in "Peak", while "Peak" entries exit during pullbacks or mid-strength trend reversals.
Additional logic prevents entries when signals are not aligned across modules, minimizing noise.
Optional CSO module acts as a final microstructure confirmation before executing MACD-based midpoint entries.
📊 Example Parameters (for 5M crypto scalping)
Each module is tuned to respond to 5-minute crypto volatility:
Stochastic: fast response, tight thresholds
MACD: shortened EMAs, normalized
ADX: traditional smoothing, custom thresholds for zone switching
CSO: candle-based dynamic filter with visual zone mapping
🧪 Conclusion
Algoway V4.2 is not a script merger — it is a custom logic engine using familiar technical components but governed by a proprietary decision model, with additional filters and dynamic variable tracking.
It’s suitable for scalping or swing setups, and the internal logic is optimized for real trading conditions, not just visual backtests.

Commodity Trend Reactor [BigBeluga]
🔵 OVERVIEW
A dynamic trend-following oscillator built around the classic CCI, enhanced with intelligent price tracking and reversal signals.
Commodity Trend Reactor extends the traditional Commodity Channel Index (CCI) by integrating trend-trailing logic and reactive reversal markers. It visualizes trend direction using a trailing stop system and highlights potential exhaustion zones when CCI exceeds extreme thresholds. This dual-level system makes it ideal for both trend confirmation and mean-reversion alerts.
🔵 CONCEPTS
Based on the CCI (Commodity Channel Index) oscillator, which measures deviation from the average price.
Trend bias is determined by whether CCI is above or below user-defined thresholds.
Trailing price bands are used to lock in trend direction visually on the main chart.
Extreme values beyond ±200 are treated as potential reversal zones.
🔵 FEATURES\
CCI-Based Trend Shifts:
Triggers a bullish bias when CCI crosses above the upper threshold, and bearish when it crosses below the lower threshold.
Adaptive Trailing Stops:
In bullish mode, a trailing stop tracks the lowest price; in bearish mode, it tracks the highest.
Top & Bottom Markers:
When CCI surpasses +200 or drops below -200, it plots colored squares both on the oscillator and on price, marking potential reversal zones.
Background Highlights:
Each time a trend shift occurs, the background is softly colored (lime for bullish, orange for bearish) to highlight the change.
🔵 HOW TO USE
Use the oscillator to monitor when CCI crosses above or below threshold values to detect trend activation.
Enter trades in the direction of the trailing band once the trend bias is confirmed.
Watch for +200 and -200 square markers as warnings of potential mean reversals.
Use trailing stop areas as dynamic support/resistance to manage stop loss and exit strategies.
The background color changes offer clean confirmation of trend transitions on chart.
🔵 CONCLUSION
Commodity Trend Reactor transforms the simple CCI into a complete trend-reactive framework. With real-time trailing logic and clear reversal alerts, it serves both momentum traders and contrarian scalpers alike. Whether you’re trading breakouts or anticipating mean reversions, this indicator provides clarity and structure to your decision-making.

The Strat The Strat Bar Type Identifier – Pure Price Action Logic
This open-source indicator implements the foundational bar classification of "The Strat" method developed by Rob Smith. It identifies each candle on the chart as one of the three core types used in The Strat:
* Inside Bar (1): The candle’s range is fully within the previous candle’s range. This indicates consolidation or balance and often precedes breakouts or reversals.
* Two-Up Bar (2U): The current candle breaks the previous high but does not break its low. This is considered bullish directional movement.
* Two-Down Bar (2D): The current candle breaks the previous low but not the high. This signals bearish directional movement.
* Outside Bar (3): The candle breaks both the high and the low of the previous candle, signaling a broadening formation and high volatility.
The script plots a character below each candle based on its type:
* "1" for Inside Bar
* "2" for Two-Up or Two-Down (color-coded)
* "3" for Outside Bar
This tool helps traders quickly identify actionable setups according to The Strat method and serves as a foundation for more advanced strategies like the 3-1-2 reversal or 1-2-2 continuation.
All calculations are based purely on price action—no indicators, no smoothing, no lagging elements. It is ideal for traders looking to understand price structure and bar sequencing from a Strat perspective.
To use:
1. Add the indicator to any chart and timeframe.
2. Look for the numbers below the candles.
3. Analyze the sequence of bar types to spot Strat setups.
This script is educational and can be extended with multi-timeframe context, FTFC logic, actionable signals, or broadening formation detection.
Clean, minimal, and faithful to the core principles of The Strat.

Candle Range Trading (CRT) with Alerts
📌 Description:
The Candle Range Trading (CRT) indicator identifies potential reversal or continuation setups based on specific two-candle price action patterns.
It analyzes pairs of candles to detect Bullish or Bearish CRT patterns and provides visual signals (triangles) and alert notifications to support scalp or swing trading strategies.
🔍 How It Works:
🔻 Bearish CRT Pattern:
Candle 1 is bullish
Candle 2 is bearish
Candle 2's high > Candle 1's high
Candle 2 closes within Candle 1’s range
🔺 Red triangle above candle
🔺 Bullish CRT Pattern:
Candle 1 is bearish
Candle 2 is bullish
Candle 2's low < Candle 1's low
Candle 2 closes within Candle 1’s range
🔻 Green triangle below candle
📈 Visual Features:
🔺 Red triangle = Bearish CRT
🔻 Green triangle = Bullish CRT
📏 Optional box showing CRT High and CRT Low
🔔 Built-in Alerts:
Bullish CRT Alert: "Bullish CRT Pattern Detected"
Bearish CRT Alert: "Bearish CRT Pattern Detected"
Set alerts to get notified instantly when a pattern is detected.
⚠️ Note:
Use in conjunction with trend filters, support/resistance, or volume for best results.
Ideal for scalping or short-term trades.
Avoid trading in choppy or low-volume markets.
⚠️ Disclaimer:
This script was generated with the assistance of ChatGPT by OpenAI and is intended for educational and informational purposes only.
All strategies, alerts, and signals derived from this indicator should be thoroughly backtested and validated before using in live trading.
Trading involves substantial risk, and past performance is not indicative of future results. The author and ChatGPT bear no responsibility for any trading losses or financial decisions made using this script.
Users are solely responsible for the risks associated with their trading actions. Always apply proper risk management and perform your own due diligence before making any financial decisions.

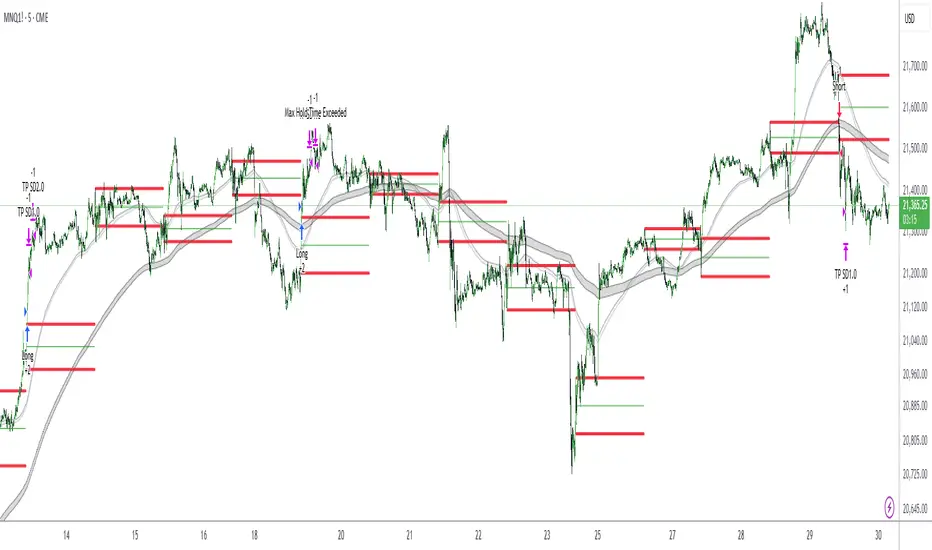
Antony.N4A -NQ ORB Quartile Str v6.3Antony.N4A – NQ ORB Quartile Strategy v6.3
A precision-engineered intraday breakout system built for the Nasdaq futures market, combining the Opening Range Breakout (ORB) logic with dynamic standard deviation targets, structural filters, and multi-layer risk management.
🧠 Key Features
Opening Range Breakout (ORB):
Automatically defines a breakout window (default: 09:30–09:45) and triggers entries when price breaks the high or low of that range.
Standard Deviation Profit Targets:
Supports SD0.5, SD1.0, SD1.5, and SD2.0 targets relative to the ORB range.
EMA Filtering (200-period):
Filters trades based on EMA direction and price position to validate breakout direction and avoid false entries.
Range Filtering:
Detects directional bias and volatility trends using smoothed range logic.
Momentum Triggering:
Validates breakout momentum and allows entries when directional momentum is positive and increasing.
⚙️ User Inputs
ORB Settings: Timeframe, session, and timezone customization
Entry Window: Define when trades are allowed to trigger
Day Filters: Enable/disable trading by weekday
SD Targets: Configure exit % and active levels (SD0.5 – SD2.0)
EMA Filter & Sensitivity
Cross Filter (Anti-chop logic)
Range Filter Parameters
Visual Toggles: ORB range, SD levels, EMA clouds
🎯 Trade Management Rules
Entry:
Triggered at the close of a 5-minute candle confirming a breakout of the ORB range.
Stop Loss:
Defined by structural invalidation (quartile boundaries & mid-range buffers).
Take Profit Strategy:
75% closed at SD1.0 level
Remaining 25% trailed to further SD2 target
SL is moved to breakeven after partial exit
Execution Controls:
No pyramiding
No re-entries (cooldown enforced)
🔧 Trading Modes
✅ Safe Mode
EMA Filter: Enabled
EMA Sensitivity: 19
Range Filter: Disabled
Ideal for conservative setups and reduced noise environments
🔥 Aggressive Mode
EMA Filter: Enabled
EMA Sensitivity: 5
Range Filter: Disabled
Suited for high-frequency setups and faster breakouts
📊 Backtest Performance (7-Month Sample)
Safe Mode:
Win Rate: 66%
Total Trades: 29
Net PnL: +21.79R (~$4,357 with R = $200)
Max Red Days: 3
Max Drawdown: -$663
Best Month: +9R, Worst Month: -2R
Aggressive Mode:
Win Rate: 63%
Total Trades: 52
Net PnL: +30R (~$6,080)
Max Red Days: 6
Max Drawdown: -$1,357
Best Month: +12R, Worst Month: -3.2R
👨💻 Developed by Antony.N4A
This tool is crafted for strategic intraday traders, system developers, and backtesters.
For access, customization, or licensing options, contact the developer directly.
Protected script. Redistribution or reuse without permission is prohibited.
Price Statistical Strategy-Z Score V 1.01
Price Statistical Strategy – Z Score V 1.01
Overview
A technical breakdown of the logic and components of the “Price Statistical Strategy – Z Score V 1.01”.
This script implements a smoothed Z-Score crossover mechanism applied to the closing price to detect potential statistical deviations from local price mean. The strategy operates solely on price data (close) and includes signal spacing control and momentum-based candle filters. No volume-based or trend-detection components are included.
Core Methodology
The strategy is built on the statistical concept of Z-Score, which quantifies how far a value (closing price) is from its recent average, normalized by standard deviation. Two moving averages of the raw Z-Score are calculated: a short-term and a long-term smoothed version. The crossover between them generates long entries and exits.
Signal Conditions
Entry Condition:
A long position is opened when the short-term smoothed Z-Score crosses above the long-term smoothed Z-Score, and additional entry conditions are met.
Exit Condition:
The position is closed when the short-term Z-Score crosses below the long-term Z-Score, provided the exit conditions allow.
Signal Gapping:
A minimum number of bars (Bars gap between identical signals) must pass between repeated entry or exit signals to reduce noise.
Momentum Filter:
Entries are prevented during sequences of three or more consecutively bullish candles, and exits are prevented during three or more consecutively bearish candles.
Z-Score Function
The Z-Score is calculated as:
Z = (Close - SMA(Close, N)) / STDEV(Close, N)
Where N is the base period selected by the user.
Input Parameters
Enable Smoothed Z-Score Strategy
Enables or disables the Z-Score strategy logic. When disabled, no trades are executed.
Z-Score Base Period
Defines the number of bars used to calculate the simple moving average and standard deviation for the Z-Score. This value affects how responsive the raw Z-Score is to price changes.
Short-Term Smoothing
Sets the smoothing window for the short-term Z-Score. Higher values produce smoother short-term signals, reducing sensitivity to short-term volatility.
Long-Term Smoothing
Sets the smoothing window for the long-term Z-Score, which acts as the reference line in the crossover logic.
Bars gap between identical signals
Minimum number of bars that must pass before another signal of the same type (entry or exit) is allowed. This helps reduce redundant or overly frequent signals.
Trade Visualization Table
A table positioned at the bottom-right displays live PnL for open trades:
Entry Price
Unrealized PnL %
Text colors adapt based on whether unrealized profit is positive, negative, or neutral.
Technical Notes
This strategy uses only close prices — no trend indicators or volume components are applied.
All calculations are based on simple moving averages and standard deviation over user-defined windows.
Designed as a minimal, isolated Z-Score engine without confirmation filters or multi-factor triggers.

Breaker Blocks & Unicorns (with Deviations) by RiseBreaker Block and Unicorns (with Deviations) - The Highest Probability ICT Pattern
This advanced indicator identifies and tracks ICT Breaker Blocks, while incorporating powerful supplementary features including Unicorn patterns and customizable deviation levels.
These patterns develop through a precise market structure sequence culminating in structural breaks. Following Breaker Block confirmation, users can optionally enable highly customizable deviation levels. Additionally, the indicator can scan active Breaker Blocks for overlapping Fair Value Gaps (FVGs) and Inverted Fair Value Gaps (IFVGs)-(also known as "Unicorns") that represent high-probability trading opportunities, highly regarded in the ICT community.
This comprehensive tool provides unmatched functionality for traders and analysts seeking to track, backtest, and execute Breaker Block strategies. With its extensive feature set and granular customization options, it delivers capabilities that surpass existing alternatives in the market.
What is an ICT Breaker Block?
To explain this, we must understand the ABC sequence that form this pattern. It consists of:
Initial range (from A -> B)
First break point, commonly called "Manipulation" (C)
Second break, which is when the pattern is formed.
Each of these "points" consist of pivot levels, with an adjustable strength.
Breaker Blocks are invalidated and made inactive if price breaks the "C point", or manipulation.
Unicorns
Unicorns are Fair Value Gaps or Inverted Fair Value Gaps that overlap a Breaker Block. Breakers have their associated Unicorn, which is updated until price retraces into said gap.
Standard Deviations
This indicator has options to display deviations based on Breaker Blocks:
Breaker Deviations -> using the initial range (A -> B).
Manipulation Deviations -> using the manipulation (B -> C).
Input Settings:
This tool offers a lot of customizable options, which could be overwhelming to some users. Below you will find an in-depth definition of every input's purpose, to complement the tooltips that can be found directly in the indicator's settings.
Mode ⚙️
Default -> Displays every Breaker Block pattern found.
Bullish -> Displays every Bullish Breaker Block found.
Bearish -> Displays every Bearish Breaker Block found.
Reversals -> Displays alternate Breaker Blocks (Bearish -> Bullish -> Bearish and so on).
This is paired with a Historical input, to select the amount of previous Breakers to display.
Extend 📏
Last -> This option will extend the most recent Breaker's drawings.
Specified -> Extend Breakers a preset amount of bars.
All -> Extend all active Breakers to the current bar.
None -> Never extend Breaker Blocks.
Each object has it's specific " offset " parameter, which defines the amount of bars to extend drawings past the current bar.
Parameters
This section defines the main parameters used to define the Breaker Block pattern.
Time Filter -> Optional session to filter Breakers based on time of day.
Pivot Strength -> Determines how many consecutive bars to the left of a pivot must be lower (for highs) or higher (for lows) to confirm it as a point.
Range Lookback -> Amount of ranges that the indicator will keep track for each direction.
Breaker Type -> Defines how a Breaker Block is displayed:
Range -> Entire initial range.
Consecutive -> Last consecutive onside candles (upclose for bullish, downclose for bearish).
Last -> Last onside candle.
Breaker Offset -> Amount of bars to extend Breaker Blocks past the current bar.
Use Candle Bodies? -> Use bar open to close rather than high to low.
Require Candle Close? -> Use bar close to form Breaker Blocks.
Remove After Invalidation? -> Remove drawings for invalidated Breakers.
Style
Breaker Block boxes styling based on directions.
Optional Middle Line and styling.
Optional Signals for Breaker Block formation:
Triangle label with adjustable sizing on the formation bar.
Line with custom styling at breakout point to the formation bar.
Unicorn Fair Value Gaps
Checkbox to display Unicorns with adjustable "FVGs", "IFVGs", or "Both" types.
Overlap Threshold -> Distance away from Breaker to still consider an "overlap".
Unicorn Offset -> Amount of bars to extend unicorn gaps past the current bar.
Lines styling.
Optional Middle Line and styling.
Include Volume Imbalances? -> Include adjacent VIs as part of Fair Value Gaps.
Extend until Reached? -> Extend Unicorn drawings until price reaches them.
Deviations
Checkbox to display Standard Deviations with adjustable types and levels.
Lines styling.
Text size and positioning.
Extend until Reached? -> Extend deviation lines until price reaches them.
Text
Label contents:
Default -> "+/- Breaker".
Abbreviation -> "+/- BB".
None -> No text.
Size .
Font (Default or Monospace) and Format (None, Italic or Bold).
Align -> vertical and horizontal positioning.
This indicator is for educational and informational purposes only. Past performance and historical patterns do not guarantee future results. Trading involves substantial risk of loss and is not suitable for all investors. Always conduct your own analysis and consider your financial situation before making any trading decisions. The identification of patterns does not constitute trading advice.
For any additional questions and/or feedback related to this indicator, users can comment below!

Candle Volume Profile Marker# 📊 Candle Volume Profile Marker (CVPM)
**Transform your chart analysis with precision volume profile levels on every candle!**
The Candle Volume Profile Marker displays key volume profile levels (POC, VAH, VAL) for individual candles, giving you granular insights into price acceptance and rejection zones at the micro level.
## 🎯 **Key Features**
### **Core Levels**
- **POC (Point of Control)** - The price level with highest volume concentration
- **VAH (Value Area High)** - Upper boundary of the value area
- **VAL (Value Area Low)** - Lower boundary of the value area
- **Customizable Value Area** - Adjust percentage from 50% to 90%
### **Flexible Display Options**
- **Current Candle Only** or **Historical Lookback** (1-50 candles)
- **Multiple Visual Styles** - Lines, dots, crosses, triangles, squares, diamonds
- **Smart Line Extensions** - Right only, both sides, or left only
- **4 Line Length Modes** - Normal, Short, Ultra Short, Micro (for ultra-clean charts)
- **Full Color Customization** - Colors, opacity, line width
- **Adjustable Marker Sizes** - Tiny to Large
### **Advanced Calculation Methods**
Choose your POC calculation:
- **Weighted** - Smart estimation based on volume distribution (default)
- **Close** - Uses closing price
- **Middle** - High-Low midpoint
- **VWAP** - Volume weighted average price
### **Professional Tools**
- **Real-time Info Table** - Current levels display
- **Smart Alerts** - POC crosses and Value Area breakouts
- **Highlight Current Candle** - Extended dotted lines for current levels
- **Developing Levels** - Real-time updates for active candle
## 🚀 **Why Use CVPM?**
### **Precision Trading**
- Identify exact support/resistance on each candle
- Spot volume acceptance/rejection zones
- Plan entries and exits with micro-level precision
### **Clean & Customizable**
- Lines extend only right (eliminates confusion)
- Ultra-short line options for minimal chart clutter
- Professional appearance with full customization
### **Multiple Timeframes**
- Works on any timeframe from 1-minute to monthly
- Historical analysis with adjustable lookback
- Real-time developing levels
## 📈 **Perfect For**
- **Day Traders** - Micro-level entry/exit points
- **Swing Traders** - Key levels for position management
- **Volume Analysis** - Understanding price acceptance zones
- **Support/Resistance Trading** - Precise level identification
- **Breakout Trading** - Value area breakout alerts
## ⚙️ **Easy Setup**
1. Add indicator to your chart
2. Choose your preferred visual style (lines/dots)
3. Select line extension (right-only recommended)
4. Adjust line length (try "Ultra Short" for clean charts)
5. Customize colors and enable alerts
## 🎨 **Customization Groups**
- **Display Options** - What to show and how many candles
- **Calculation** - POC method and value area percentage
- **POC Visual** - Style, color, width, length for Point of Control
- **Value Area Visual** - Style, color, width, length for VAH/VAL
- **Line Settings** - Extension direction and length modes
- **Size** - Marker sizes and opacity
## 🔔 **Built-in Alerts**
- Price crosses above/below POC
- Value Area breakouts (up/down)
- Fully customizable alert messages
## 💡 **Pro Tips**
- Use "Right Only" extension to avoid confusion about which candle owns the levels
- Try "Ultra Short" or "Micro" line modes for cleaner charts
- Enable "Highlight Current Candle" for extended reference lines
- Combine with volume indicators for enhanced analysis
- Use different colors for easy POC/VAH/VAL identification
---
**Transform your volume analysis today with the most flexible and customizable candle-level volume profile indicator available!**
*Perfect for traders who demand precision and clean, professional charts.*

Bullish Bearish Signal with EMA Color + LabelsThis script generates clear BUY and SELL signals based on a combination of trend direction, momentum, and confirmation from multiple indicators. It is intended to help traders identify strong bullish or bearish conditions using commonly trusted tools: EMA 200, MACD, and RSI.
🔍 How it works:
The strategy combines three key elements:
EMA 200 Trend Filter
Identifies the long-term trend:
Price above EMA200 → Bullish trend bias
Price below EMA200 → Bearish trend bias
The EMA line is color-coded:
🔵 Blue for bullish
🔴 Red for bearish
⚪ Gray for neutral/unclear
MACD Crossover
Detects shifts in market momentum:
Bullish: MACD line crosses above signal line
Bearish: MACD line crosses below signal line
RSI Confirmation
Adds an extra layer of confirmation:
Bullish: RSI is above its signal line
Bearish: RSI is below its signal line
✅ Signal Logic:
BUY Signal appears when:
Price > EMA200
MACD crosses up
RSI > its signal line
SELL Signal appears when:
Price < EMA200
MACD crosses down
RSI < its signal line
Labels will appear on the chart to highlight these events.
🔔 Alerts:
The script includes alerts for both Buy and Sell conditions, so you can be notified in real-time when they occur.
📈 How to Use:
Best used in trending markets.
Recommended for higher timeframes (1H and above).
May be combined with other tools such as support/resistance or candlestick analysis.
⚠️ Disclaimer: This script is intended for educational purposes only and does not constitute financial advice or a trading recommendation.

FVG Premium [no1x]█ OVERVIEW
This indicator provides a comprehensive toolkit for identifying, visualizing, and tracking Fair Value Gaps (FVGs) across three distinct timeframes (current chart, a user-defined Medium Timeframe - MTF, and a user-defined High Timeframe - HTF). It is designed to offer traders enhanced insight into FVG dynamics through detailed state monitoring (formation, partial fill, full mitigation, midline touch), extensive visual customization for FVG representation, and a rich alert system for timely notifications on FVG-related events.
█ CONCEPTS
This indicator is built upon the core concept of Fair Value Gaps (FVGs) and their significance in price action analysis, offering a multi-layered approach to their detection and interpretation across different timeframes.
Fair Value Gaps (FVGs)
A Fair Value Gap (FVG), also known as an imbalance, represents a range in price delivery where one side of the market (buying or selling) was more aggressive, leaving an inefficiency or an "imbalance" in the price action. This concept is prominently featured within Smart Money Concepts (SMC) and Inner Circle Trader (ICT) methodologies, where such gaps are often interpreted as footprints left by "smart money" due to rapid, forceful price movements. These methodologies suggest that price may later revisit these FVG zones to rebalance a prior inefficiency or to seek liquidity before continuing its path. These gaps are typically identified by a three-bar pattern:
Bullish FVG : This is a three-candle formation where the second candle shows a strong upward move. The FVG is the space created between the high of the first candle (bottom of FVG) and the low of the third candle (top of FVG). This indicates a strong upward impulsive move.
Bearish FVG : This is a three-candle formation where the second candle shows a strong downward move. The FVG is the space created between the low of the first candle (top of FVG) and the high of the third candle (bottom of FVG). This indicates a strong downward impulsive move.
FVGs are often watched by traders as potential areas where price might return to "rebalance" or find support/resistance.
Multi-Timeframe (MTF) Analysis
The indicator extends FVG detection beyond the current chart's timeframe (Low Timeframe - LTF) to two higher user-defined timeframes: Medium Timeframe (MTF) and High Timeframe (HTF). This allows traders to:
Identify FVGs that might be significant on a broader market structure.
Observe how FVGs from different timeframes align or interact.
Gain a more comprehensive perspective on potential support and resistance zones.
FVG State and Lifecycle Management
The indicator actively tracks the lifecycle of each detected FVG:
Formation : The initial identification of an FVG.
Partial Fill (Entry) : When price enters but does not completely pass through the FVG. The indicator updates the "current" top/bottom of the FVG to reflect the filled portion.
Midline (Equilibrium) Touch : When price touches the 50% level of the FVG.
Full Mitigation : When price completely trades through the FVG, effectively "filling" or "rebalancing" the gap. The indicator records the mitigation time.
This state tracking is crucial for understanding how price interacts with these zones.
FVG Classification (Large FVG)
FVGs can be optionally classified as "Large FVGs" (LV) if their size (top to bottom range) exceeds a user-defined multiple of the Average True Range (ATR) for that FVG's timeframe. This helps distinguish FVGs that are significantly larger relative to recent volatility.
Visual Customization and Information Delivery
A key concept is providing extensive control over how FVGs are displayed. This control is achieved through a centralized set of visual parameters within the indicator, allowing users to configure numerous aspects (colors, line styles, visibility of boxes, midlines, mitigation lines, labels, etc.) for each timeframe. Additionally, an on-chart information panel summarizes the nearest unmitigated bullish and bearish FVG levels for each active timeframe, providing a quick glance at key price points.
█ FEATURES
This indicator offers a rich set of features designed to provide a highly customizable and comprehensive Fair Value Gap (FVG) analysis experience. Users can tailor the FVG detection, visual representation, and alerting mechanisms across three distinct timeframes: the current chart (Low Timeframe - LTF), a user-defined Medium Timeframe (MTF), and a user-defined High Timeframe (HTF).
Multi-Timeframe FVG Detection and Display
The core strength of this indicator lies in its ability to identify and display FVGs from not only the current chart's timeframe (LTF) but also from two higher, user-selectable timeframes (MTF and HTF).
Timeframe Selection: Users can specify the exact MTF (e.g., "60", "240") and HTF (e.g., "D", "W") through dedicated inputs in the "MTF (Medium Timeframe)" and "HTF (High Timeframe)" settings groups. The visibility of FVGs from these higher timeframes can be toggled independently using the "Show MTF FVGs" and "Show HTF FVGs" checkboxes.
Consistent Detection Logic: The FVG detection logic, based on the classic three-bar imbalance pattern detailed in the 'Concepts' section, is applied consistently across all selected timeframes (LTF, MTF, HTF)
Timeframe-Specific Visuals: Each timeframe's FVGs (LTF, MTF, HTF) can be customized with unique colors for bullish/bearish states and their mitigated counterparts. This allows for easy visual differentiation of FVGs originating from different market perspectives.
Comprehensive FVG Visualization Options
The indicator provides extensive control over how FVGs are visually represented on the chart for each timeframe (LTF, MTF, HTF).
FVG Boxes:
Visibility: Main FVG boxes can be shown or hidden per timeframe using the "Show FVG Boxes" (for LTF), "Show Boxes" (for MTF/HTF) inputs.
Color Customization: Colors for bullish, bearish, active, and mitigated FVG boxes (including Large FVGs, if classified) are fully customizable for each timeframe.
Box Extension & Length: FVG boxes can either be extended to the right indefinitely ("Extend Boxes Right") or set to a fixed length in bars ("Short Box Length" or "Box Length" equivalent inputs).
Box Labels: Optional labels can display the FVG's timeframe and fill percentage on the box. These labels are configurable for all timeframes (LTF, MTF, and HTF). Please note: If FVGs are positioned very close to each other on the chart, their respective labels may overlap. This can potentially lead to visual clutter, and it is a known behavior in the current version of the indicator.
Box Borders: Visibility, width, style (solid, dashed, dotted), and color of FVG box borders are customizable per timeframe.
Midlines (Equilibrium/EQ):
Visibility: The 50% level (midline or EQ) of FVGs can be shown or hidden for each timeframe.
Style Customization: Width, style, and color of the midline are customizable per timeframe. The indicator tracks if this midline has been touched by price.
Mitigation Lines:
Visibility: Mitigation lines (representing the FVG's opening level that needs to be breached for full mitigation) can be shown or hidden for each timeframe. If shown, these lines are always extended to the right.
Style Customization: Width, style, and color of the mitigation line are customizable per timeframe.
Mitigation Line Labels: Optional price labels can be displayed on mitigation lines, with a customizable horizontal bar offset for positioning. For optimal label placement, the following horizontal bar offsets are recommended: 4 for LTF, 8 for MTF, and 12 for HTF.
Persistence After Mitigation: Users can choose to keep mitigation lines visible even after an FVG is fully mitigated, with a distinct color for such lines. Importantly, this option is only effective if the general setting 'Hide Fully Mitigated FVGs' is disabled, as otherwise, the entire FVG and its lines will be removed upon mitigation.
FVG State Management and Behavior
The indicator tracks and visually responds to changes in FVG states.
Hide Fully Mitigated FVGs: This option, typically found in the indicator's general settings, allows users to automatically remove all visual elements of an FVG from the chart once price has fully mitigated it. This helps maintain chart clarity by focusing on active FVGs.
Partial Fill Visualization: When price enters an FVG, the indicator offers a dynamic visual representation: the portion of the FVG that has been filled is shown as a "mitigated box" (typically with a distinct color), while the original FVG box shrinks to clearly highlight the remaining, unfilled portion. This two-part display provides an immediate visual cue about how much of the FVG's imbalance has been addressed and what potential remains within the gap.
Visual Filtering by ATR Proximity: To help users focus on the most relevant price action, FVGs can be dynamically hidden if they are located further from the current price than a user-defined multiple of the Average True Range (ATR). This behavior is controlled by the "Filter Band Width (ATR Multiple)" input; setting this to zero disables the filter entirely, ensuring all detected FVGs remain visible regardless of their proximity to price.
Alternative Usage Example: Mitigation Lines as Key Support/Resistance Levels
For traders preferring a minimalist chart focused on key Fair Value Gap (FVG) levels, the indicator's visualization settings can be customized to display only FVG mitigation lines. This approach leverages these lines as potential support and resistance zones, reflecting areas where price might revisit to address imbalances.
To configure this view:
Disable FVG Boxes: Turn off "Show FVG Boxes" (for LTF) or "Show Boxes" (for MTF/HTF) for the desired timeframes.
Hide Midlines: Disable the visibility of the 50% FVG Midlines (Equilibrium/EQ).
Ensure Mitigation Lines are Visible: Keep "Mitigation Lines" enabled.
Retain All Mitigation Lines:
Disable the "Hide Fully Mitigated FVGs" option in the general settings.
Enable the feature to "keep mitigation lines visible even after an FVG is fully mitigated". This ensures lines from all FVGs (active or fully mitigated) remain on the chart, which is only effective if "Hide Fully Mitigated FVGs" is disabled.
This setup offers:
A Decluttered Chart: Focuses solely on the FVG opening levels.
Precise S/R Zones: Treats mitigation lines as specific points for potential price reactions.
Historical Level Analysis: Includes lines from past, fully mitigated FVGs for a comprehensive view of significant price levels.
For enhanced usability with this focused view, consider these optional additions:
The on-chart Information Panel can be activated to display a quick summary of the nearest unmitigated FVG levels.
Mitigation Line Labels can also be activated for clear price level identification. A customizable horizontal bar offset is available for positioning these labels; for example, offsets of 4 for LTF, 8 for MTF, and 12 for HTF can be effective.
FVG Classification (Large FVG)
This feature allows for distinguishing FVGs based on their size relative to market volatility.
Enable Classification: Users can enable "Classify FVG (Large FVG)" to identify FVGs that are significantly larger than average.
ATR-Based Threshold: An FVG is classified as "Large" if its height (price range) is greater than or equal to the Average True Range (ATR) of its timeframe multiplied by a user-defined "Large FVG Threshold (ATR Multiple)". The ATR period for this calculation is also configurable.
Dedicated Colors: Large FVGs (both bullish/bearish and active/mitigated) can be assigned unique colors, making them easily distinguishable on the chart.
Panel Icon: Large FVGs are marked with a special icon in the Info Panel.
Information Panel
An on-chart panel provides a quick summary of the nearest unmitigated FVG levels.
Visibility and Position: The panel can be shown/hidden and positioned in any of the nine standard locations on the chart (e.g., Top Right, Middle Center).
Content: It displays the price levels of the nearest unmitigated bullish and bearish FVGs for LTF, MTF (if active), and HTF (if active). It also indicates if these nearest FVGs are Large FVGs (if classification is enabled) using a selectable icon.
Styling: Text size, border color, header background/text colors, default text color, and "N/A" cell background color are customizable.
Highlighting: Background and text colors for the cells displaying the overall nearest bullish and bearish FVG levels (across all active timeframes) can be customized to draw attention to the most proximate FVG.
Comprehensive Alert System
The indicator offers a granular alert system for various FVG-related events, configurable for each timeframe (LTF, MTF, HTF) independently. Users can enable alerts for:
New FVG Formation: Separate alerts for new bullish and new bearish FVG formations.
FVG Entry/Partial Fill: Separate alerts for price entering a bullish FVG or a bearish FVG.
FVG Full Mitigation: Separate alerts for full mitigation of bullish and bearish FVGs.
FVG Midline (EQ) Touch: Separate alerts for price touching the midline of a bullish or bearish FVG.
Alert messages are detailed, providing information such as the timeframe, FVG type (bull/bear, Large FVG), relevant price levels, and timestamps.
█ NOTES
This section provides additional information regarding the indicator's usage, performance considerations, and potential interactions with the TradingView platform. Understanding these points can help users optimize their experience and troubleshoot effectively.
Performance and Resource Management
Maximum FVGs to Track : The "Max FVGs to Track" input (defaulting to 25) limits the number of FVG objects processed for each category (e.g., LTF Bullish, MTF Bearish). Increasing this value significantly can impact performance due to more objects being iterated over and potentially drawn, especially when multiple timeframes are active.
Drawing Object Limits : To manage performance, this script sets its own internal limits on the number of drawing objects it displays. While it allows for up to approximately 500 lines (max_lines_count=500) and 500 labels (max_labels_count=500), the number of FVG boxes is deliberately restricted to a maximum of 150 (max_boxes_count=150). This specific limit for boxes is a key performance consideration: displaying too many boxes can significantly slow down the indicator, and a very high number is often not essential for analysis. Enabling all visual elements for many FVGs across all three timeframes can cause the indicator to reach these internal limits, especially the stricter box limit
Optimization Strategies : To help you manage performance, reduce visual clutter, and avoid exceeding drawing limits when using this indicator, I recommend the following strategies:
Maintain or Lower FVG Tracking Count: The "Max FVGs to Track" input defaults to 25. I find this value generally sufficient for effective analysis and balanced performance. You can keep this default or consider reducing it further if you experience performance issues or prefer a less dense FVG display.
Utilize Proximity Filtering: I suggest activating the "Filter Band Width (ATR Multiple)" option (found under "General Settings") to display only those FVGs closer to the current price. From my experience, a value of 5 for the ATR multiple often provides a good starting point for balanced performance, but you should feel free to adjust this based on market volatility and your specific trading needs.
Hide Fully Mitigated FVGs: I strongly recommend enabling the "Hide Fully Mitigated FVGs" option. This setting automatically removes all visual elements of an FVG from the chart once it has been fully mitigated by price. Doing so significantly reduces the number of active drawing objects, lessens computational load, and helps maintain chart clarity by focusing only on active, relevant FVGs.
Disable FVG Display for Unused Timeframes: If you are not actively monitoring certain higher timeframes (MTF or HTF) for FVG analysis, I advise disabling their display by unchecking "Show MTF FVGs" or "Show HTF FVGs" respectively. This can provide a significant performance boost.
Simplify Visual Elements: For active FVGs, consider hiding less critical visual elements if they are not essential for your specific analysis. This could include box labels, borders, or even entire FVG boxes if, for example, only the mitigation lines are of interest for a particular timeframe.
Settings Changes and Platform Limits : This indicator is comprehensive and involves numerous calculations and drawings. When multiple settings are changed rapidly in quick succession, it is possible, on occasion, for TradingView to issue a "Runtime error: modify_study_limit_exceeding" or similar. This can cause the indicator to temporarily stop updating or display errors.
Recommended Approach : When adjusting settings, it is advisable to wait a brief moment (a few seconds) after each significant change. This allows the indicator to reprocess and update on the chart before another change is made
Error Recovery : Should such a runtime error occur, making a minor, different adjustment in the settings (e.g., toggling a checkbox off and then on again) and waiting briefly will typically allow the indicator to recover and resume correct operation. This behavior is related to platform limitations when handling complex scripts with many inputs and drawing objects.
Multi-Timeframe (MTF/HTF) Data and Behavior
HTF FVG Confirmation is Essential: : For an FVG from a higher timeframe (MTF or HTF) to be identified and displayed on your current chart (LTF), the three-bar pattern forming the FVG on that higher timeframe must consist of fully closed bars. The indicator does not draw speculative FVGs based on incomplete/forming bars from higher timeframes.
Data Retrieval and LTF Processing: The indicator may use techniques like lookahead = barmerge.lookahead_on for timely data retrieval from higher timeframes. However, the actual detection of an FVG occurs after all its constituent bars on the HTF have closed.
Appearance Timing on LTF (1 LTF Candle Delay): As a natural consequence of this, an FVG that is confirmed on an HTF (i.e., its third bar closes) will typically become visible on your LTF chart one LTF bar after its confirmation on the HTF.
Example: Assume an FVG forms on a 30-minute chart at 15:30 (i.e., with the close of the 30-minute bar that covers the 15:00-15:30 period). If you are monitoring this FVG on a 15-minute chart, the indicator will detect this newly formed 30-minute FVG while processing the data for the 15-minute bar that starts at 15:30 and closes at 15:45. Therefore, the 30-minute FVG will become visible on your 15-minute chart at the earliest by 15:45 (i.e., with the close of that relevant 15-minute LTF candle). This means the HTF FVG is reflected on the LTF chart with a delay equivalent to one LTF candle.
FVG Detection and Display Logic
Fair Value Gaps (FVGs) on the current chart timeframe (LTF) are detected based on barstate.isconfirmed. This means the three-bar pattern must be complete with closed bars before an FVG is identified. This confirmation method prevents FVGs from being prematurely identified on the forming bar.
Alerts
Alert Setup : To receive alerts from this indicator, you must first ensure you have enabled the specific alert conditions you are interested in within the indicator's own settings (see 'Comprehensive Alert System' under the 'FEATURES' section). Once configured, open TradingView's 'Create Alert' dialog. In the 'Condition' tab, select this indicator's name, and crucially, choose the 'Any alert() function call' option from the dropdown list. This setup allows the indicator to trigger alerts based on the precise event conditions you have activated in its settings
Alert Frequency : Alerts are designed to trigger once per bar close (alert.freq_once_per_bar_close) for the specific event.
User Interface (UI) Tips
Settings Group Icons: In the indicator settings menu, timeframe-specific groups are marked with star icons for easier navigation: 🌟 for LTF (Current Chart Timeframe), 🌟🌟 for MTF (Medium Timeframe), and 🌟🌟🌟 for HTF (High Timeframe).
Dependent Inputs: Some input settings are dependent on others being enabled. These dependencies are visually indicated in the settings menu using symbols like "↳" (dependent setting on the next line), "⟷" (mutually exclusive inline options), or "➜" (directly dependent inline option).
Settings Layout Overview: The indicator settings are organized into logical groups for ease of use. Key global display controls – such as toggles for MTF FVGs, HTF FVGs (along with their respective timeframe selectors), and the Information Panel – are conveniently located at the very top within the '⚙️ General Settings' group. This placement allows for quick access to frequently adjusted settings. Other sections provide detailed customization options for each timeframe (LTF, MTF, HTF), specific FVG components, and alert configurations.
█ FOR Pine Script® CODERS
This section provides a high-level overview of the FVG Premium indicator's internal architecture, data flow, and the interaction between its various library components. It is intended for Pine Script™ programmers who wish to understand the indicator's design, potentially extend its functionality, or learn from its structure.
System Architecture and Modular Design
The indicator is architected moduarly, leveraging several custom libraries to separate concerns and enhance code organization and reusability. Each library has a distinct responsibility:
FvgTypes: Serves as the foundational data definition layer. It defines core User-Defined Types (UDTs) like fvgObject (for storing all attributes of an FVG) and drawSettings (for visual configurations), along with enumerations like tfType.
CommonUtils: Provides utility functions for common tasks like mapping user string inputs (e.g., "Dashed" for line style) to their corresponding Pine Script™ constants (e.g., line.style_dashed) and formatting timeframe strings for display.
FvgCalculations: Contains the core logic for FVG detection (both LTF and MTF/HTF via requestMultiTFBarData), FVG classification (Large FVGs based on ATR), and checking FVG interactions with price (mitigation, partial fill).
FvgObject: Implements an object-oriented approach by attaching methods to the fvgObject UDT. These methods manage the entire visual lifecycle of an FVG on the chart, including drawing, updating based on state changes (e.g., mitigation), and deleting drawing objects. It's responsible for applying the visual configurations defined in drawSettings.
FvgPanel: Manages the creation and dynamic updates of the on-chart information panel, which displays key FVG levels.
The main indicator script acts as the orchestrator, initializing these libraries, managing user inputs, processing data flow between libraries, and handling the main event loop (bar updates) for FVG state management and alerts.
Core Data Flow and FVG Lifecycle Management
The general data flow and FVG lifecycle can be summarized as follows:
Input Processing: User inputs from the "Settings" dialog are read by the main indicator script. Visual style inputs (colors, line styles, etc.) are consolidated into a types.drawSettings object (defined in FvgTypes). Other inputs (timeframes, filter settings, alert toggles) control the behavior of different modules. CommonUtils assists in mapping some string inputs to Pine constants.
FVG Detection:
For the current chart timeframe (LTF), FvgCalculations.detectFvg() identifies potential FVGs based on bar patterns.
For MTF/HTF, the main indicator script calls FvgCalculations.requestMultiTFBarData() to fetch necessary bar data from higher timeframes, then FvgCalculations.detectMultiTFFvg() identifies FVGs.
Newly detected FVGs are instantiated as types.fvgObject and stored in arrays within the main script. These objects also undergo classification (e.g., Large FVG) by FvgCalculations.
State Update & Interaction: On each bar, the main indicator script iterates through active FVG objects to manage their state based on price interaction:
Initially, the main script calls FvgCalculations.fvgInteractionCheck() to efficiently determine if the current bar's price might be interacting with a given FVG.
If a potential interaction is flagged, the main script then invokes methods directly on the fvgObject instance (e.g., updateMitigation(), updatePartialFill(), checkMidlineTouch(), which are part of FvgObject).
These fvgObject methods are responsible for the detailed condition checking and the actual modification of the FVG's state. For instance, the updateMitigation() and updatePartialFill() methods internally utilize specific helper functions from FvgCalculations (like checkMitigation() and checkPartialMitigation()) to confirm the precise nature of the interaction before updating the fvgObject’s state fields (such as isMitigated, currentTop, currentBottom, or isMidlineTouched).
Visual Rendering:
The FvgObject.updateDrawings() method is called for each fvgObject. This method is central to drawing management; it creates, updates, or deletes chart drawings (boxes, lines, labels) based on the FVG's current state, its prev_* (previous bar state) fields for optimization, and the visual settings passed via the drawSettings object.
Information Panel Update: The main indicator script determines the nearest FVG levels, populates a panelData object (defined in FvgPanelLib), and calls FvgPanel.updatePanel() to refresh the on-chart display.
Alert Generation: Based on the updated FVG states and user-enabled alert settings, the main indicator script constructs and triggers alerts using Pine Script's alert() function."
Key Design Considerations
UDT-Centric Design: The fvgObject UDT is pivotal, acting as a stateful container for all information related to a single FVG. Most operations revolve around creating, updating, or querying these objects.
State Management: To optimize drawing updates and manage FVG lifecycles, fvgObject instances store their previous bar's state (e.g., prevIsVisible, prevCurrentTop). The FvgObject.updateDrawings() method uses this to determine if a redraw is necessary, minimizing redundant drawing calls.
Settings Object: A drawSettings object is populated once (or when inputs change) and passed to drawing functions. This avoids repeatedly reading numerous input() values on every bar or within loops, improving performance.
Dynamic Arrays for FVG Storage: Arrays are used to store collections of fvgObject instances, allowing for dynamic management (adding new FVGs, iterating for updates).

Multi-Indicator Trend-Following Strategy v6Multi-Indicator Trend-Following Strategy v6
This strategy uses a combination of technical indicators to identify potential trend-following trade entries and exits. It is intended for educational and research purposes.
How it works:
Moving Averages (EMA): Entry signals are generated on crossovers between a fast and slow exponential moving average.
RSI Filter: Confirms momentum with a threshold above/below 50 for long/short entries.
Volume Confirmation: Requires volume to exceed a moving average multiplied by a user-defined factor.
ATR-Based Risk Management: Stop loss and take profit levels are calculated using the Average True Range (ATR), allowing for dynamic risk control based on market volatility.
Customizable Inputs:
Fast/Slow MA lengths
RSI length and levels
MACD settings (used in calculation, not directly in signal)
Volume MA and multiplier
ATR period and multipliers for stop loss and take profit
Notes:
This strategy does not guarantee future results.
It is provided for analysis and backtesting only.
Alerts are available for buy/sell conditions.
Feel free to adjust parameters to explore different market conditions and asset classes.

[Remora] Previous Day Value This TradingView script plots horizontal lines showing the previous day’s high, low, and midpoint levels on your current chart. These lines help traders identify key support and resistance zones based on the last day’s price range.
🛠️ Features:
Previous Day High Line (🔴 Red):
Shows the highest price from the previous trading day.
Previous Day Low Line (🟢 Green):
Shows the lowest price from the previous trading day.
Previous Day Midpoint Line (🟣 Fuchsia, Dashed):
Shows the average of the previous day’s high and low — a useful reference for intraday bias or fair value.
Customizable Display:
You can turn each of these lines on or off using checkboxes in the settings.
This script will help traders make decisions like:
Watching for price rejection or breakout at these levels.
Identifying areas to take profits or set stops.


Long Explosive V1The “Long Explosive V1” strategy calculates the percentage change in price from the last closing price of the candlestick, so that if it increases by a certain percentage it goes long, but if it decreases by another percentage it sends an exit order, so that the percentage limits above and below the current price function as inherent stop loss and take profit, with the benefit of taking advantage of the volatility of the bull market.
Entries and exits are always at the market and based on percentage changes in the price. Of course, the default configuration of the strategy considers a position with a 5% risk control, modest initial capital and standard commissions, which helps to obtain realistic results and protect the user from unexpectedly controlled potential losses.
It is again emphasized that it is always advisable to adjust the parameters of the strategy well, so that the risk-reward is well controlled.

Arnaud Legoux Trend Aggregator | Lyro RSArnaud Legoux Trend Aggregator
Introduction
Arnaud Legoux Trend Aggregator is a custom-built trend analysis tool that blends classic market oscillators with advanced normalization, advanced math functions and Arnaud Legoux smoothing. Unlike conventional indicators, 𝓐𝓛𝓣𝓐 aggregates market momentum, volatility and trend strength.
Signal Insight
The 𝓐𝓛𝓣𝓐 line visually reflects the aggregated directional bias. A rise above the middle line threshold signals bullish strength, while a drop below the middle line indicates bearish momentum.
Another way to interpret the 𝓐𝓛𝓣𝓐 is through overbought and oversold conditions. When the 𝓐𝓛𝓣𝓐 rises above the +0.7 threshold, it suggests an overbought market and signals a strong uptrend. Conversely, a drop below the -0.7 level indicates an oversold condition and a strong downtrend.
When the oscillator hovers near the zero line, especially within the neutral ±0.3 band, it suggests that no single directional force is dominating—common during consolidation phases or pre-breakout compression.
Real-World Example
Usually 𝓐𝓛𝓣𝓐 is used by following the bar color for simple signals; however, like most indicators there are unique ways to use an indicator. Let’s dive deep into such ways.
The market begins with a green bar color, raising awareness for a potential long setup—but not a direct entry. In this methodology, bar coloring serves as an alert mechanism rather than a strict entry trigger.
The first long position was initiated when the 𝓐𝓛𝓣𝓐 signal line crossed above the +0.3 threshold, suggesting a shift in directional acceleration. This entry coincided with a rising price movement, validating the trade.
As price advanced, the position was exited into cash—not reversed into a short—because the short criteria for this use case are distinct. The exit was prompted by 𝓐𝓛𝓣𝓐 crossing back below the +0.3 level, signaling the potential weakening of the long trend.
Later, as 𝓐𝓛𝓣𝓐 crossed below 0, attention shifted toward short opportunities. A short entry was confirmed when 𝓐𝓛𝓣𝓐 dipped below -0.3, indicating growing downside momentum. The position was eventually closed when 𝓐𝓛𝓣𝓐 crossed back above the -0.3 boundary—signaling a possible deceleration of the bearish move.
This logic was consistently applied in subsequent setups, emphasizing the role of 𝓐𝓛𝓣𝓐’s thresholds in guiding both entries and exits.
Framework
The Arnaud Legoux Trend Aggregator (ALTA) combines multiple technical indicators into a single smoothed signal. It uses RSI, MACD, Bollinger Bands, Stochastic Momentum Index, and ATR.
Each indicator's output is normalized to a common scale to eliminate bias and ensure consistency. These normalized values are then transformed using a hyperbolic tangent function (Tanh).
The final score is refined with a custom Arnaud Legoux Moving Average (ALMA) function, which offers responsive smoothing that adapts quickly to price changes. This results in a clear signal that reacts efficiently to shifting market conditions.
⚠️ WARNING ⚠️: THIS INDICATOR, OR ANY OTHER WE (LYRO RS) PUBLISH, IS NOT FINANCIAL OR INVESTMENT ADVICE. EVERY INDICATOR SHOULD BE COMBINED WITH PRICE ACTION, FUNDAMENTALS, OTHER TECHNICAL ANALYSIS TOOLS & PROPER RISK. MANAGEMENT.

Mandelbrot-Fibonacci Cascade Vortex (MFCV)Mandelbrot-Fibonacci Cascade Vortex (MFCV) - Where Chaos Theory Meets Sacred Geometry
A Revolutionary Synthesis of Fractal Mathematics and Golden Ratio Dynamics
What began as an exploration into Benoit Mandelbrot's fractal market hypothesis and the mysterious appearance of Fibonacci sequences in nature has culminated in a groundbreaking indicator that reveals the hidden mathematical structure underlying market movements. This indicator represents months of research into chaos theory, fractal geometry, and the golden ratio's manifestation in financial markets.
The Theoretical Foundation
Mandelbrot's Fractal Market Hypothesis Traditional efficient market theory assumes normal distributions and random walks. Mandelbrot proved markets are fractal - self-similar patterns repeating across all timeframes with power-law distributions. The MFCV implements this through:
Hurst Exponent Calculation: H = log(R/S) / log(n/2)
Where:
R = Range of cumulative deviations
S = Standard deviation
n = Period length
This measures market memory:
H > 0.5: Trending (persistent) behavior
H = 0.5: Random walk
H < 0.5: Mean-reverting (anti-persistent) behavior
Fractal Dimension: D = 2 - H
This quantifies market complexity, where higher dimensions indicate more chaotic behavior.
Fibonacci Vortex Theory Markets don't move linearly - they spiral. The MFCV reveals these spirals using Fibonacci sequences:
Vortex Calculation: Vortex(n) = Price + sin(bar_index × φ / Fn) × ATR(Fn) × Volume_Factor
Where:
φ = 0.618 (golden ratio)
Fn = Fibonacci number (8, 13, 21, 34, 55)
Volume_Factor = 1 + (Volume/SMA(Volume,50) - 1) × 0.5
This creates oscillating spirals that contract and expand with market energy.
The Volatility Cascade System
Markets exhibit volatility clustering - Mandelbrot's "Noah Effect." The MFCV captures this through cascading volatility bands:
Cascade Level Calculation: Level(i) = ATR(20) × φ^i
Each level represents a different fractal scale, creating a multi-dimensional view of market structure. The golden ratio spacing ensures harmonic resonance between levels.
Implementation Architecture
Core Components:
Fractal Analysis Engine
Calculates Hurst exponent over user-defined periods
Derives fractal dimension for complexity measurement
Identifies market regime (trending/ranging/chaotic)
Fibonacci Vortex Generator
Creates 5 independent spiral oscillators
Each spiral follows a Fibonacci period
Volume amplification creates dynamic response
Cascade Band System
Up to 8 volatility levels
Golden ratio expansion between levels
Dynamic coloring based on fractal state
Confluence Detection
Identifies convergence of vortex and cascade levels
Highlights high-probability reversal zones
Real-time confluence strength calculation
Signal Generation Logic
The MFCV generates two primary signal types:
Fractal Signals: Generated when:
Hurst > 0.65 (strong trend) AND volatility expanding
Hurst < 0.35 (mean reversion) AND RSI < 35
Trend strength > 0.4 AND vortex alignment
Cascade Signals: Triggered by:
RSI > 60 AND price > SMA(50) AND bearish vortex
RSI < 40 AND price < SMA(50) AND bullish vortex
Volatility expansion AND trend strength > 0.3
Both signals implement a 15-bar cooldown to prevent overtrading.
Advanced Input System
Mandelbrot Parameters:
Cascade Levels (3-8):
Controls number of volatility bands
Crypto: 5-7 (high volatility)
Indices: 4-5 (moderate volatility)
Forex: 3-4 (low volatility)
Hurst Period (20-200):
Lookback for fractal calculation
Scalping: 20-50
Day Trading: 50-100
Swing Trading: 100-150
Position Trading: 150-200
Cascade Ratio (1.0-3.0):
Band width multiplier
1.618: Golden ratio (default)
Higher values for trending markets
Lower values for ranging markets
Fractal Memory (21-233):
Fibonacci retracement lookback
Uses Fibonacci numbers for harmonic alignment
Fibonacci Vortex Settings:
Spiral Periods:
Comma-separated Fibonacci sequence
Fast: "5,8,13,21,34" (scalping)
Standard: "8,13,21,34,55" (balanced)
Extended: "13,21,34,55,89" (swing)
Rotation Speed (0.1-2.0):
Controls spiral oscillation frequency
0.618: Golden ratio (balanced)
Higher = more signals, more noise
Lower = smoother, fewer signals
Volume Amplification:
Enables dynamic spiral expansion
Essential for stocks and crypto
Disable for forex (no central volume)
Visual System Architecture
Cascade Bands:
Multi-level volatility envelopes
Gradient coloring from primary to secondary theme
Transparency increases with distance from price
Fill between bands shows fractal structure
Vortex Spirals:
5 Fibonacci-period oscillators
Blue above price (bullish pressure)
Red below price (bearish pressure)
Multiple display styles: Lines, Circles, Dots, Cross
Dynamic Fibonacci Levels:
Auto-updating retracement levels
Smart update logic prevents disruption near levels
Distance-based transparency (closer = more visible)
Updates every 50 bars or on volatility spikes
Confluence Zones:
Highlighted boxes where indicators converge
Stronger confluence = stronger support/resistance
Key areas for reversal trades
Professional Dashboard System
Main Fractal Dashboard: Displays real-time:
Hurst Exponent with market state
Fractal Dimension with complexity level
Volatility Cascade status
Vortex rotation impact
Market regime classification
Signal strength percentage
Active indicator levels
Vortex Metrics Panel: Shows:
Individual spiral deviations
Convergence/divergence metrics
Real-time vortex positioning
Fibonacci period performance
Fractal Metrics Display: Tracks:
Dimension D value
Market complexity rating
Self-similarity strength
Trend quality assessment
Theory Guide Panel: Educational reference showing:
Mandelbrot principles
Fibonacci vortex concepts
Dynamic trading suggestions
Trading Applications
Trend Following:
High Hurst (>0.65) indicates strong trends
Follow cascade band direction
Use vortex spirals for entry timing
Exit when Hurst drops below 0.5
Mean Reversion:
Low Hurst (<0.35) signals reversal potential
Trade toward vortex spiral convergence
Use Fibonacci levels as targets
Tighten stops in chaotic regimes
Breakout Trading:
Monitor cascade band compression
Watch for vortex spiral alignment
Volatility expansion confirms breakouts
Use confluence zones for targets
Risk Management:
Position size based on fractal dimension
Wider stops in high complexity markets
Tighter stops when Hurst is extreme
Scale out at Fibonacci levels
Market-Specific Optimization
Cryptocurrency:
Cascade Levels: 5-7
Hurst Period: 50-100
Rotation Speed: 0.786-1.2
Enable volume amplification
Stock Indices:
Cascade Levels: 4-5
Hurst Period: 80-120
Rotation Speed: 0.5-0.786
Moderate cascade ratio
Forex:
Cascade Levels: 3-4
Hurst Period: 100-150
Rotation Speed: 0.382-0.618
Disable volume amplification
Commodities:
Cascade Levels: 4-6
Hurst Period: 60-100
Rotation Speed: 0.5-1.0
Seasonal adjustment consideration
Innovation and Originality
The MFCV represents several breakthrough innovations:
First Integration of Mandelbrot Fractals with Fibonacci Vortex Theory
Unique synthesis of chaos theory and sacred geometry
Novel application of Hurst exponent to spiral dynamics
Dynamic Volatility Cascade System
Golden ratio-based band expansion
Multi-timeframe fractal analysis
Self-adjusting to market conditions
Volume-Amplified Vortex Spirals
Revolutionary spiral calculation method
Dynamic response to market participation
Multiple Fibonacci period integration
Intelligent Signal Generation
Cooldown system prevents overtrading
Multi-factor confirmation required
Regime-aware signal filtering
Professional Analytics Dashboard
Institutional-grade metrics display
Real-time fractal analysis
Educational integration
Development Journey
Creating the MFCV involved overcoming numerous challenges:
Mathematical Complexity: Implementing Hurst exponent calculations efficiently
Visual Clarity: Displaying multiple indicators without cluttering
Performance Optimization: Managing array operations and calculations
Signal Quality: Balancing sensitivity with reliability
User Experience: Making complex theory accessible
The result is an indicator that brings PhD-level mathematics to practical trading while maintaining visual elegance and usability.
Best Practices and Guidelines
Start Simple: Use default settings initially
Match Timeframe: Adjust parameters to your trading style
Confirm Signals: Never trade MFCV signals in isolation
Respect Regimes: Adapt strategy to market state
Manage Risk: Use fractal dimension for position sizing
Color Themes
Six professional themes included:
Fractal: Balanced blue/purple palette
Golden: Warm Fibonacci-inspired colors
Plasma: Vibrant modern aesthetics
Cosmic: Dark mode optimized
Matrix: Classic green terminal
Fire: Heat map visualization
Disclaimer
This indicator is for educational and research purposes only. It does not constitute financial advice. While the MFCV reveals deep market structure through advanced mathematics, markets remain inherently unpredictable. Past performance does not guarantee future results.
The integration of Mandelbrot's fractal theory with Fibonacci vortex dynamics provides unique market insights, but should be used as part of a comprehensive trading strategy. Always use proper risk management and never risk more than you can afford to lose.
Acknowledgments
Special thanks to Benoit Mandelbrot for revolutionizing our understanding of markets through fractal geometry, and to the ancient mathematicians who discovered the golden ratio's universal significance.
"The geometry of nature is fractal... Markets are fractal too." - Benoit Mandelbrot
Revealing the Hidden Order in Market Chaos Trade with Mathematical Precision. Trade with MFCV.
— Created with passion for the TradingView community
Trade with insight. Trade with anticipation.
— Dskyz , for DAFE Trading Systems

Gann Single SwingGann Single Swing Indicator
The Gann Single Swing indicator is a sophisticated tool rooted in the geometric and cyclical market analysis principles pioneered by William Delbert Gann. Designed for traders who value deep market structure analysis, this indicator leverages the interplay of price and time to identify key support and resistance zones, potential reversal points, and critical price-time synchronization areas. Its unique approach makes it an invaluable instrument for those employing Gann-based methodologies or seeking a systematic way to decode complex market dynamics.
What It Does
The Gann Single Swing indicator is built to pinpoint high-probability zones for price action, such as support and resistance levels, where traders can logically initiate long or short positions. By analyzing a user-defined price swing (a move between two selected points, such as a local high and low), the indicator constructs a geometric framework that reveals hidden patterns in market movements. It identifies:
Support and Resistance Zones: Key price levels where the market is likely to reverse or consolidate.
Temporal Reversal Zones: Specific time periods where price reversals are more probable due to time-price resonance.
Price-Time Synchronization Points: Areas where price and time align to signal potential market turning points.
How It Works
The indicator’s algorithm is grounded in Gann’s geometric principles, focusing on the relationship between price movements and time cycles. Here’s a high-level overview of its process:
Swing Selection: Traders select two key points on the chart (e.g., a local minimum and maximum) to define a price swing.
Channel Construction: The swing is encapsulated within a dynamic channel, forming the foundation of the geometric model.
Gann Fan Application: A Gann Fan is applied to the channel to calculate critical angles, representing the balance between price and time. These angles help identify resonant points that align with the channel’s central axis.
Squared Channel Analysis: The algorithm creates “squared” channels, geometrically derived sub-structures, analyzed for intersections and alignments to project external support and resistance zones beyond the base swing.
Internal Zone Mapping: Within the base swing, a reverse Gann Fan maps internal zones, highlighting areas of price-time convergence that may act as dynamic support or resistance.
Zone Projection: The indicator synthesizes these calculations to plot precise zones of support, resistance, and potential reversals, both spatially (price levels) and temporally (time-based zones).
While the exact mathematical formulations remain proprietary, the indicator relies on time-tested Gann techniques, such as angle-based analysis and cyclical resonance, to deliver actionable insights.
How to Use It
Select the Swing: Identify two significant points on the chart (e.g., a recent high and low) to define the swing. These points serve as the anchor for the indicator’s calculations.
Interpret the Zones: The indicator plots support and resistance zones (both price-based and time-based). Look for price action near these zones to identify potential entry or exit points.
Combine with Other Tools: For best results, use alongside other Gann-based tools (e.g., Gann Squares or Time Cycles) or traditional technical analysis (e.g., trendlines, Fibonacci levels) to confirm signals.
Monitor Temporal Zones: Pay attention to time-based reversal zones, as they may indicate when a price move is likely to occur, enhancing trade timing.
Why It’s Unique
Unlike conventional indicators that rely on moving averages, RSI, or other common metrics, the Gann Single Swing indicator offers a proprietary blend of Gann’s geometric and cyclical principles. Its ability to integrate price and time into a cohesive model sets it apart, providing traders with a deeper understanding of market structure. The indicator does not use public domain code or standard technical indicators, ensuring originality and value for traders seeking advanced tools.
Who It’s For
This indicator is ideal for:
Traders familiar with Gann’s methodologies who want to automate and enhance their geometric analysis.
Advanced traders looking to uncover hidden market patterns through price-time relationships.
Those seeking a robust, non-traditional tool for identifying high-probability trade setups.
The Gann Single Swing indicator is not a black-box forecasting tool but a powerful framework for dissecting market behavior. By combining user-defined inputs with sophisticated geometric calculations, it empowers traders to make informed decisions based on the timeless principles of Gann’s market philosophy.
