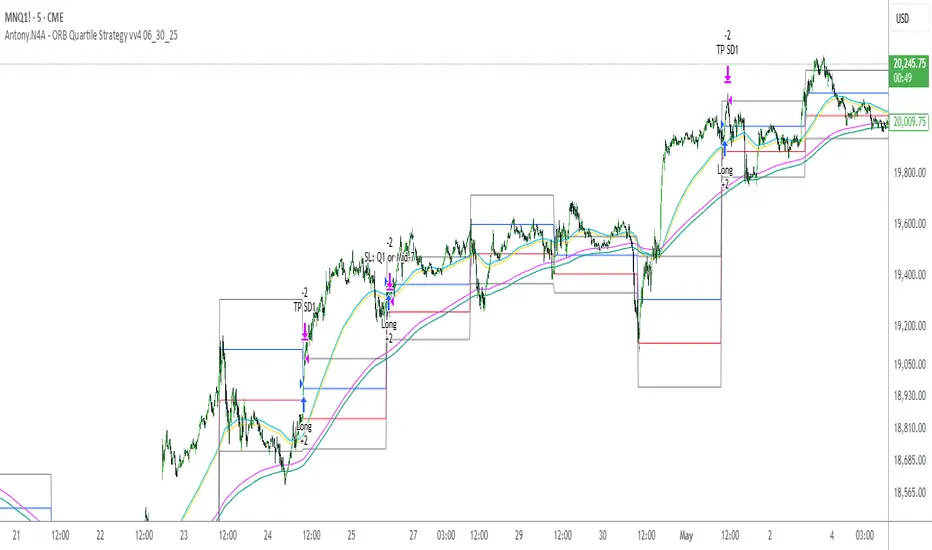
Antony.N4A - ORB Quartile Strategy vv4 06_30_25📌 Antony.N4A - ORB Quartile Strategy vv4
This script implements a fully automated Opening Range Breakout (ORB) trading strategy, engineered for precision execution within predefined market windows. It is compatible with both New York and London sessions, and integrates advanced internal logic including trend validation, breakout confirmation, position scaling, and risk-defined stop/target management.
🧠 Core Logic Overview:
ORB Range Calculation: Based on configurable session time (default: 09:30–09:45 EST)
Entry Window: Trade initiations are permitted only within a defined intraday range
Trend Validation Filters: Proprietary EMA-based mechanisms to confirm directional bias
Contract Sizing Engine: Dynamically adjusts trade size to respect a per-trade risk ceiling
Risk Parameters: Designed to cap maximum loss per trade at approximately $300–400
🎯 Trade Management Rules:
Entry:
Triggered at the close of a 5-minute candle that confirms a directional breakout of the ORB
Stop Loss:
Enforced via structural breakout invalidation levels (Quartile boundaries and mid-range buffer)
Profit Targeting:
- 75% of position is closed at the first standard deviation (SD1) level
- Remaining 25% is trailed to extended targets, with stop-loss adjusted to breakeven post-partial
No pyramiding, re-entries are limited by cooldown logic and session controls
📊 Backtest Performance (Oct 2024 – Apr 2025):
Total Trades: 36
Win Rate: 64%
Worst Losing Streak: 4 consecutive trades
Worst Month: January 2025 (-1.49R)
Net Performance: +21.5R
Strategy tested on NQ futures with NY session breakout configuration
This strategy is intended for disciplined intraday traders seeking a structured, semi-mechanical approach to volatility expansion. It is best used in high-liquidity markets and news-driven sessions.
Trend Analysis
Current Fractal High/Low (Dynamic)
This indicator dynamically tracks the most recent confirmed Fractal High and Fractal Low across any timeframe using custom left/right bar configurations.
🔍 Key Features:
Detects Fractal Highs and Lows based on user-defined pivot settings.
Draws a green line and label ("FH") at the most recent Fractal High.
Draws a red line and label ("FL") at the most recent Fractal Low.
All lines extend from the confirmation bar to the current candle.
Automatically removes old lines and labels for a clean, uncluttered chart.
🛠️ Customizable Inputs:
Left & Right bars for pivot sensitivity
Line width for visibility
📌 Use Cases:
Identifying structure shifts
Recognizing key swing points
Supporting liquidity and breakout strategies
💡 Fractals are confirmed only after the full formation of the pattern (left and right bars). This ensures reliability over reactivity.
This script is designed for intraday to swing traders who want a reliable way to visualize market turning points with minimal noise.

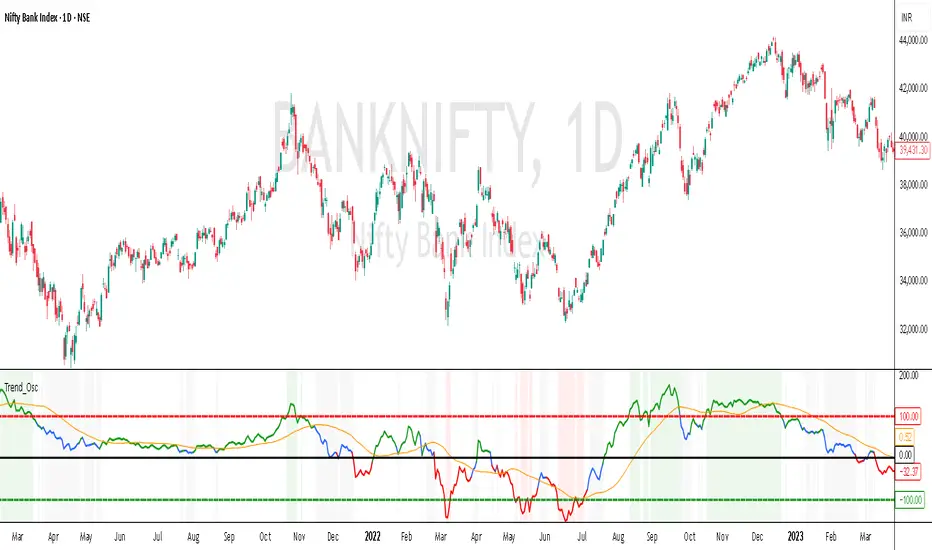
Trend Oscillator# Trend Oscillator: Advanced Technical Analysis Indicator
## Overview
The Trend Oscillator is a sophisticated technical analysis tool designed to identify market trends, momentum shifts, and potential reversal points. Unlike basic oscillators, this indicator combines key analytical approaches to provide a more comprehensive market analysis:
1. **Mean Deviation-Based Oscillator**:(160) At its core, it measures price deviations from moving averages normalized by mean deviation
2. **Fixed Reference Levels**: Clear overbought/oversold thresholds that define extreme market conditions
3. **Trend Filtering**: EMA(36)-based trend direction confirmation to reduce false signals
## Technical Foundation
### Core Calculation Method
The indicator derives its primary oscillator value using a normalized deviation method:
- Calculates a typical price (average of source + high + low)
- Measures the deviation of typical price from its moving average
- Normalizes this deviation by the mean deviation multiplied by a scaling factor (0.015)
This formula effectively creates a momentum oscillator that quantifies how far price has moved from its equilibrium value, relative to typical market volatility.
### Fixed Overbought/Oversold Levels
The Trend Oscillator uses consistent reference levels to identify extreme market conditions:
- Standardized overbought level set at +100
- Standardized oversold level set at -100
- Neutral zone centered around the zero line
These fixed thresholds provide reliable reference points for signal generation and trend strength assessment.
### Trend Filtering Mechanism
The indicator incorporates an EMA-based trend filter that:
- Calculates a directional bias using price position relative to its EMA 36
- Modifies oscillator interpretation based on the prevailing trend
- Helps distinguish between counter-trend corrections and actual reversals
## How to Use the Trend Oscillator
### For Trend Identification
- **Bullish trend**: Oscillator above zero with positive slope
- **Bearish trend**: Oscillator below zero with negative slope
- **Trend strength**: Distance from zero line indicates trend intensity
- **Trend confirmation**: When oscillator and trend filter align
### For Entry Signals
- **Long entry opportunities**:
- Oscillator crossing above the signal line during uptrend
- Oscillator exiting oversold territory with trend filter positive
- Price showing strength while oscillator moves from negative to positive
- **Short entry opportunities**:
- Oscillator crossing below the signal line during downtrend
- Oscillator exiting overbought territory with trend filter negative
- Price showing weakness while oscillator moves from positive to negative
### For Exit Signals
- **Taking profits**: When oscillator approaches extreme levels in your trade direction
- **Stop-loss placement**: When oscillator crosses signal line against your position
- **Trend change warning**: When oscillator crosses zero line against your position
## Customization Options
### General Settings
- **Length**: (160)Controls the calculation period for the oscillator (higher values create smoother, less sensitive readings)
- **Source**: The price data input (close, open, high, low, hl2, hlc3, etc.)
### Signal Line Settings
- **Signal Line**: Optional smoothed version of the oscillator for crossover signals
- **Signal Length**:(36) Determines signal line responsiveness
### Level Settings
- **Overbought/Oversold Levels**: Standard thresholds that define extreme conditions
### Trend Filter Settings
- **Trend Period**: Lookback period for trend direction calculation
- **Trend Source**: Price data used for trend determination
### Visual Settings
- **Show Background Color**: Toggles colored background based on oscillator readings
- **Background Transparency**: Controls the opacity of background coloring
## Trading Strategy Applications
### Trend-Following Approach
1. Enter in the direction of the prevailing trend when:
- Oscillator and trend filter align
- Oscillator crosses signal line in trend direction
- Price pulls back to neutral zone during strong trend
2. Exit when:
- Oscillator crosses signal line against position
- Trend filter changes direction
- Oscillator reaches extreme level in your trade direction
### Counter-Trend Approach
1. Look for reversal opportunities when:
- Oscillator reaches extreme overbought/oversold levels
- Signal line crossover occurs at extreme readings
- Price action confirms potential reversal
2. Exit when:
- Target price levels are reached
- Oscillator returns to neutral zone
- New signals emerge in opposite direction
## Indicator Strengths
- Combines momentum and trend analysis in one comprehensive tool
- Consistent reference levels provide reliable benchmarks
- Reduces false signals through trend filter confirmation
- Visual color-coding provides intuitive market context
## Best Practices
- Effective on all timeframes for trend analysis
- Use in conjunction with support/resistance or price action
- Start with default settings and gradually adjust to your trading style and instrument
- Consider the overall market context when interpreting signals
The Trend Oscillator offers traders a comprehensive technical analysis framework that goes beyond simplistic overbought/oversold readings by incorporating trend context and normalized deviation methodology—providing a nuanced approach to market analysis with clear, consistent reference points.
Precision Trend Shot | JeffreyTimmermansPrecision Trend Shot
The "Precision Trend Shot" Indicator is an advanced technical tool designed to provide a dynamic and adaptive view of market trends. By combining three core components—RSI Oscillator, LSMA ATR, and Adaptable Trend—this indicator delivers precise signals that help traders identify market direction, volatility, and potential trend reversals. The calculated total score, derived from these components, provides a clear, actionable view of market conditions.
Key Features
Multi-Component Analysis: Integrates three key indicators (RSI, LSMA ATR, and Adaptable Trend) for a comprehensive view of market trends.
Dynamic Trend Classification: Categorizes market states as "Bullish" or "Bearish", based on a combined score.
Standard Deviation Bands: Displays standard deviation bands around the score line for enhanced volatility visualization.
Gradient Background Coloring: Visually highlights market phases with gradient colors, aiding quick interpretation.
Customizable Visuals: Offers extensive settings for coloring, background gradients, and signal visibility.
Real-Time Alerts: Generates alerts for significant trend changes or transitions between market states.
Inputs & Settings
RSI Settings:
RSI Source: Default: Close price. Defines the data source for RSI calculation.
RSI Length: Default: 10. Sets the period for calculating RSI.
LSMA ATR Settings:
LSMA Source: Default: Close price. Defines the data source for LSMA calculation.
LSMA Length: Default: 21. Sets the period for calculating the Least Squares Moving Average.
ATR Length: Default: 12. Sets the period for calculating the Average True Range.
Adaptable Trend Settings:
Trend Length: Default: 5. Sets the period for calculating the trend.
Smoothing Length: Default: 5. Controls the smoothing of trend volatility.
Sensitivity: Default: 1.5. Adjusts the sensitivity of trend bands.
Standard Deviation Settings:
Enable Standard Deviation Bands: Default: True. Toggles the display of standard deviation bands.
Standard Deviation Length: Default: 20. Sets the period for standard deviation calculation.
Standard Deviation Multiplier: Default: 2.0. Adjusts the width of the bands.
Smoothing Length: Default: 5. Controls the smoothing of standard deviation bands.
Visual Settings:
Enable Candle Coloring: Default: True. Colors candles based on market state (Bullish or Bearish).
Enable Background Gradient: Default: True. Applies gradient coloring to the background based on trend direction.
Score Line Colors: Customize colors for bullish or bearish score lines.
Calculation Process
RSI Calculation:
Computes the Relative Strength Index (RSI) of the selected source data.
Signals bullish (RSI > 50) or bearish (RSI < 50) conditions.
LSMA ATR Calculation:
Computes LSMA for trend direction and ATR for volatility measurement.
Generates buy and sell signals based on crossover and crossunder of ATR bands.
Adaptable Trend Calculation:
Calculates dynamic trend levels using EMA and standard deviation bands.
Classifies trend states as Bullish or Bearish.
Combined Signal Calculation:
Averages the signals from RSI, LSMA ATR, and Adaptable Trend to generate a total score.
Classifies the market as "Bullish" or "Bearish" based on this score.
Standard Deviation Bands:
Plots standard deviation bands around the combined signal for enhanced volatility analysis.
Gradient Background Coloring:
Colors the chart background based on the identified market state (Bullish or Bearish).
How to Use the Precision Trend Shot Indicator
Identifying Market States:
Bullish Market: Total score > 0, gradient background green.
Bearish Market: Total score < 0, gradient background red.
Confirming Signals:
Use RSI and LSMA ATR signals for early indications.
Use Trend Recon for confirming longer-term trend direction.
Visualizing Volatility:
Standard deviation bands highlight potential reversal zones.
Dynamic Alerts
The Precision Trend Shot Indicator includes a robust alert system for real-time market transitions:
Bullish to Bearish: Market shifts from a bullish to bearish trend.
Bearish to Bullish: Market shifts from a bearish to bullish trend.
Conclusion
The Precision Trend Shot Indicator is an advanced, versatile tool for identifying market trends, visualizing volatility, and generating actionable signals. With customizable settings, dynamic alerts, and clear visual representation, it is an essential addition to any trader’s toolkit.
-Jeffrey

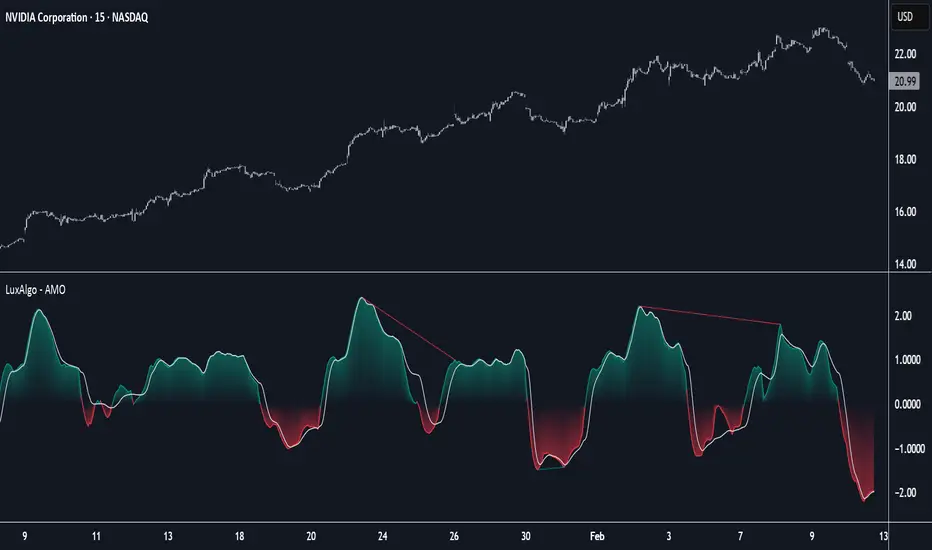
Adaptive Momentum Oscillator [LuxAlgo]The Adaptive Momentum Oscillator tool allows traders to measure the current relative momentum over a given period using the maximum delta in price.
It features a histogram with gradient color, divergences, and an adaptive moving average that allows traders to clearly see the smoothed trend direction.
🔶 USAGE
This unbounded oscillator has positive momentum when values are above 0 and negative momentum when values are below 0. The adaptive moving average is used as a minimum lag smoothing tool over the momentum histogram.
🔹 Signal Line
There are two main uses for the signal line drawn on the chart above.
Momentum crosses above or below the signal line: acceleration in momentum.
Signal line crosses the 0 value: positive or negative momentum.
🔹 Data Length
On the chart above, we can compare different length sizes and how the tool values change, allowing traders to get a shorter or longer-term view of current market strength.
🔹 Smoothing Length
In the previous figure, we can compare how different Smoothing Length values affect the oscillator output.
🔹 Divergences
The divergence detector is disabled by default. Traders can enable it and adjust the divergence length from the settings panel.
As we can see in the chart above, by changing the length of the divergences, traders can fine-tune their detection, a small number will detect smaller divergences, and use a larger number for larger divergences.
🔶 SETTINGS
Data: Select data source, close price by default
Data Length: Select the length for data gathering
Smoothing Length: Select the length for data smoothing
Divergences: Enable/Disable divergences detection and length
Camarilla Pivot Plays█ OVERVIEW
This indicator implements the Camarilla Pivot Points levels and a system for suggesting particular plays. It only calculates and shows the 3rd, 4th, and 6th levels, as these are the only ones used by the system. In total, there are 12 possible plays, grouped into two groups of six. The algorithm constantly evaluates conditions for entering and exiting the plays and indicates them in real time, also triggering user-configurable alerts.
█ CREDITS
The Camarilla pivot plays are defined in a strategy developed by Thor Young, and the whole system is explained in his book "A Complete Day Trading System" . The indicator is published with his permission, and he is a user of it. The book is not necessary in order to understand and use the indicator; this description contains sufficient information to use it effectively.
█ FEATURES
Automatically draws plays, suggesting an entry, stop-loss, and maximum target
User can set alerts on chosen ticker to call these plays, even when not currently viewing them
Highly configurable via many options
Works for US/European stocks and US futures (at least)
Works correctly on both RTH and ETH charts
Automatically switches between RTH and ETH data
Optionally also shows the "other" set of pivots (RTH vs ETH data)
Configurable behaviour in the pre-market, not active in the post-market
Configurable sensitivity of the play detection algorithm
Can also show weekly and monthly Camarilla pivots
Well-documented options tooltips
Sensible defaults which are suitable for immediate use
Well-documented and high-quality open-source code for those who are interested
█ HOW TO USE
The defaults work well; at a minimum, just add the indicator and watch the plays being called. To avoid having to watch securities, by selecting the three dots next to the indicator name, you can set an alert on the indicator and choose to be alerted on play entry or exit events—or both. The following diagram shows several plays activated in the past (with the "Show past plays" option selected).
By default, the indicator draws plays 5 days back; this can be changed up to 20 days. The labels can be shifted left/right using the "label offset" option to avoid overlapping with other labels in this indicator or those of another indicator.
An information box at the top-right of the chart shows:
The data currently in use for the main pivots. This can switch in the pre-market if the H/L range exceeds the previous day's H/L, and if it does, you will see that switch at the time that it happens
Whether the current day's pivots are in a higher or lower range compared to the previous day's. This is based on the RTH close, so large moves in the post-market won't be reflected (there is an advanced option to change this)
The width of the value relationship in the current day compared to the previous day
The currently active play. If multiple plays are active in parallel, only the last activated one is shown
The resistance pivots are all drawn in the same colour (red by default), as are the support pivots (green by default). You can change the resistance and support colours, but it is not possible to have different colours for different levels of the same kind. Plays will always use the correct colour, drawing over the pivots. For example, R4 is red by default, but if a play treats R4 as a support, then the play will draw a green line (by default) over the red R4 line, thereby hiding it while the play is active.
There are a few advanced parameters; leave these as default unless you really know what they do. Please note the script is complicated—it does a lot. You might need to wait a few seconds while it (re)calculates on new tickers or when changing options. Give it time when first loading or changing options!
█ CONCEPTS
The indicator is focused around daily Camarilla pivots and implements 12 possible plays: 6 when in a higher range, 6 when in a lower range. The plays are labelled by two letters—the first indicates the range, the second indicates the play—as shown in this diagram:
The pivots can be calculated using only RTH (Regular Trading Hours) data, or ETH (Extended Trading Hours) data, which includes the pre-market and post-market. The indicator implements logic to automatically choose the correct data, based on the rules defined by the strategy. This is user-overridable. With the default options, ETH will be used when the H/L range in the previous day's post-market or current day's pre-market exceeds that of the previous day's regular market. In auto mode, the chosen pivots are considered the main pivots for that day and are the ones used for play evaluation. The "other" pivots can also be shown—"other" here meaning using ETH data when the main pivots use RTH data, and vice versa.
When displaying plays in the pre-market, since the RTH open is not yet known (and that value is needed to evaluate play pre-conditions), the pre-market open is used as a proxy for the RTH open. After the regular market opens, the correct RTH open is used to evaluate play conditions.
█ NOTE FOR FUTURES
Futures always use full ETH data in auto mode. Users may, however, wish to use the option "Always use RTH close," which uses the 3 p.m. Central Time (CME/Chicago) as a basis for the close in the pivot calculations (instead of the 4 p.m. actual close).
Futures don't officially have a pre-market or post-market like equities. Let's take ES on CME as an example (CME is in Chicago, so all times are Central Time, i.e., 1 hour behind Eastern Time). It trades from 17:00 Sunday to 16:00 Friday, with a daily pause between 16:00 and 17:00. However, most of the trading activity is done between 08:30 and 15:00 (Central), which you can tell from the volume spikes at those times, and this coincides with NYSE/NASDAQ regular hours (09:30–16:00 Eastern). So we define a pseudo-pre-market from 17:00 the previous day to 08:30 on the current day, then a pseudo-regular market from 08:30 to 15:00, then a pseudo-post-market from 15:00 to 16:00.
The indicator then works exactly the same as with equities—all the options behave the same, just with different session times defined for the pre-, regular, and post-market, with "RTH" meaning just the regular market and "ETH" meaning all three. The only difference from equities is that the auto calculation mode always uses ETH instead of switching based on ETH range compared to RTH range. This is so users who just leave all the defaults are not confused by auto-switching of the calculation mode; normally you'll want the pivots based on all the (ETH) data. However, both "Force RTH" and "Use RTH close with ETH data" work the same as with equities—so if, in the calculations, you really want to only use RTH data, or use all ETH H/L data but use the RTH close (at 15:00), you can.
█ LIMITATIONS
The pivots are very close to those shown in DAS Trader Pro. They are not to-the-cent exact, but within a few cents. The reasons are:
TradingView uses real-time data from CBOE One, so doesn't have access to full exchange data (unless you pay for it in TradingView), and
the close/high/low are taken from the intraday timeframe you are currently viewing, not daily data—which are very close, but often not exactly the same. For example, the high on the daily timeframe may differ slightly from the daily high you'll see on an intraday timeframe.
I have occasionally seen larger than a few cents differences in the pivots between these and DAS Trader Pro—this is always due to differences in data, for example a big spike in the data in TradingView but not in DAS Trader Pro, or vice versa. The more traded the stock is, the less the difference tends to be. Highly traded stocks are usually within a few cents. Less traded stocks may be more (for example, 30¢ difference in R4 is the highest I've seen). If it bothers you, official NYSE/NASDAQ data in TradingView is quite inexpensive (but even that doesn't make the 8am candle identical).
The 6th Camarilla level does not have a standard definition and may not match the level shown on other platforms. It does match the definition used by DAS Trader Pro.
The indicator is an intraday indicator (despite also being able to show weekly and monthly pivots on an intraday chart). It deactivates on a daily timeframe and higher. It is untested on sub-minute timeframes; you may encounter runtime errors on these due to various historical data referencing issues. Also, the play detection algorithm would likely be unpredictable on sub-minute timeframes. Therefore, sub-minute timeframes are formally unsupported.
The indicator was developed and tested for US/European stocks and US futures. It may or may not work as intended for stocks and futures in different locations. It does not work for other security types (e.g., crypto), where I have no evidence that the strategy has any relevance.

Trading Sessions
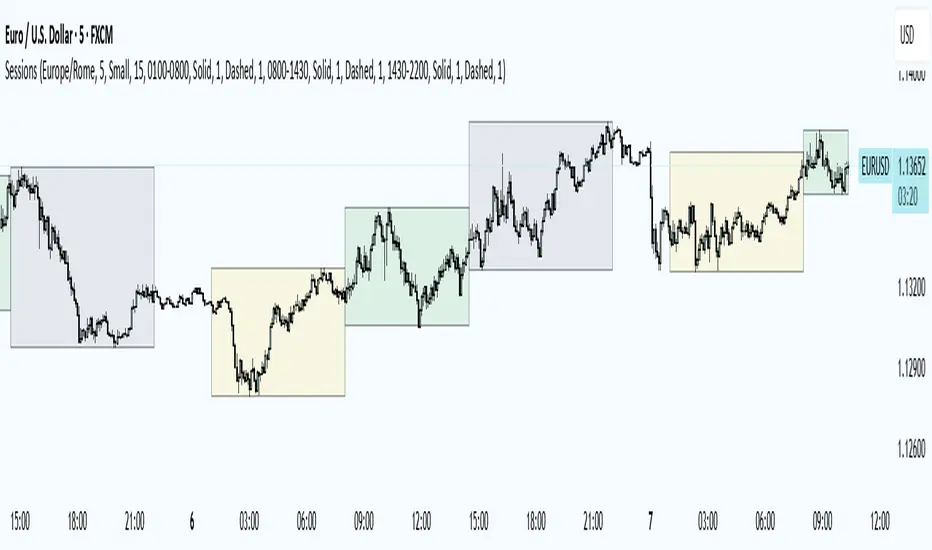
Trading Sessions
Highlights the Asia, London, and New York trading sessions with dynamic High-Low boxes.
General
Timezone : select your reference zone (e.g. Exchange, UTC, Europe/Rome, America/New_York).
Extend Session High/Low : extend the High/Low lines to the last candle.
Extend Lines (bars) : number of bars to extend lines beyond the last candle (0–100, default 15).
Show High/Low Labels : display labels for the High/Low levels.
Show Mitigated Levels : also show mitigated (broken) levels.
Show Only Recent Levels : filter levels from the last N days.
Number of Recent Days : sets how many days are considered “recent” (1–30).
Show Debug Info : enable a panel with current time, session status, and active filters.
Sessions
Asia , London , New York : enable or disable each session.
Session Time : set the start/end times with the time picker.
Box Color : choose a semi-transparent highlight color for each session.
Line Style & Width : customize style (Solid, Dotted, Dashed) and width of current and past High/Low lines.
Text Size : select the label text size (Tiny, Small, Normal, Large).
Show Only Recent Levels – filters High/Low lines to show only those from the last Number of Recent Days .
Number of Recent Days – sets how many days are considered “recent” for the filter.
Show Mitigated Levels – enables display of broken levels; otherwise only active levels remain visible.
Show High/Low Labels – toggles text labels at the ends of lines on or off.
Show Debug Info – displays a floating panel showing:
Current time in the selected timezone
On/Off status of Asia, London, NY sessions
Active filters (recent days, mitigated levels)
Line style settings for each session
Key Benefits
Visualize session-specific volatility and potential breakouts.
No historical limit: scroll back through any past sessions.
Filter and extend High/Low levels for precise price context.
Fully customize to fit any chart layout.
Ideal For
Intraday traders who need clear session boundaries and price level context.
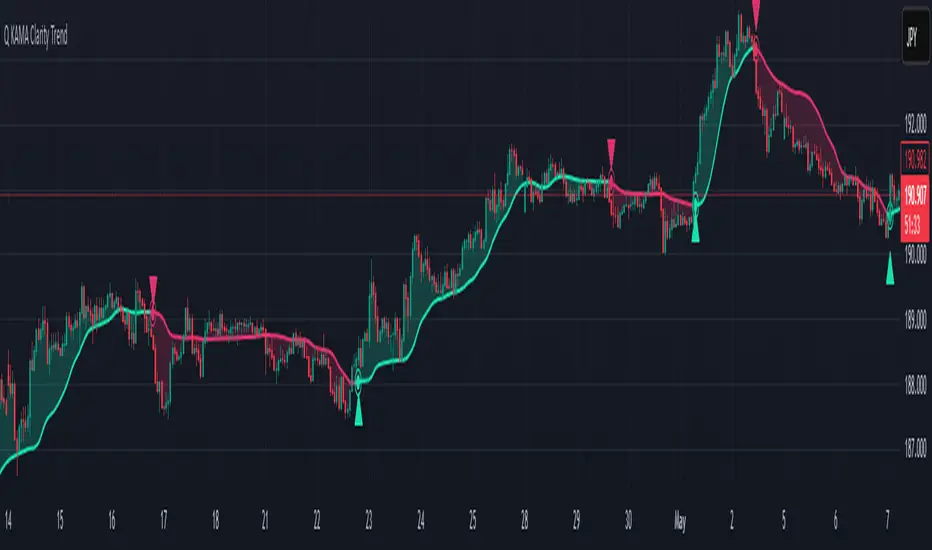
Q KAMA Clarity Trend Q KAMA Clarity Trend
A minimalistic yet versatile trend-following tool that combines **Kaufman’s Adaptive Moving Average (KAMA) with Gaussian smoothing and ATR-based breakout logic. Built for traders who value clarity, responsiveness, and visual simplicity.
🔧 Core Features
1. Adaptive KAMA Trend Line
• Dynamically adjusts to market volatility using Kaufman’s KAMA.
• Gaussian filter pre-smooths price to reduce noise before calculating KAMA.
2. Dual Trend Logic (toggle)
• Default: Trend shifts on price breakouts above/below KAMA ± ATR channel.
• Alternative: Faster signals based on price crossing KAMA directly.
3. Visual Feedback
• Auto-colored KAMA line based on trend direction (up/down/neutral).
• Arrows on trend reversals (up = green, down = red).
• Optional shadow fill below line for regime clarity.
• Optional dot marker ("⦿") on the KAMA line to show trend shifts.
4. Alerts
• Real-time alerts when a new uptrend or downtrend begins.
• Compatible with manual or automated strategies.
⚙️ Configurable Inputs
• Source: Price input (default: close)
• KAMA Length: Adjusts sensitivity (longer = smoother)
• ATR Length & Multiplier: Defines channel width for breakout detection
• Gaussian Filter (Length & Sigma): Controls smoothing strength
• Trend Logic Mode: ATR channel breakout vs. price-KAMA cross
• Style: Custom colors, background fill, marker visibility
📈 How to Use
• Follow trend arrows for directional confirmation
• Use ATR breakout mode for cleaner, filtered signals
• Switch to price-KAMA crossover mode for earlier entries
• Works well with structure, momentum, and volume confirmation
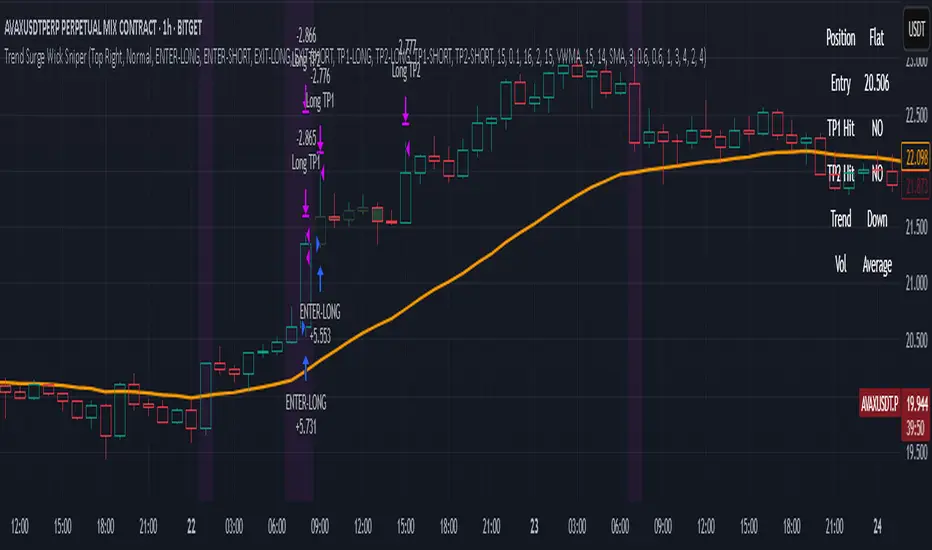
Trend Surge Wick SniperTrend Surge Wick Sniper | Non-Repainting Trend + Momentum Strategy with TP1/TP2 & Dashboard
Trend Surge Wick Sniper is a complete crypto trading strategy designed for high-precision entries, smart exits, and non-repainting execution. It combines trend slope, wick rejection, volume confirmation, and CCI momentum filters into a seamless system that works in real-time conditions — whether you're manual trading or sending alerts to multi-exchange bots.
🧩 System Architecture Overview
This is not just a mashup of indicators — each layer is tightly integrated to filter for confirmed, high-quality setups. Here’s a detailed breakdown:
📈 Trend Logic
1. McGinley Dynamic Baseline
A responsive moving average that adapts to market speed better than EMA or SMA.
Smooths price while staying close to real action, making it ideal for basing alignment or trend context.
2. Gradient Slope Filter (ATR-normalized)
Calculates the difference between current and past McGinley values, divided by ATR for normalization.
If the slope exceeds a configurable threshold, it confirms an active uptrend or downtrend.
Optional loosened sensitivity allows for more frequent but still valid trades.
🚀 Momentum Timing
3. Smoothed CCI (ZLEMA / Hull / VWMA options)
Traditional CCI is enhanced with smoothing for stability.
Signals trades only when momentum is strong and accelerating.
Optional settings let users tune how responsive or smooth they want the CCI behavior to be.
🔒 Entry Filtering & Rejection Logic
4. Wick Trap Detection
Prevents entry during manipulated candles (e.g. stop hunts, wick traps).
Measures wick-to-body ratio against a minimum body size normalized by ATR.
Only trades when the candle shows a clean body and no manipulation.
5. Price Action Filters (Optional)
Long trades require price to break above previous high (or skip this with a toggle).
Short trades require price to break below previous low (or skip this with a toggle).
Ensures you're trading only when price structure confirms the breakout.
6. McGinley Alignment (Optional)
Price must be on the correct side of the McGinley line (above for longs, below for shorts).
Ensures that trades align with baseline trend, preventing early or fading entries.
📊 Volume Logic
7. Volume Spike Detection
Confirms that a real move is underway by requiring volume to exceed a moving average by a user-defined multiplier.
Uses SMA / EMA / VWMA for customizable behavior.
Optional relative volume mode compares volume against typical volume at that same time of day.
8. Volume Trend Filter
Compares fast vs. slow EMA of the volume spike ratio.
Ensures volume is not just spiking, but also increasing overall.
Prevents trades during volume exhaustion or fading participation.
9. Volume Strength Label
Classifies each bar’s volume as: Low, Average, High, or Very High
Shown in the dashboard for context before entries.
🎯 Entry Conditions
An entry occurs when all of the following align:
✅ Trend confirmed via gradient slope
✅ Momentum confirmed via smoothed CCI
✅ No wick trap pattern
✅ Price structure & McGinley alignment (if toggled on)
✅ Volume confirms participation
✅ 1-bar cooldown since last exit
💰 TP1 & TP2 Exit System
TP1 = 50% of position closed using a limit order at a % profit (e.g., 2%)
TP2 = remaining 50% closed at a second profit level (e.g., 4%)
These are set as limit orders at the time of entry and work even on backtest.
Alerts are sent separately for TP1 and TP2 to allow bot handling of staggered exits.
🧠 Trade Logic Controls
✅ process_orders_on_close=true ensures non-repainting behavior
✅ 1-bar cooldown after any exit prevents same-bar reversals
✅ Built-in canEnter condition ensures trades are separated and clean
✅ Alerts use customizable strings for entry/exit/TP1/TP2 — ready for webhook automation
📊 Real-Time On-Chart Dashboard
Toggleable, movable dashboard shows live trading stats:
🔵 Current Position: Long / Short / Flat
🎯 Entry Price
✅ TP1 / TP2 Hit Status
📈 Trend Direction: Up / Down / Flat
🔊 Volume Strength: Low / Average / High / Very High
🎛 Size and corner are adjustable via input settings
⚠️ Designed For:
1H / 4H Crypto Trading
Manual Traders & Webhook-Connected Bots
Scalability across volatile market conditions
Full TradingView backtest compatibility (no repainting / no fake signals)
📌 Notes
You can switch CCI smoothing type, volume MA type, and other filters via the settings panel.
Default TP1/TP2 levels are set to 2% and 4%, but fully customizable.
🛡 Disclaimer
This script is for educational purposes only and not financial advice. Use with backtesting and risk management before live deployment.
Multi-VWAP System🚀 Multi-VWAP System — Anchored VWAP & Deviation Bands
Overview
The Multi-VWAP System provides traders with a professional-grade approach to anchored VWAP analysis. Inspired by Brian Shannon's pioneering work on Anchored VWAP, this indicator automatically calculates and plots:
Current Session VWAP
Previous Session VWAP (also known as "2-Day VWAP")
High-of-Day (HOD) Anchored VWAP
Each VWAP can also display optional Standard Deviation Bands to highlight statistically significant deviations from the volume-weighted average price.
🔍 Why Anchored VWAP Matters
Volume Weighted Average Price (VWAP) is among the most critical institutional indicators, as it represents the average price paid for a stock adjusted by trading volume. This makes VWAP crucial for identifying fair value and significant areas of institutional activity.
Institutions utilize VWAP extensively to guide their execution algorithms. For instance, if price dips below a 2-day anchored VWAP (anchored to the previous session's open), many institutions interpret this as a discounted entry, potentially triggering large-scale buy programs. Conversely, sustained movement above VWAP signals strong buying pressure and bullish sentiment.
📌 Why Multiple Anchors?
Traders commonly anchor VWAPs at critical reference points:
Current Session VWAP:
Essential for day traders as a reference for intraday sentiment. Price action above this line generally indicates bullish sentiment, while price below signals bearish sentiment.
Previous Session (2-Day) VWAP:
Heavily used by institutions and swing traders, it provides insight into multi-session sentiment. Institutions commonly activate buy or sell programs based on whether price is trading at a premium or discount relative to this VWAP.
High-of-Day (HOD) VWAP:
Frequently used by momentum traders, this anchor captures sentiment after the most recent intraday high. Price above the HOD VWAP suggests sustained bullish momentum, while price below might signal weakening momentum.
🌟 Standard Deviation Bands
Each anchored VWAP in this indicator includes optional Standard Deviation Bands, highlighting statistical extremes. Traders use these bands to:
Identify potentially overextended moves (beyond +2σ or +3σ).
Gauge momentum strength (holding above +1σ).
Spot mean-reversion setups when price returns to VWAP after extreme moves.
🎨 Dynamic Background and Momentum Colorization
To visually highlight strength or weakness in price action relative to VWAP:
Dynamic Background Fill between Current and Previous VWAPs:
Green background appears when the Current VWAP is above the Previous VWAP and the linear regression slope (adjustable length) is positive, indicating bullish sentiment.
Red background appears when the Current VWAP is below the Previous VWAP and the slope is negative, indicating bearish sentiment.
No fill when conditions are mixed or momentum is uncertain.
Gold Fill above HOD VWAP:
When price action is above the High-of-Day VWAP and momentum (linear regression slope) is positive, a subtle gold shading appears, quickly highlighting bullish momentum.
⚙ Fully Customizable Settings
Session Times: Adjust session start and end times to match your specific market hours.
Standard Deviation Bands: Enable or disable each VWAP’s deviation bands individually and select how many bands (1σ, 2σ, or 3σ) you'd like to display.
Momentum Slope Length: Adjustable lookback for linear regression slope calculation—giving you full control of trend sensitivity.
🎯 Who Should Use This Indicator?
This indicator is perfect for:
Day Traders who want quick insights into intraday sentiment shifts.
Swing Traders tracking institutional footprints and seeking optimal entry/exit points.
Momentum Traders who rely on clearly visible momentum signals from HOD anchored VWAPs.
Institutional Traders and Professionals seeking sophisticated, institutionally-inspired VWAP analysis without manual anchoring.
📈 Summary of Features
✅ Automatic VWAP Anchors (Current Session, Previous Session, High-of-Day)
✅ Optional Standard Deviation Bands for each VWAP anchor
✅ Dynamic Background Coloring based on price action and momentum conditions
✅ Gold Momentum Highlight for quick bullish momentum identification above HOD VWAP
✅ Fully Customizable Inputs for precise personalization and flexibility
📢 Conclusion
The Multi-VWAP System isn't just another VWAP indicator. It's an institutional-level, dynamic, multi-dimensional analysis tool inspired by the work of Brian Shannon and leading institutional traders. It takes the guesswork out of anchoring and analysis, leaving you free to focus on identifying and executing high-probability trade setups.
Enjoy trading smarter—not harder. Happy Trading! 🚀📊

Key Recent Highs and LowsKey Recent Highs & Lows — Session‐Aware Market Structure
TL;DR
This tool plots the most important intraday price extremes for every U.S.‑equity trading segment—Early Premarket • Western Premarket • Regular Hours • Post‑Market Hours • Yesterday’s Range—and labels them so you can trade break‑outs, retests and mean‑reversion with instant context.
📐 Theory & Why These Levels Matter
Liquidity Pools
Visible session extremes attract resting orders (stop‑losses, take‑profits, opening prints). Price often accelerates into them and reacts at them.
Market Memory
The previous day’s high/low is a widely‑watched pivot for gap fills, overnight inventory corrections and multi‑day breakouts.
Mean‑Reversion Windows
Statistically, pre‑ and post‑market ranges are thin; an aggressive spike outside those bands often retraces when full liquidity returns.
Break‑Out Confirmation
A true breakout isn’t just a tick above RTH‑high—it usually closes or at least consolidates above the prior extreme. Seeing all bands lets you gauge whether a push is “real” or just probing thinner sessions.
Put simply, these levels help you decide:
Break‑out ➜ trade in the direction of expansion past a session extreme with follow‑through.
Fade/Mean‑Revert ➜ fade a spike that tags an extreme without commitment (e.g., hits Western‑Premkt‑High then stalls before RTH).
🔍 What the Script Draws
Session (UTC‑4 EST) Default Color / Style Typical Use‑Case
Early Premarket 4 – 7 AM Thick semi‑transparent orange line detect overnight retail spikes / fade plays
Western Premarket 7 – 9 : 30 AM Dashed orange‑red breakout watch as U.S. brokers open
Regular Session (RTH) 9 : 30 – 16 : 00 Bold teal dotted line core intraday structure; classic highs/lows
Post‑Market 16 – 23 : 59 Soft indigo band after‑hours news moves, earnings fades
Previous‑Day RTH Solid teal gap‑fill targets, trend continuation filters
(All colors, thicknesses and transparencies are editable in the settings.)
✨ Features
Real‑Time Updates
Levels refresh tick‑by‑tick inside their own session—no repainting later.
One‑Click Visibility Toggles
Show or hide any session extreme independently.
Clean Auto‑Labels
Optional right‑edge tags (“RTH High”, “Premkt Low”, etc.) keep your chart readable even when lines overlap.
Automatic Daily Reset
At midnight Eastern, buffers clear and yesterday’s extremes roll into the “Prev‑Day” pair.
Zero‑Noise Design
Transparencies and line styles are tuned so you can overlay on any symbol / timeframe without drowning candles.
📈 How to Trade with It
Intraday Breakout Strategy
Mark confluence (e.g., price pushes through Western Premkt High and Yesterday’s High).
Wait for a pullback that holds above the reclaimed band.
Enter with stop under that session line; target next band or measured‑move.
Fade / Mean‑Reversion
Pre‑market headline sends price 5 % above Early Premkt High.
Volume dries up before RTH open.
Short into exhaustion; cover near Western Premkt High or VWAP.
Gap‑Fill & Trend Days
Cash open gaps above Prev‑Day High.
If first 15‑min candle closes back inside yesterday’s range, bias shifts to downside fade.
If it holds above, treat gap as breakout and track RTH High extensions.
Pair it with volume‑profile, VWAP, or momentum oscillators for even higher‑confidence setups.
⚙️ Settings Cheat‑Sheet
Setting Effect
Show Regular / Premarket / Post‑market High/Low Master visibility per session
Show Previous Day High/Low Toggle yesterday’s anchor range
Show Session Labels Turn the right‑edge tags on/off
Style Panel Change each line’s color, width, transparency, dash/dot
🛠️ Best Practices
Works on any intraday timeframe (1‑min to 1‑hour).
Crypto or 24 h markets: adjust session times to match your exchange.
Combine with alerts (e.g., “price crossing RTH High”) for hands‑free monitoring.
Put KRHL on your chart and you’ll never wonder which high matters most again—because they’re all right there, clearly labeled and color‑coded. Trade breakouts or fades with confidence, armed with the exact market structure everyone else is watching.

Intraday Pivot Highs & Lows (Asia London NY)Intraday Pivot Highs & Lows (Asia London NY)
Script Description
This TradingView indicator is optimized for Forex, scalping, intraday, and day trading strategies. It accurately plots Pivot Points and levels, high/low, support and resistance levels. These are clearly identified to aid the trader during killzone sessions and session opens. Ideal for scalp trading, intraday sessions, and leveraging SMT (Smart Money Techniques). Utilize these Price Levels effectively during London Open, NY Open, and the Asia Session, utilizing Market Structure to pinpoint key levels and reversal zones for successful trading. Improve your Trade Setups, recognize reliable Chart Patterns, identify critical Price Pivots, and trade confidently off Institutional Levels.
This script marks the intraday pivot highs, lows and midpoints retracement levels for
Asia
London
New York
It also plots the previous day's high, low, midpoint, and 0.618 Fibonacci retracement levels, providing traders with critical price reference points for making intraday trading decisions.
Originality & Usefulness
This indicator uniquely integrates pivot calculations across three major Forex sessions (Asia, London, NY), clearly delineating session boundaries.
It enhances visibility by using distinct styling
solid for New York
dashed for London
dotted lines for Asia
And colour co-ordinated labeling, improving traders' ability to identify important intraday price action zones efficiently. Unlike standard pivot indicators, this script emphasizes session-specific trading dynamics.
### Key Features ###
Session-Based Levels: Automatically plots high, low, midpoint, and Fibonacci (.618) levels for each major session (Asia, London, NY).
Distinct Visual Cues: Lines and labels use session-specific styles and colors to easily differentiate between sessions.
Previous Day Reference: Clearly plots and labels yesterday's high, low, midpoint, and Fibonacci levels.
Flexible Visibility: Traders can set timeframe visibility to maintain clean charts on higher timeframes.
### How It Works
At the start of next day's session, previous session lines are cleared, ensuring the chart remains uncluttered.
High, low, midpoint, and Fibonacci retracement levels (.618) are dynamically calculated and displayed at the close of each session.
All session levels remain visible until the start of the next respective session, providing continuous actionable insights.
Trading Application:
Session highs and lows act as strong intraday support and resistance zones.
Midpoints and Fibonacci levels are effective for identifying potential reversal zones and retracements.
Daily levels provide a broader context, useful for gauging intraday volatility and range.
### Limitations and Considerations ##
Best used on liquid assets with clear session-based price action, such as Forex major pairs, if used on indexes make sure they contain 24 hour price action not just New York session.
This indicator is designed to streamline intraday trading by clearly marking essential pivot points and session-based levels, significantly improving traders' market context and decision-making accuracy. Can be used to enhance SMT decision making when scalping killzones.

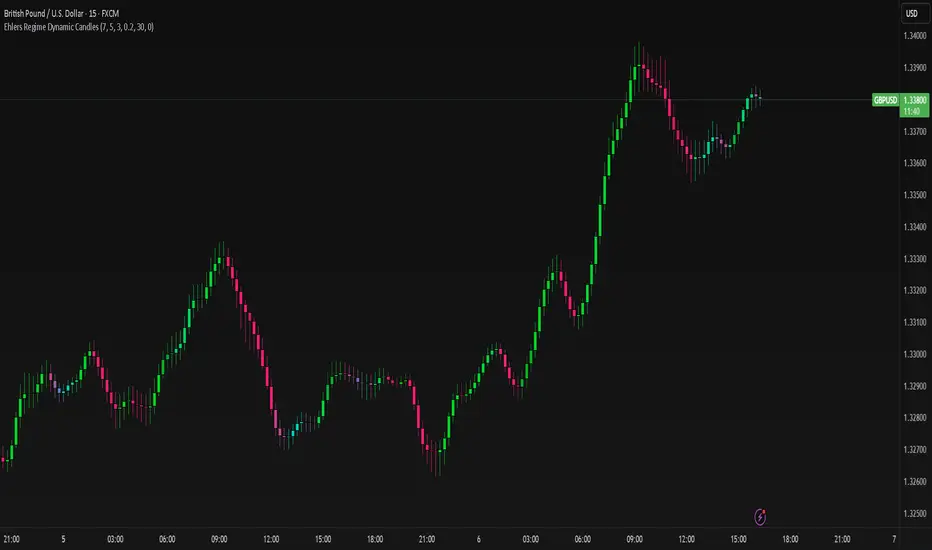
Ehlers Regime Dynamic CandlesCore Calculation Mechanism
The indicator uses advanced Ehlers signal processing techniques to identify market regimes and create dynamically colored candles that reflect market conditions.
Super Smoother Filter: Price data (open, high, low, close) is processed through an Ehlers Super Smoother Filter to reduce market noise while preserving important price movements. This creates a clearer signal for regime detection.
Autocorrelation Analysis: The core of regime detection uses autocorrelation functions at different lag periods:
Primary autocorrelation measures correlation between the current price and its previous value
Trending autocorrelation measures longer-term persistence in the data series
These values combined determine if the market is in a trending or choppy regime
(Image showing Ehlers custom candles vs default candlesticks)
Regime Strength Calculation:
-Raw signal from autocorrelation with user-defined threshold adjustment
-Adaptive scaling based on sensitivity parameter
-Optional volume validation that confirms signal strength using volume data
-Normalization to 0-1 range and smoothing for visual consistency
-Percentile ranking to provide contextually meaningful strength values
Fisher Transform: Applied to the smoothed price to identify statistical extremes, which helps adjust transparency levels during significant price movements.
Key Features & Components
Regime Detection: Identifies trending vs. choppy market conditions using Ehlers' autocorrelation techniques.
Dynamic Candle Coloring: Candles transition smoothly between three color states:
Bullish trending (typically green/teal)
Bearish trending (typically red/purple)
Choppy/neutral (typically blue/silver)
Volume Validation: Optional incorporation of volume data to confirm trend strength (stronger volume during trending periods increases confidence).
Adaptive Transparency: Candles become more opaque during statistically significant price movements based on Fisher Transform values.
Gradient Smoothing: Controls the visual transition between regime states for a more aesthetically pleasing appearance.
Customizable Colors and Style: Full control over all visual aspects including candle body/wick colors and transparency.
Configuration Options
Users can adjust the following parameters in the indicator settings:
Main Settings:
Cycle Length: Controls the lookback period for cycle detection. Lower values increase responsiveness but may introduce noise.
Gradient Smoothness: Determines how quickly colors transition when regime changes.
Trend Detection Threshold: Sets the autocorrelation strength required to classify a trend.
Trend Sensitivity: Scales regime strength calculation to produce a better distribution of values.
Use Volume: Toggles whether volume data is used to validate trend strength.
Color Settings:
Trending Regime Colors: Separate color options for bullish and bearish candle bodies and wicks.
Choppy Regime Colors: Color options for candle bodies and wicks during sideways/neutral markets.
Style Settings:
Candle Border Options: Toggle borders and adjust their color and transparency.
Adaptive Transparency: Enable/disable dynamic transparency based on statistical significance.
Base Transparency: Set the baseline transparency level for all candles.
Interpretation Notes
Color Transitions: As the market shifts between regimes, candle colors gradually transition, providing visual cues about market structure changes.
Regime Strength: The intensity of colors indicates the strength of the detected regime:
Strong trending regimes show vibrant trending colors
Weak or mixed regimes display colors closer to the choppy/neutral color
Transitions between regimes show gradient colors
Transparency Changes: More opaque candles indicate statistically significant price movements, while more transparent candles suggest routine or less significant price action.
Volume Interaction: When volume validation is enabled, trending colors become more pronounced during high volume trends and subdued during low volume periods.
Disclaimer: These are custom candles that are significantly different from normal candlesticks.
Unlike traditional candlesticks that display raw price data, these candles:
• Use Ehlers signal processing to filter and smooth price data
• Dynamically change color based on detected market regimes
• Show statistical significance through transparency
• May appear delayed compared to standard candles due to the filtering process
Traditional trading strategies dependent on candlestick patterns will not work with these.
Risk Disclaimer
Trading involves significant risk. This indicator is provided for analytical purposes only and does not constitute financial advice. Past performance is not indicative of future results. Use sound risk management practices and never trade with capital you cannot afford to lose. The Ehlers Regime Dynamic Candles indicator should be used as part of a comprehensive trading approach, not as a standalone trading system.
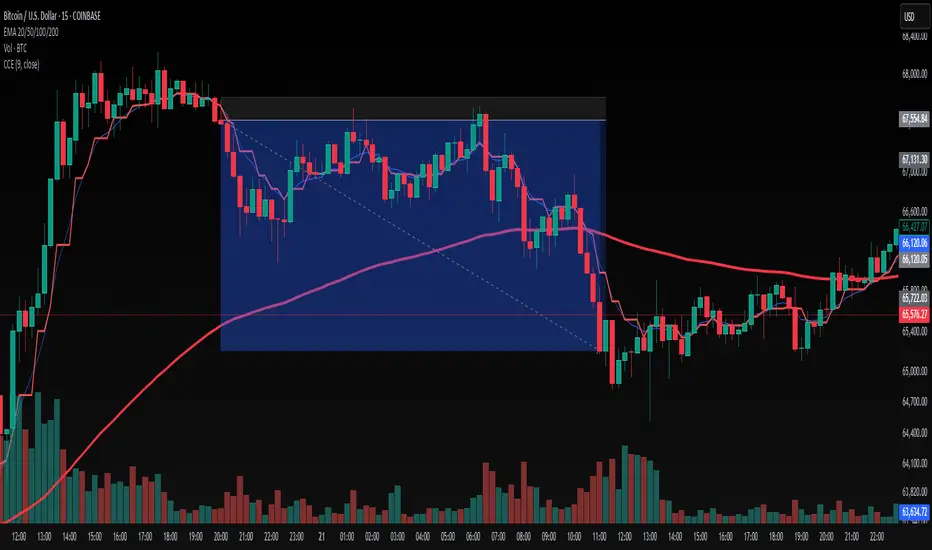
Closest Candle to EMA (CCE)🔍 Closest Candle to EMA (CCE)
The Closest Candle to EMA (CCE) indicator is a visual analytical tool designed to identify the historical price (candle close) that is closest to the current Exponential Moving Average (EMA) over a user-defined period. This allows traders to easily detect how price has interacted with the trend line recently, providing insights into potential mean reversion, support/resistance, and price convergence behavior.
📌 Key Features
✅ Highlights the candle with a closing price closest to the current EMA
✅ Customizable EMA length for various trading styles and timeframes
✅ Helps detect potential zones of trend interaction
✅ Supports analysis of price behavior near dynamic support/resistance
✅ Lightweight and non-intrusive visual overlay (red = closest price, blue = EMA)
🧠 How It Works
The script calculates the EMA using the user-defined length (default: 20).
It then scans the last N candles (equal to the EMA length) and finds the one whose closing price is closest to the current EMA value.
That close is highlighted in red, while the EMA is shown in blue.
This comparison helps traders understand the proximity of past price action to the current trend level.
💡 Use Cases
Mean Reversion Strategies – Spot when price historically reverts to the trend
Dynamic Support/Resistance Identification – Find levels where price respected or returned to the EMA
Consolidation Zone Analysis – Identify areas where price hovered around trend lines
Backtesting Trend Sensitivity – See how price reacted to EMA over time
⚙️ Settings
EMA Length – Set the number of periods used for EMA and comparison window (default: 20)
📊 Example Strategy Setup – EMA Touch with Reversal Candle
This indicator can be incorporated into a price-action strategy that combines candlestick patterns, EMA proximity, and volume confirmation. Here's a practical use case:
🔧 Note: This setup is designed specifically with the EMA length set to 9.
🔁 Bullish Setup – Hammer + EMA (in uptrend)
The market is in an uptrend, confirmed by EMA(9) sloping upward
A Hammer candlestick forms
The EMA (blue) must touch the lower shadow (wick) of the Hammer
It must not touch the candle body
Candle volume is above average
→ ✅ This may signal a bullish continuation opportunity
🔁 Bearish Setup – Shooting Star + EMA (in downtrend)
The market is in a downtrend, confirmed by EMA(9) sloping downward
A Shooting Star candlestick forms
The EMA (blue) must touch the upper shadow (wick) of the candle
It must not touch the candle body
Candle volume is above average
Market Volatility and Price Momentum @MaxMaserati 2.0# Market Volatility and Price Momentum MaxMaserati 2.0 (MVPM 2.0)
## Overview
MVPM 2.0 is a premium multi-factor technical analysis system that combines momentum evaluation, volatility band analysis, trend filtering, and price action to identify high-probability trading opportunities. This advanced indicator uses a proprietary algorithm to measure market sentiment through four distinct technical components, providing clear visual signals through gradient bar coloring and special equilibrium markers.
## Key Features
### Multi-Factor Analysis System
The indicator evaluates four critical market components:
- **Momentum (M)**: Analyzes the relationship between momentum lines to detect directional bias
- **Volatility (V)**: Measures price position relative to adaptive volatility bands
- **Trend (T)**: Uses a sophisticated two-pole filter to determine trend direction
- **Price Action (P)**: Tracks price movement relative to momentum lines
### Innovative Tick-Based Calculation
- **Mathematical Precision**: Uses market-relevant tick size (0.25) as the foundational unit for indicator calculations
- **Configurable Tick Separation**: Adjust the number of ticks between momentum and signal lines (0.1-10.0) to fine-tune sensitivity
- **Adaptive Calibration**: Lower tick values create earlier, more sensitive signals; higher values provide stronger confirmation
- **Market-Specific Optimization**: Perfect for customizing across different instruments, timeframes, and volatility conditions
- **Technical Edge**: The tick-based approach ensures mathematically precise signals that respect each market's natural price structure
### Dual Volatility Band Modes
- **Long Term Trend Mode**: Volatility bands calculated independently from momentum lines, providing broader market context
- **Short Term Trend Mode**: Volatility bands anchored to momentum signal line, offering more precise trading ranges
### Visual Signals
- **Color-Gradient Bars**: Displays signal strength (1-4) through color intensity
- Deeper green/lime: Strong bullish conviction (more factors aligned)
- Deeper red: Strong bearish conviction (more factors aligned)
- Yellow: Market equilibrium (equal bullish and bearish factors)
- Black Circle Markers**: Special signals that appear at equilibrium of price which means ranging/consolidation/pause points
### Customizable Information Table
- **Fully Configurable Display**: Toggle individual rows on/off
- **Positioning & Sizing**: Adjust table location and size to fit your chart layout
## Price Position Interpretation
### Directional Bias Determination
- **Strong Bullish**: Price above all indicator lines (momentum, signal, and volatility bands)
- **Strong Bearish**: Price below all indicator lines
- **Consolidation/Neutral**: Price between indicator lines, especially within volatility bands
### Market Participation Assessment
- **Inside Volatility Bands**: Insufficient market participants to establish clear direction
- **Short-Term Volatility Mode Advantage**: More clearly defines the neutral zone where price is caught between momentum lines and volatility bands
- **Consolidation Identification**: When price fluctuates between all indicator lines, market is seeking equilibrium
Trading Strategies
Momentum Breakouts
Wait for price to break above/below all the lines with a body close. Green for Bullish and Red for Bearish
For Short Term Mode:
Look for the first retest of any of the indicator lines (momentum or signal lines)
Wait for a reaction with body close candle (a candle that remains green/red is significantly more reliable)
Confirm that the reaction candle's body closes below/above all indicator lines
Enter after this precise line test and reaction sequence
Bearish Example
Bullish example
For Long Term Mode:
Look for the first retest of the Bullish/bearish volatility lines without closing above/below these lines
Wait for a reaction with body close candle (a candle that remains green/red is significantly more reliable)
Confirm that the reaction candle's body closes below/above all indicator lines
Enter after this precise volatility band test and reaction sequence.
Bearish example
Bullish Example
NO ENTRY EXAMPLE
Volatility Band Mean Reversion
Identify when price is near or beyond volatility bands
Look for reversal candlestick patterns or divergence
Enter when price begins moving back toward momentum lines
Exit when price reaches the opposite volatility band or momentum line
Post-Breakout Continuation
After price crosses all indicator lines, wait for a pullback
Enter when price retests but respects any indicator line as support/resistance
Confirm with multi-factor alignment (3-4 strength) in the breakout direction
Trail stops behind retested indicator lines as trade progresses
Tick Optimization Strategy
Start with default tick separation (1.0)
For ranging markets: Increase tick separation (2.0-3.0) to reduce false signals
For trending markets: Decrease tick separation (0.5-0.8) for earlier entries
Fine-tune tick values for each specific instrument based on its volatility profile
Conclusion
MVPM 2.0 provides traders with a comprehensive market analysis system that identifies high-probability setups through multi-factor confirmation. The groundbreaking tick-based calculation method, dual volatility band modes, and price position analysis work together to create a powerful edge in any market condition.
By understanding the relationships between price and the indicator's lines, traders can precisely identify insufficient market participation zones, optimal breakout points, and high-probability continuation setups. The configurable tick separation feature allows for unprecedented customization, making this indicator adaptable to any trading style, instrument, or timeframe.
Whether you're a trend trader, reversal hunter, or breakout specialist, MVPM 2.0 delivers the technical precision and visual clarity needed for consistent trading performance across all market conditions.

Index Lead LagPlots the percent change of each index over a given input lookback window length.
Indices are color coded (and customizable) to identify their respective percent change in the stacked column plot.
Table at the bottom right shows the previously closed bar's percent changes.
Indicator indicates which indices are leading and lagging over the given lookback period.

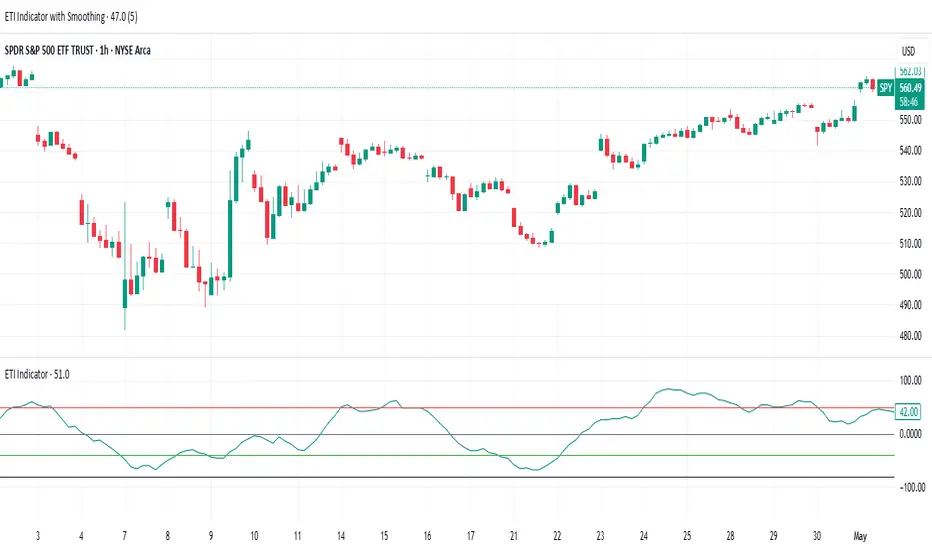
ETI IndicatorThe Ensemble Technical Indicator (ETI) is a script that combines multiple established indicators into one single powerful indicator. Specifically, it takes a number of technical indicators and then converts them into +1 to represent a bullish trend, or a -1 to represent a bearish trend. It then adds these values together and takes the running sum over the past 20 days.
The ETI is composed of the following indicators and converted to +1 or -1 using the following criteria:
Simple Moving Average (10 days) : When the price is above the 10-day simple moving averaging, +1, when below -1
Weighted Moving Average (10 days) : Similar to the SMA 10, when the the price is above the 10-day weighted moving average, +1, when below -1
Stochastic K% : If the current Stochastic K% is greater than the previous value, then +1, else -1.
Stochastic D% : Similar to the Stochastic K%, when the current Stochastic D% is greater than the previous value, +1, else -1.
MACD Difference : First subtract the MACD signal (i.e. the moving average) from the MACD value and if the current value is higher than the previous value, then +1, else -1.
William's R% : If the current William's R% is greater than the previous one, then +1, else -1.
William's Accumulation/Distribution : If the current William's AD value is greater than the previous value, then +1, else -1.
Commodity Channel Index : If the Commodity Channel Index is greater than 200 (overbought), then -1, if it is less than -200 (oversold) then +1. When it is between those values, if the current value is greater than the previous value then +1, else -1.
Relative Strength Index : If the Relative Strength Index is over 70 (overbought) then -1 and if under 30 (oversold) then +1. If the Relative Strength Indicator is between those values then if the current value is higher than the previous value +1, else -1.
Momentum (9 days) : If the momentum value is greater than 0, then +1, else -1.
Again, once these values have been calculated and converted, they are added up to produce a single value. This single value is then summed across the previous 20 candles to produce a running sum.
By coalescing multiple technical indicators into a single value across time, traders can better understand how multiple inter-related indicators are behaving at once; high scores indicate that numerous indicators are showing bullish signals indicating a potential or ongoing uptrend (and vice-versa with low scores).
Additional Features
Numerous smoothing transformations have also been added (e.g. gaussian smoothing) to remove some of the noise might exist.
Suggested Use
It is recommended that stocks are shorted when the cross below 0, and are bought when the ETI crosses above -40. Arrows can be shown on the indicator to show these points. However feel free to use levels that work best for you.
Traditionally, I have treated values above +50 as overbought and below -40 as undersold (with -80 indicating extremely oversold); however these levels could also indicate either upwards and downwards momentum so taking a position based on where the ETI is (rather than crossing levels) should be done with caution.
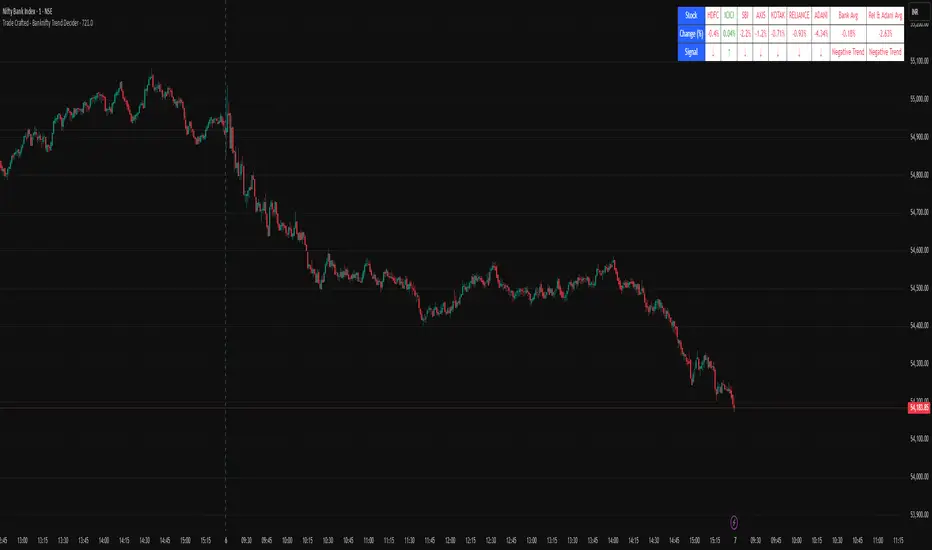
Trade Crafted - Banknifty Trend DeciderTrade Crafted - Banknifty Trend Decider
Description:
This indicator offers a quick and insightful snapshot of real-time market sentiment across major Indian banking stocks along with Reliance and Adani. It’s designed as a clean, table-based heatmap that visually tracks intraday percentage movements and trends of key financial instruments.
🔹 What it Shows:
Live % Change: Calculates the percentage difference between the current price and day’s open.
Visual Trend Arrows: See at a glance whether each stock is trending ↑ (positive) or ↓ (negative).
Banking Sector Average: Tracks the average movement of top Indian banks.
Reliance-Adani Grouping: Shows a separate combined average for Reliance and Adani Enterprises.
Total Market Sentiment: Displays overall average and gives a trend remark as “Positive Trend,” “Negative Trend,” or “Sideways” based on total average direction.
🧾 Included Stocks:
HDFC Bank
ICICI Bank
SBI
Axis Bank
Kotak Mahindra Bank (recently added)
Bank of Baroda
Reliance Industries
Adani Enterprises
📌 Use Case:
Perfect for intraday traders and investors who want a compact view of sectoral momentum. This table doesn’t generate buy/sell signals, but acts as a visual guide to current market strength and weakness.
📘 Note:
This tool is meant to support decision-making and should be used with other technical and risk management strategies.
Entropy Chart Analysis [PhenLabs]📊 Entropy Chart analysis -
Version: PineScript™ v6
📌 Description
The Entropy Chart indicator analysis applies Approximate Entropy (ApEn) to identify zones of potential support and resistance on your price chart. It is designed to locate changes in the market’s predictability, with a focus on zones near significant psychological price levels (e.g., multiples of 50). By quantifying entropy, the indicator aims to identify zones where price action might stabilize (potential support) or become randomized (potential resistance).
This tool automates the visualization of these key areas for traders, which may have the effect of revealing reversal levels or consolidation zones that would be hard to discern through traditional means. It also filters the signals by proximity to key levels in an attempt to reduce noise and highlight higher-probability setups. These dynamic zones adapt to changing market conditions by stretching, merging, and expiring based on user-inputted rules.
🚀 Points of Innovation
Combines Approximate Entropy (ApEn) calculation with price action near significant levels.
Filters zone signals based on proximity (in ticks) to predefined significant price levels (multiples of 50).
Dynamically merges overlapping or nearby zones to consolidate signals and reduce chart clutter.
Uses ApEn crossovers relative to its moving average as the core trigger mechanism.
Provides distinct visual coloring for bullish, bearish, and merged (mixed-signal) zones.
Offers comprehensive customization for entropy calculation, zone sensitivity, level filtering, and visual appearance.
🔧 Core Components
Approximate Entropy (ApEn) Calculation : Measures the regularity or randomness of price fluctuations over a specified window. Low ApEn suggests predictability, while high ApEn suggests randomness.
Zone Trigger Logic : Creates potential support zones when ApEn crosses below its average (indicating increasing predictability) and potential resistance zones when it crosses above (indicating increasing randomness).
Significant Level Filter : Validates zone triggers only if they occur within a user-defined tick distance from significant price levels (multiples of 50).
Dynamic Zone Management : Automatically creates, extends, merges nearby zones based on tick distance, and removes the oldest zones to maintain a maximum limit.
Zone Visualization : Draws and updates colored boxes on the chart to represent active support, resistance, or mixed zones.
🔥 Key Features
Entropy-Based S/R Detection : Uses ApEn to identify potential support (low entropy) and resistance (high entropy) areas.
Significant Level Filtering : Enhances signal quality by focusing on entropy changes near key psychological price points.
Automatic Zone Drawing & Merging : Visualizes zones dynamically, merging close signals for clearer interpretation.
Highly Customizable : Allows traders to adjust parameters for ApEn calculation, zone detection thresholds, level filter sensitivity, merging distance, and visual styles.
Integrated Alerts : Provides built-in alert conditions for the formation of new bullish or bearish zones near significant levels.
Clear Visual Output : Uses distinct, customizable colors for buy (support), sell (resistance), and mixed (merged) zones.
🎨 Visualization
Buy Zones : Represented by greenish boxes (default: #26a69a), indicating potential support areas formed during low entropy periods near significant levels.
Sell Zones : Represented by reddish boxes (default: #ef5350), indicating potential resistance areas formed during high entropy periods near significant levels.
Mixed Zones : Represented by bluish/purple boxes (default: #8894ff), formed when a buy zone and a sell zone merge, indicating areas of potential consolidation or conflict.
Dynamic Extension : Active zones are automatically extended to the right with each new bar.
📖 Usage Guidelines
Calculation Parameters
Window Length
Default: 15
Range: 10-100
Description: Lookback period for ApEn calculation. Shorter lengths are more responsive; longer lengths are smoother.
Embedding Dimension (m)
Default: 2
Range: 1-6
Description: Length of patterns compared in ApEn calculation. Higher values detect more complex patterns but require more data.
Tolerance (r)
Default: 0.5
Range: 0.1-1.0 (step 0.1)
Description: Sensitivity factor for pattern matching (as a multiple of standard deviation). Lower values require closer matches (more sensitive).
Zone Settings
Zone Lookback
Default: 5
Range: 5-50
Description: Lookback period for the moving average of ApEn used in threshold calculations.
Zone Threshold
Default: 0.5
Range: 0.5-3.0
Description: Multiplier for the ApEn average to set crossover trigger levels. Higher values require larger ApEn deviations to create zones.
Maximum Zones
Default: 5
Range: 1-10
Description: Maximum number of active zones displayed. The oldest zones are removed first when the limit is reached.
Zone Merge Distance (Ticks)
Default: 5
Range: 1-50
Description: Maximum distance in ticks for two separate zones to be merged into one.
Level Filter Settings
Tick Size
Default: 0.25
Description: The minimum price increment for the asset. Must be set correctly for the specific instrument to ensure accurate level filtering.
Max Ticks Distance from Levels
Default: 40
Description: Maximum allowed distance (in ticks) from a significant level (multiple of 50) for a zone trigger to be valid.
Visual Settings
Buy Zone Color : Default: color.new(#26a69a, 83). Sets the fill color for support zones.
Sell Zone Color : Default: color.new(#ef5350, 83). Sets the fill color for resistance zones.
Mixed Zone Color : Default: color.new(#8894ff, 83). Sets the fill color for merged zones.
Buy Border Color : Default: #26a69a. Sets the border color for support zones.
Sell Border Color : Default: #ef5350. Sets the border color for resistance zones.
Mixed Border Color : Default: color.new(#a288ff, 50). Sets the border color for mixed zones.
Border Width : Default: 1, Range: 1-3. Sets the thickness of zone borders.
✅ Best Use Cases
Identifying potential support/resistance near significant psychological price levels (e.g., $50, $100 increments).
Detecting potential market turning points or consolidation zones based on shifts in price predictability.
Filtering entries or exits by confirming signals occurring near significant levels identified by the indicator.
Adding context to other technical analysis approaches by highlighting entropy-derived zones.
⚠️ Limitations
Parameter Dependency : Indicator performance is sensitive to parameter settings ( Window Length , Tolerance , Zone Threshold , Max Ticks Distance ), which may need optimization for different assets and timeframes.
Volatility Sensitivity : High market volatility or erratic price action can affect ApEn calculations and potentially lead to less reliable zone signals.
Fixed Level Filter : The significant level filter is based on multiples of 50. While common, this may not capture all relevant levels for every asset or market condition. Accurate Tick Size input is essential.
Not Standalone : Should be used in conjunction with other analysis methods (price action, volume, other indicators) for confirmation, not as a sole basis for trading decisions.
💡 What Makes This Unique
Entropy + Level Context : Uniquely combines ApEn analysis with a specific filter for proximity to significant price levels (multiples of 50), adding locational context to entropy signals.
Intelligent Zone Merging : Automatically consolidates nearby buy/sell zones based on tick distance, simplifying visual analysis and highlighting stronger confluence areas.
Targeted Signal Generation : Focuses alerts and zone creation on specific market conditions (entropy shifts near key levels).
🔬 How It Works
Calculate Entropy : The script computes the Approximate Entropy (ApEn) of the closing prices over the defined Window Length to quantify price predictability.
Check Triggers : It monitors ApEn relative to its moving average. A crossunder below a calculated threshold (avg_apen / zone_threshold) indicates potential support; a crossover above (avg_apen * zone_threshold) indicates potential resistance.
Filter by Level : A potential zone trigger is confirmed only if the low (for support) or high (for resistance) of the trigger bar is within the Max Ticks Distance of a significant price level (multiple of 50).
Manage & Draw Zones : If a trigger is confirmed, a new zone box is created. The script checks for overlaps with existing zones within the Zone Merge Distance and merges them if necessary. Zones are extended forward, and the oldest are removed to respect the Maximum Zones limit. Active zones are drawn and updated on the chart.
💡 Note:
Crucially, set the Tick Size parameter correctly for your specific trading instrument in the “Level Filter Settings”. Incorrect Tick Size will make the significant level filter inaccurate.
Experiment with parameters, especially Window Length , Tolerance (r) , Zone Threshold , and Max Ticks Distance , to tailor the indicator’s sensitivity to your preferred asset and timeframe.
Always use this indicator as part of a comprehensive trading plan, incorporating risk management and seeking confirmation from other analysis techniques.

MissedPrice Volume Method[KiomarsRakei]█ Core Concept:
This script detects price zones that are highly likely to be revisited — areas where price moved too quickly to fully fill market activity. Using sharp volume shifts and volatility filters, the script identifies these “missed” levels and generates signals pointing toward them.
Signals are generated before price reaches the zone, allowing you to analyze price behavior both before and after the zone is touched. These zones often act like magnets for price, making them ideal for short-term.
Examples of signals and high hit rate of Missed zones
█ How It Works:
The script monitors 3-candle volume and price behavior to detect moments where volume accelerates abnormally compared to recent averages. When a potential missed zone is found and price hasn’t revisited it yet, a signal is created in advance, pointing to that zone as a likely future target.
█ Features:
Zone Visualization: Dynamic boxes show price targets based on missed volume areas.
Pre-Zone Signals: Alerts fire before price returns, offering early trade setups.
Stat Tracking System: Automatically logs signals, win rate, and average profit.
Live Performance Table: On-chart stats including hit/miss breakdown and late-return analysis.
Works on All Markets: Compatible with any chart that provides volume — crypto, forex, indices, or stocks.
A signal is considered successful when price touches the zone. However, not all zones are guaranteed to be revisited.
█ Key Inputs & Stats Table:
Volume Filters: Control signal sensitivity using min/max relative volume shift.
Zone & Line Settings: Adjust how long the zone stays visible and whether entry lines are drawn.
Custom Colors: Choose colors for buy/sell zones, lines, and visuals.
📊 Table Metrics:
Total Signals: Count of all generated signals.
Win Rate: % of signals where price returned to the zone (hit = touched the zone, regardless of timing).
Bad Signals: Signals that took too long to hit or were never hit.
Bad but Hit: Signals marked bad but eventually touched the zone.
Bad signals are marked in red. These indicate zones that price failed to reach within the expected time window, showing where the script identified a target that remained unfulfilled.

Rango HAThis script calculates the range of Heikin-Ashi candles and offers a unique perspective on the expansion and contraction of the smoothed price. The "Range Scale" option allows users to adjust the indicator's sensitivity for backtesting and comparison with other indicators.
Display:
Dynamically colored columns indicate changes in the range compared to the previous candle, differentiating between bullish and bearish for momentum and gray columns for weakness or exhaustion.
Analytical examples:
In this case the price tries to cross a previous low but it does so with grey candles and divergence in the oscillator, this is a possible bullish scenario and all that remains is to wait for a signal such as a bullish engulfing candle with ascending columns.
Here, two hypothetical trades are observed using the same strategy. The price struggles to break and remain above a previous high. We observe divergence in the oscillator and gray or low dango candles in the price, followed by a bearish engulfing candle that acts as a trigger. The same thing works in reverse in the bullish example seen on the right.
Another case where engulfing candles act as triggers that indicate an increase in momentum after signs of weakness.
I recommend using this indicator in conjunction with price action, as seen above, to identify weak movements and the beginnings of strong movements, relative to previous highs and lows. I add candle colors relative to the oscillator bar size to improve the clarity of the price reading, but I don't add signals to avoid cluttering the price display. Furthermore, if the signals aren't used in conjunction with other key levels, it can lead to poor decisions.
All images shown are on the M1 timeframe, but everyone can use whatever they like.
I hope it helps. If you want to make any changes or additions, please feel free to request them in the comments.
Good luck with your trading!

LANZ Strategy 4.0🔷 LANZ Strategy 4.0 — Trend Impulse Detection with Risk Management
LANZ Strategy 4.0 is a multi-indicator trend strategy designed for short to medium-term trading on any asset or timeframe. It combines Parabolic SAR, Supertrend, ADX, and time zone highlighting to detect and confirm trend impulses, while managing entries with dynamic Stop Loss (SL) and Take Profit (TP) levels.
🧠 Core Components:
Parabolic SAR: Identifies short-term trend reversals.
Supertrend: Highlights trend continuation zones.
ADX Filter: Ensures trend strength by filtering entries when ADX exceeds a defined threshold.
Impulse Detection Logic: Detects and confirms movement impulses with a counter, only generating trade signals on confirmed sequences.
Risk Management: Calculates dynamic SL/TP with a default risk-reward ratio of 1:2, minimum SL of 4 pts, and maximum of 12 pts.
📊 Visual Features:
Trend lines from Supertrend and SAR.
Colored background zones for different sessions (Asia, NY).
Labels and lines for entry, SL, and TP.
Movement number labels help visualize impulse progression.
Alerts when a new impulse is confirmed.
⚙️ How It Works:
The strategy waits for a confirmed impulse (i.e., change in SAR + Supertrend + ADX filter).
Once a valid impulse is confirmed:
A trade signal (BUY/SELL) is shown.
SL and TP levels are calculated and drawn.
The script monitors live price to determine if SL or TP is hit.
Impulse counter advances to label movement progression.
🔔 Alerts:
You will receive an alert each time a new valid impulse is confirmed, indicating a potential trading opportunity.
📝 Notes:
Script is intended for discretionary or assisted trading, not automated execution.
Works best during active sessions with visible trend direction.
You can adjust ATR period, multiplier, SL padding, and impulse thresholds.
Credits:
Developed by LANZ combines established technical indicators and original impulse-count logic.

Gamma + Fibonacci EMA Bands# Gamma + Fibonacci EMA Bands
## Overview
The Gamma + Fibonacci EMA Bands indicator combines two powerful analytical approaches: Gamma-weighted Exponential Moving Averages and Fibonacci sequence-based standard EMAs. This dual system creates a comprehensive "band" structure that helps identify trend direction, strength, and potential reversal zones with greater precision than single moving average systems.
## Features
- **Gamma-weighted EMAs**: Three customizable Gamma EMAs (fast-responding) with adjustable gamma parameters
- **Fibonacci Sequence EMAs**: Six standard EMAs based on the Fibonacci sequence (34, 55, 89, 144, 233, 377)
- **Visual Band Structure**: Color-coded for instant visual analysis
- **Trend Confirmation**: Multiple timeframe validation through varied moving average periods
- **Support/Resistance Identification**: Natural price reaction zones highlighted by EMA confluences
## How It Works
The indicator uses two complementary EMA systems:
1. **Gamma EMAs** (γ-EMAs) - These responsive moving averages use a direct gamma weighting factor (between 0-1) rather than a period length. Lower gamma values create smoother lines, while higher values create more responsive ones. These react quickly to price changes and serve as short-term trend indicators.
2. **Fibonacci EMAs** - These traditional EMAs use period lengths based on the Fibonacci sequence (34, 55, 89, 144, 233, 377). They provide longer-term trend context and naturally identify key support/resistance levels that align with market psychology.
## Interpretation
### Trend Direction
- When price is above all bands: Strong bullish trend
- When price is below all bands: Strong bearish trend
- When price is between bands: Consolidation or trend transition
### Support/Resistance
- Gamma EMAs (purple shades): Short-term dynamic support/resistance
- Fibonacci EMAs (orange/red shades): Stronger, longer-term support/resistance
### Trend Strength
- Wider band separation: Stronger trend momentum
- Compressed bands: Consolidation or trend weakness
### Reversal Signals
- Price breaking through multiple bands: Potential trend reversal
- Gamma EMAs crossing Fibonacci EMAs: Changing momentum
## Settings
- **Source**: Price data source (default: close)
- **Gamma 1**: Fast γ-EMA value (default: 0.2)
- **Gamma 2**: Medium γ-EMA value (default: 0.5)
- **Gamma 3**: Slow γ-EMA value (default: 0.8)
## Notes
This indicator works best on higher timeframes (1H+) and liquid markets. The Gamma-weighted EMAs provide faster signals while the Fibonacci sequence EMAs provide reliable support/resistance levels that often align with key market turning points.
For optimal use, watch for price interaction with these bands and how the bands interact with each other to confirm trend changes before they become obvious to the majority of market participants.