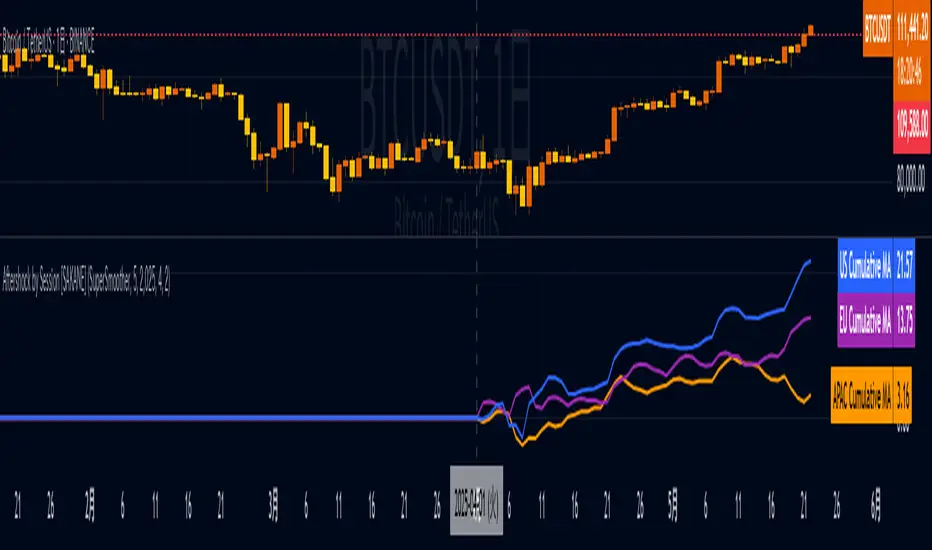
Aftershock by Session [SAKANE]■ Background & Motivation
In 24/7 markets like crypto, not all participants react simultaneously to major events.
Instead, reactions unfold across different regional trading sessions — Asia (APAC), Europe (EU), and the United States (US) — each with its own tempo and sentiment.
This indicator is designed to visualize which session drives the market after a key event — capturing the "aftershock" effect that ripples through time zones.
■ Key Features
Tracks price return (open → close) for each session: APAC / EU / US
Cumulative session returns are calculated and visualized
Smoothing options: SMA, EMA, or Ehlers SuperSmoother
Optimized for daily charts to highlight structural momentum shifts
Toggle visibility of each session independently
■ Why “Aftershock”?
Take April 2, 2025 — the day of the “Trump Tariff Opening.”
That policy announcement triggered a market-wide response. But:
Which session reacted first?
Which session truly moved the market?
This indicator is named “Aftershock” because it helps you see the ripple effect of such events — when and where momentum followed.
■ How to Use
Search for “Aftershock by Session ” on TradingView
Add it to your chart (use Daily timeframe)
Customize sessions and smoothing options via settings
You can also bookmark it for quick access.
■ Insights & Use Cases
Detect which session initiated or led market moves after news events
Understand geo-temporal dynamics — did the move start in Asia, Europe, or the US?
For example, on April 2, 2025, the day Trump’s tariff pivot was announced:
You can instantly see which session took the lead —
the APAC session hesitated, while the US session drove the trend.
This insight becomes visually obvious with the cumulative lines.
■ Unique Value
Unlike typical indicators based on raw price action,
Aftershock analyzes market movement through a session-based structural lens.
It captures where capital actually moved — and when.
A tool not just for technical analysis, but for event-driven, macro-aware market reading.
■ Final Thoughts
To truly understand market mechanics, we must look beyond candles and trends.
Aftershock by Session breaks down the 24-hour cycle into meaningful regional flows,
allowing you to track the true drivers behind price momentum.
Whether you're trading, researching, or tracking macro catalysts,
this tool helps answer the key question:
“Who moved the market — and when?”
Trend Analysis
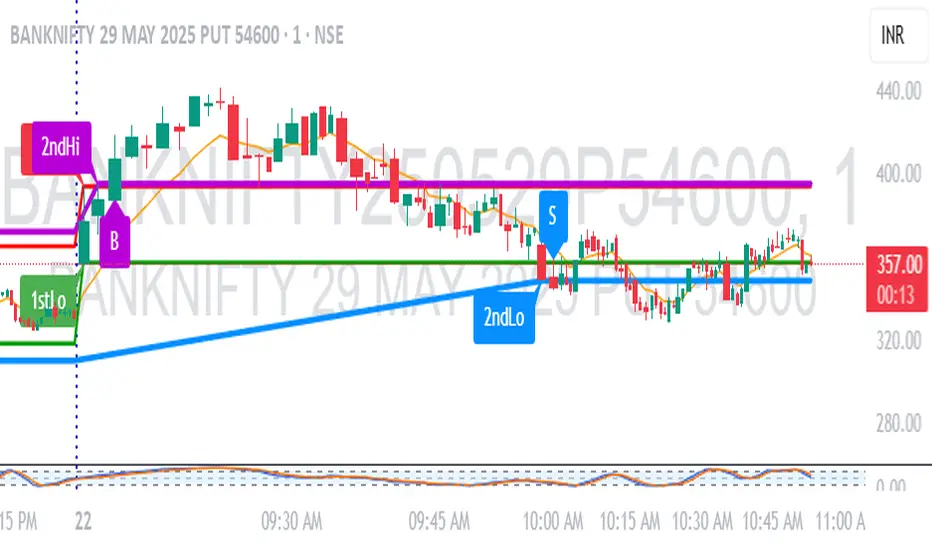
1M Scalp Setup – 2ndHi/2ndLo Breakout1M Scalp Setup – 2ndHi/2ndLo Breakout
This script is designed for 1-minute chart scalpers seeking high-probability intraday breakout setups based on early session price action. The strategy revolves around identifying the first high and low of the day, and then detecting the second breach (2nd high or 2nd low) to anticipate breakout entries.
🔍 Core Logic:
EMA Filter : A configurable EMA (default 8-period) is plotted for trend context.
1st High/Low Detection : Captures the very first high and low of each trading day.
2nd High/Low Markers : Identifies the second time price breaks the initial high or low, acting as a potential signal zone.
Breakout Signals :
A Buy Signal is triggered when price closes above the 2nd high.
A Sell Signal is triggered when price closes below the 2nd low.
Each signal is only triggered once per day to reduce noise and avoid overtrading.
🖌️ Visual Markers:
1stHi and 1stLo : Early session levels (red and green).
2ndHi and 2ndLo : Key breakout reference points (purple and blue).
B and S Labels : Buy and Sell triggers marked in real-time once breakouts occur.
⚙️ Inputs:
EMA Length (default: 8)
Customizable Colors for Buy/Sell signals and key markers
This tool is best used in fast-moving markets or during high-volume sessions. Combine with volume or higher-timeframe confirmation for improved accuracy.
IPDA with Order Blocks [Enhanced]Summary of the Code
This script plots IPDA Standard Deviations on a price chart, helping traders visualize potential support and resistance levels based on a series of user-defined deviations. It uses swing high/low points and time-based fractal lookbacks (monthly, weekly, daily, or intraday) to define price anchors and compute deviation lines.
Key features include:
Deviations: It calculates and plots deviation levels based on the distance between swing highs and lows, which traders can use as price targets or zones of interest.
Timeframes:
Monthly (higher timeframe analysis)
Weekly (medium-term analysis)
Daily and Intraday (shorter-term precision)
Customization:
Choose which deviation levels (e.g., 0, 1, -1, -2) to display.
Hide labels or adjust their sizes for cleaner charts.
Option to remove invalidated deviation levels dynamically.
Visual Cleanliness: Automatically removes clutter by hiding or deleting invalid deviation levels and focusing on active price zones.
How to Utilize It for Intraday Trading to Make $1,000
Here’s how to effectively use the indicator to optimize intraday trading:
1. Set the Right Timeframe:
Use the 15-minute or 1-hour chart for intraday setups.
Ensure the "Intraday" lookback option is enabled to focus on shorter-term swings.
2. Interpret the Levels:
Bearish Order Blocks: Look for red lines (bearish deviation) as potential resistance zones where the price may reverse downward.
Bullish Order Blocks: Look for green lines (bullish deviation) as potential support zones where the price may bounce upward.
3. Plan Entries and Exits:
Entry: Buy near a green order block or short near a red order block, confirming the trade with additional signals (e.g., candlestick patterns, momentum indicators).
Stop Loss: Place your stop below the green line (for buys) or above the red line (for shorts).
Profit Targets: Use deviation levels as targets (e.g., from the 0 level to +1 or -1).
4. Combine with Market Context:
Use the script alongside volume profile, trend indicators, or news events for confirmation.
Avoid trading during major news events unless aligned with deviations.
5. Position Sizing for $1,000 Goal:
Trade liquid instruments like Nasdaq futures (NQ) or major forex pairs.
Risk 1-2% of your capital on each trade and scale into positions if confirmed.
Target a profit of 10-20 points per trade on Nasdaq futures, with 1-2 trades daily.
6. Monitor Key Timeframes:
Pre-market (before 9:30 AM EST): Mark deviation levels to predict market open behavior.
Midday & Power Hour (3-4 PM EST): Watch for breakouts or retests around key deviation levels.
By combining this tool with disciplined risk management and a clear trading plan, you can systematically work toward your profit target while minimizing unnecessary risks

GOD Complex Trading By QTX Algo SystemsGOD Complex Trading by QTX Algo Systems
Overview
GOD Complex Trading is a comprehensive signal engine that combines multiple QTX Algo Systems indicators into a unified framework for identifying high-confluence reversal and continuation setups. It includes dynamic entry detection, adaptive stop loss logic, multi-timeframe analysis, score-based risk scaling, and real-time trade visualization.
This script is designed for discretionary traders who want to see structured trade logic unfold directly on the chart, with visual labeling of entry type, dynamic stop loss placement, exit score computation, and key trade metrics shown in an on-chart table.
How It Works
Each trade is classified into one of four categories:
Reversal Long
Reversal Short
Continuation Long
Continuation Short
Each trade type has a distinct confluence requirement involving real-time and higher-timeframe inputs. The indicator calculates a confluence score out of 200 and determines HTF (high-timeframe) directional bias across three layers (HTF1, HTF2, HTF3), which are configurable.
QTX Indicators Used
This script integrates internal logic from the following proprietary QTX tools:
VBM (Volatility-Based Momentum) – Confirms directional bias using momentum slope and volatility increase.
VBSMI (Volatility-Based SMI) – Detects early momentum shifts via band exits and crossovers of adaptive smoothed SMI values.
SEA (Statistically Extreme Areas) – Highlights exhaustion zones using normalized volatility, smoothed range deviation, and SMI divergence.
SPB (Statistical Price Bands) – Uses volatility and trend-adjusted percentiles to define dynamic overbought/oversold zones.
COI (Continuation Opportunity Indicator) – Validates re-entry opportunities following a pullback during trend continuation.
Signal Logic – Examples
Each entry type is built from layered logic:
Reversal Long (Example)
Triggers when:
VBSMI is in dynamic oversold and crosses up
SEA level is at or below threshold (signaling statistical exhaustion)
SPB confirms recent low percentile hit
VBM and COI do not indicate trend continuation in the opposite direction
Continuation Long (Example)
Triggers when:
No recent extreme zones (SPB or SEA) are present
VBM confirms continued trend momentum
VBSMI crosses up and confirms strength
COI may confirm re-entry conditions
High-timeframe bias scores show alignment
All entries are subject to filter checks, including:
Minimum confluence score
HTF bias thresholds (HTF1, HTF2, HTF3)
Position type and trade history
Key Features
Trade Type Auto-Labeling
Each signal is labeled (“Rev Long”, “Cont Short”, etc.) directly on the chart for instant identification.
Stop Loss Visualization
Stop loss levels are calculated using a weighted average of ATR-based padding and prior swing highs/lows. Ghost lines are drawn for Add trades.
TP1 / TP2 Logic
TP1: Fires on opposite VBSMI crossover (momentum loss).
TP2: Fires when the opposite side’s reversal score exceeds a user-defined threshold.
Position Size & Risk Table
The on-chart table shows estimated trade size (based on max risk input), stop loss price, and calculated exit score. Reversal trades scale based on confluence score, while continuation trades use linear scaling.
Multi-Timeframe Confluence
The script uses three automatic higher timeframes to calculate directional bias and exit score amplification. This allows scoring logic to reflect broader trend alignment.
Add Trade Logic
The indicator detects both same-style and cross-style Add setups. Add signals are labeled and visualized, but should be used cautiously.
Auto-Close on Opposite Signal
When an opposite entry signal is triggered (e.g. Cont Short after Rev Long), the current trade is automatically considered closed, resetting tracking variables and metrics.
Additional Features
Fully bar-closed logic: no repainting or mid-bar recalculation.
High-precision control over alert triggering using bias filters and score ranges.
Dedicated alert conditions for all key trade types and TP/SL events.
Score-based position sizing using dynamic confluence score caps.
Table remains visible for a configurable number of bars after trade close.
Use Cases
Manual discretionary entries with clearly labeled setups and real-time validation
Score-based trade review and journaling using TP1/TP2 and exit score
Optimizing trade filters using alerts with HTF bias and confluence thresholds
Data-driven strategy refinement by observing which trades reach full exits
Disclaimer
This tool is provided for educational and informational purposes only. It does not guarantee any particular outcome or profitability. Always use proper risk management, backtest thoroughly, and consult a financial professional if needed.

Full Day Midpoint Line with Dynamic StdDev Bands (ETH & RTH)A Pine Script indicator designed to plot a midpoint line based on the high and low prices of a user-defined trading session (typically Extended Trading Hours, ETH) and to add dynamic standard deviation (StdDev) bands around this midpoint.
Session Midpoint Line:
The midpoint is calculated as the average of the session's highest high and lowest low during the defined ETH period (e.g., 4:00 AM to 8:00 PM).
This line represents a central tendency or "fair value" for the session, similar to a pivot point or volume-weighted average price (VWAP) anchor.
Interpretation:
Prices above the midpoint suggest bullish sentiment, while prices below indicate bearish sentiment.
The midpoint can act as a dynamic support/resistance level, where price may revert to or react at this level during the session.
Dynamic StdDev Bands:
The bands are calculated by adding/subtracting a multiple of the standard deviation of the midpoint values (tracked in an array) from the midpoint.
The standard deviation is dynamically computed based on the historical midpoint values within the session, making the bands adaptive to volatility.
Interpretation:
The upper and lower bands represent potential overbought (upper) and oversold (lower) zones.
Prices approaching or crossing the bands may indicate stretched conditions, potentially signaling reversals or breakouts.
Trend Identification:
Use the midpoint as a reference for the session’s trend. Persistent price action above the midpoint suggests bullishness, while below indicates bearishness.
Combine with other indicators (e.g., moving averages, RSI) to confirm trend direction.
Support/Resistance Trading:
Treat the midpoint as a dynamic pivot point. Price rejections or consolidations near the midpoint can be entry points for mean-reversion trades.
The StdDev bands can act as secondary support/resistance levels. For example, price reaching the upper band may signal a potential short entry if accompanied by reversal signals.
Breakout/Breakdown Strategies:
A strong move beyond the upper or lower band may indicate a breakout (bullish above upper, bearish below lower). Confirm with volume or momentum indicators to avoid false breakouts.
The dynamic nature of the bands makes them useful for identifying significant price extensions.
Volatility Assessment:
Wider bands indicate higher volatility, suggesting larger price swings and potentially riskier trades.
Narrow bands suggest consolidation, which may precede a breakout. Traders can prepare for volatility expansions in such scenarios.
The "Full Day Midpoint Line with Dynamic StdDev Bands" is a versatile and visually intuitive indicator well-suited for day traders focusing on session-specific price action. Its dynamic midpoint and volatility-adjusted bands provide valuable insights into support, resistance, and potential reversals or breakouts.

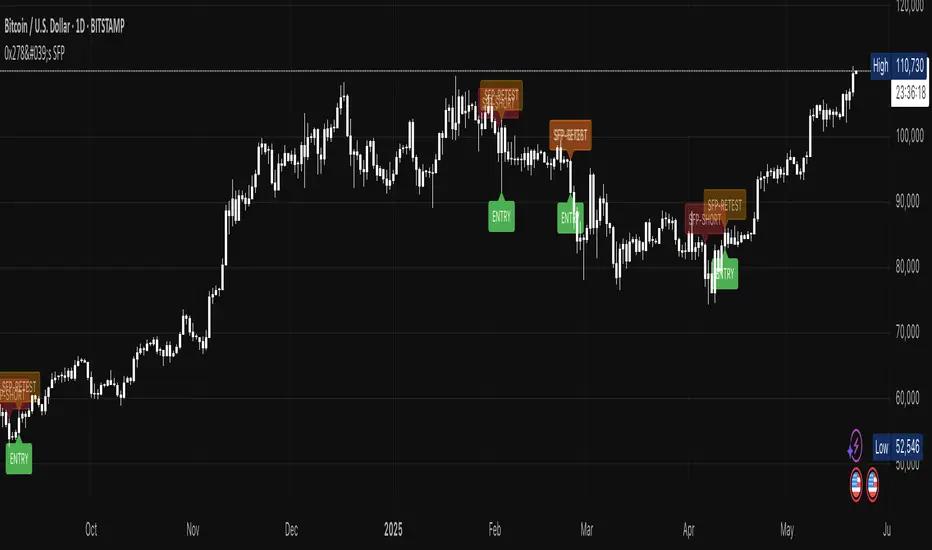
0x278's Swing-Failure-Pattern (SFP)0x278's Swing-Failure-Pattern (SFP) ‑ Confirmed Short
Table of Contents
Introduction
Core Concept – What Is an SFP?
How the Indicator Works
Visual Elements & Their Meaning
Input Parameters Explained
Step-by-Step Trading Playbook
Example Workflow (Daily BTC-USDT)
Alerts & Automation
Tips, Tricks & Best Practices
FAQ
Advanced Configuration & Asset-Class Playbook
1. Introduction
The Swing-Failure-Pattern (SFP) – Confirmed Short indicator spots and tracks bearish SFPs on any market and timeframe, with defaults tuned for Daily charts.
A bearish SFP occurs when price sweeps a prior swing high (liquidity grab) and then decisively rejects lower , signalling a possible trend reversal or sharp pullback.
This script automatically:
Identifies the liquidity sweep & rejection (‐"SFP-SHORT" label)
Confirms directional intent via a structure-breaking close below the setup low
Paints a preferred sell-on-retest zone and tracks its validity
Identifies optimal entry opportunities when price retests the zone
Generates optional retest and entry alerts when trading conditions appear
Self-cleans after a configurable number of bars – keeping your chart tidy
Default Timeframe : Daily
Default Market : Crypto / FX majors
Works On : All symbols + timeframes – simply adjust parameters.
2. Core Concept – What Is an SFP?
Sweep (Liquidity Grab) – Price trades above a meaningful swing high, triggering stops & inducing breakout buyers.
Rejection – The same bar (or the next) closes back below the swept high, invalidating the breakout.
Structure Break – Bears confirm intent by closing below the "setup low" (the most recent pivot low before the sweep).
Retest – Price retraces to the sweep zone. Traders seek entries inside the upper half of that zone with invalidation just above the swing high.
The indicator encodes these four steps so you can spot high-quality bearish reversals without manual bar-by-bar analysis.
3. How the Indicator Works
Phase: Sweep & Rejection
Script Logic: high > lastSwingHigh and close < lastSwingHigh
Visual Cue: Red SFP-SHORT label above candle
Phase: Structure Break
Script Logic: Close < setupLow while pattern locked
Visual Cue: Zone (red line-box) plotted; SFP-SHORT label stays
Phase: Retest Tracking
Script Logic: Zone stays active for retestExpiry bars or until tapped
Visual Cue: Orange SFP-RETEST label when hit
Phase: Entry Signal
Script Logic: Price rejection within retest zone
Visual Cue: Green ENTRY label at optimal entry point
Phase: Expiry / Cleanup
Script Logic: Zone deleted after expiry
Visual Cue: Labels fade but remain visible for reference
All calculations reset after each completed/expired pattern ensuring fresh, uncluttered signals.
4. Visual Elements & Their Meaning
SFP-SHORT (red) – Bar that swept a prior high and closed below it.
Red Box / Line – Preferred sell zone between the swing high (upper bound) and dynamic lower bound (see sizing methods). Extends right until filled/expired.
SFP-RETEST (orange) – Bar that first tags the zone after confirmation.
ENTRY (green) – Appears when a high-probability entry signal occurs within the retest zone.
EXPIRED (gray) – Appears when the retest zone expires without being hit.
Visual Persistence – Labels fade but remain visible after expiry for reference and historical analysis.
5. Input Parameters Explained
Pivot Detection
Pivot left / right : Bars left/right of the pivot that must stay below/above it. Tip : Symmetrical values (3/3) work best for clean structure.
Retest Management
Retest expiry (bars) : Lifespan of a retest zone before it is considered stale. Default: 14 bars on Daily . Tip : Shorten for intraday, lengthen for swing trading.
Retest Zone Sizing
Sizing method : Select Static %, ATR-based or Hybrid logic for the lower boundary. Tip : Hybrid balances tight stops with realistic fills.
Static % : Fixed fraction of sweep range when Static/Hybrid is selected. Tip : Higher % deepens zone & widens stop.
ATR period : Look-back length for ATR when volatility sizing is used. Tip : Increase to smooth choppy markets.
ATR multiplier : Multiplier applied to ATR in ATR-based/Hybrid mode. Tip : Higher value widens zone during volatility.
Visual – Retest Zone
Show retest zone box : Toggles drawing of the semi-transparent sell zone box. Tip : Disable for ultra-clean look.
Retest box color : Fill colour of the box (alpha = transparency). Tip : Match your chart theme.
Max retest boxes : How many historical boxes remain visible (0 = unlimited). Tip : Lower to boost performance.
Only show active boxes : Automatically deletes a box once it's hit. Tip : Reduces clutter during back-testing.
Visual – General
Minimal mode : Hides most visuals apart from critical labels. Tip : Ideal for screenshots.
Show retest zone line : Draws a vertical line linking upper/lower boundaries. Tip : Acts as a quick depth guide.
Show ENTRY labels : Plots 'ENTRY' on optimal candles. Tip : Turn off for manual confirmation.
Labels
Label size : Overall size of all labels. Tip : tiny / small / normal.
Use simple label style : Switches to pixel text style for labels. Tip : Faster rendering on low-spec machines.
Advanced
minPct / maxPct (hard-coded) : Internal floor/cap for Hybrid logic. Tip : Exposed in code for power-users only.
Zone-Sizing Methods
Static – Lower bound = sweepRange × staticPct.
ATR-based – Lower bound = ATR × multiplier, normalised to the sweepRange.
Hybrid – Uses the greater of Static and ATR-based (capped by an internal safety ceiling).
6. Step-by-Step Trading Playbook
Identify Context – Prefer setups against extended moves into obvious highs (e.g., daily swing highs, prior week high, round numbers).
Wait for SFP Confirmation – The indicator will label an SFP-SHORT only after the candle closes. Do not front-run.
Structure-Break Close – A close below setupLow turns the zone live. This is your go signal – prepare sell orders.
Place Orders in the Zone
Entry : Limit order anywhere between retestLower and the swing high.
Stop : 1-2 ticks/pips above the swing high.
Risk Management
Size position so risk per trade ≤ account risk % (common: 0.5-1%).
If no retest before retestExpiry bars → cancel order .
Targets
Conservative: First liquidity pocket / FVG below.
Aggressive: 2-3× risk or next HTF support.
Trail or Partial – Consider trailing stop once 1R is achieved or partial profit at 1R.
7. Example Workflow (Daily BTC-USDT)
BTC trades to a fresh one-month high at $31 050 sweeping prior highs.
Candle closes at $30 420 – below the swept high – SFP-SHORT label appears.
Two days later, candle closes below setupLow at $29 880 – confirmation & zone plotted (upper = $31 050, lower ≈ $30 550).
Five days later price retests the zone hitting $30 750 – SFP-RETEST alert fires, trade filled.
Stop placed @ $31 120 (70$ risk). 1R target = $29 680 reached four days later.
8. Alerts & Automation
SFP Short confirmed
Fires When: Structure-break close below setupLow.
Suggested Action: Prepare/submit sell-limit order in the zone.
SFP Short retest
Fires When: Price enters the retest zone.
Suggested Action: Monitor for entry signals or prepare for manual entry.
SFP Short Entry Signal
Fires When: Optimal entry conditions detected within retest zone.
Suggested Action: Execute short trade with defined risk parameters.
Use TradingView's Webhook URL to forward alerts to a trade-execution bot (e.g., PineConnector) for automated order placement.
9. Tips, Tricks & Best Practices
Combine with HTF Bias – Only take bearish SFPs in bearish weekly trend.
Watch Volume – High volume on the sweep bar adds conviction.
Time Window – SFPs during NY session FX / US session crypto tend to be stronger.
Cluster Zones – Multiple overlapping SFP zones increase probability; treat the cluster as one larger supply.
Avoid News – Skip SFPs forming minutes before high-impact macro news.
10. FAQ
Q: Can I use this on lower timeframes?
A: Yes – reduce retestExpiry (e.g., 15 bars on 15-minute) and test ATR-based sizing.
Q: Does it work for longs?
A: This script focuses on bearish SFPs. Clone & invert conditions for longs.
Q: Why did a zone disappear?
A: Either it expired (retestExpiry) without a retest or the cleanup routine removed old visuals to stay within Pine limits (500 objects per type).
Q: What's the difference between the "SFP-RETEST" and "ENTRY" signals?
A: "SFP-RETEST" indicates price has entered the zone, while "ENTRY" signals an optimal entry opportunity based on price rejection within the zone.
Q: How do I customize the label appearance?
A: Use the "Label size" and "Use simple label style" settings to adjust all labels to your preferred visual style.
Happy trading & trade safe!
11. Advanced Configuration & Asset-Class Playbook
Why does the retest box feel "too high" and how do I actually get filled? Use the quick tweaks below or the power-user code snippet to shape the zone to your personality and instrument.
11.1 Why the default box is shallow
The Static 25 % / ATR-Hybrid logic keeps stops small. Around 50 % of Daily BTC SFPs never look back – that's the cost of tight risk. If you need higher fill-rates, deepen the zone (11.2).
11.2 Three slider moves – no coding required
Retest zone sizing method – switch Static → Hybrid or ATR-based
Static % – raise from 0.25 → 0.45-0.60
ATR multiplier – raise from 1.0 → 1.5-2.0
Each turn pulls the lower edge of the box deeper while keeping the invalidation at the swing high.
11.3 One-liner for coders
To allow >60 % of the sweep range edit the source:
Old code:
minPct = 0.05
maxPct = 0.60
New code:
minPct = 0.05
maxPct = input.float(0.60, "Max retest % of sweep", step = 0.05, minval = 0.10, maxval = 0.95)
Then dial the cap up to ~0.80-0.90 from the settings panel.
11.4 If price never comes back…
No-retest partial – take 25-40 % size on the confirmation candle, stop above the high.
Lower-TF confirmation – drop to 4 h / 1 h and hunt an internal SFP or bearish FVG inside the sweep.
ATR trail – if price dumps immediately, trail the stop above each new lower-high.
11.5 Asset-Class Cheat-Sheet
Crypto – Daily : Static %: 0.20-0.35, ATR mult: 1.0, Retest Expiry: 12-20 . Notes : High volatility; sweeps expand fast.
FX Majors – 4 h/D : Static %: 0.25-0.40, ATR mult: 1.2, Retest Expiry: 15-25 . Notes : ATR handles session compression.
Index Futures – 1 h : Static %: 0.30-0.50, ATR mult: 1.5, Retest Expiry: 10-20 . Notes : Hybrid recommended; gaps tighten sweeps.
US Equities – 30 m : Static %: 0.35-0.55, ATR mult: 1.5-2.0, Retest Expiry: 10-14 . Notes : Consider no-retest entry on earnings spikes.
Always forward-test on your own symbol & timeframe ✔️
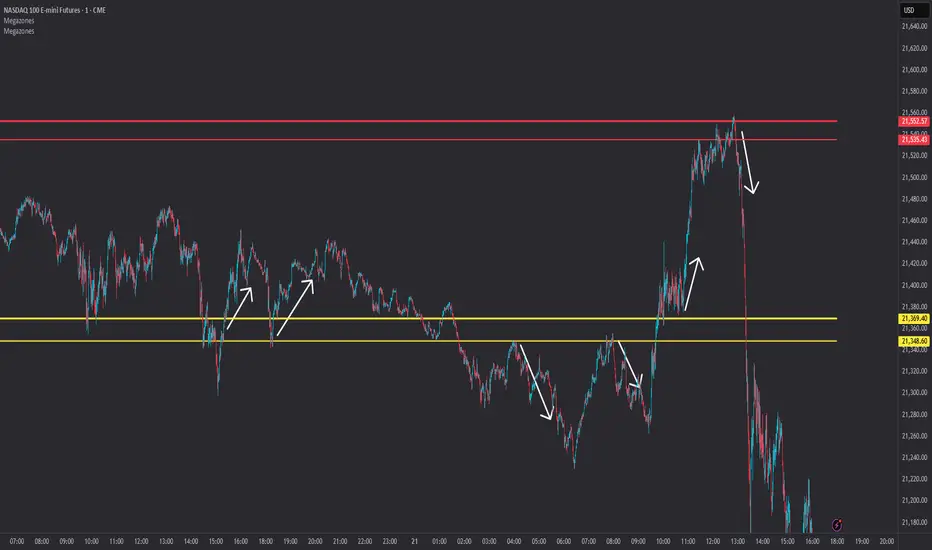
Megazones📦 Megazones — Auto-Expanding Range Detection
Megazones is a dynamic tool that detects price expansion ranges based on pivot structure. It automatically plots a pair of horizontal lines when both pivot highs and pivot lows are expanding — signaling directional strength and potential breakout zones.
🧠 How It Works:
- Pivot Detection: The script finds local highs/lows using a configurable Pivot Lookback length.
- Expansion Logic: It checks for consecutive higher highs and higher lows (configurable count).
- Zone Projection: When both expansions are detected, it draws a fading "zone" using two horizontal lines based on the latest pivot high and low.
⚙️ Settings:
- Pivot Lookback: How far left/right to confirm a pivot.
- Expansion Detection Window: How many bars back to keep pivots in memory.
- Min Expanding Highs/Lows: How many higher highs/lows must occur in a row to trigger zone detection.
🔍 Key Concept:
It identifies moments when the market is forming a structured expansion, where both higher highs and higher lows appear sequentially — suggesting potential breakout pressure or momentum continuation.
✅ Use Cases:
- Visual confirmation of building bullish structure.
- Anticipating breakout areas from clean expansion phases.
- Identifying trend-following continuation zones.
PSP/TrueOpen💎 Precision Swing Point (PSP) & True Open Levels Indicator 🚀
This advanced tool highlights Precision Swing Points (PSPs) and plots True Open Levels across major timeframes. It’s designed to help you spot potential reversals, align with institutional bias, and build higher-probability setups — all while giving you full customization over how everything looks and feels.
🔥 Key Features:
PSP Candle Highlighting
Automatically detects and highlights candles that meet the PSP criteria — usually found at major turning points in the market. Full customization options for wick color, border color, and visual appearance.
True Open Levels
TSO – True Session Open
TDO – True Day Open
TWO – True Week Open
TMO – True Month Open
Customization Options (for each True Open level):
Color
Line type – solid, dashed, or checkered
Line length – full-width or shortened
Custom Text Labels – Add your own notes to each level (e.g., “Weekly Bias,” “Institutional Anchor”)
🌟 What is a PSP?
A Precision Swing Point is a specific candle formation that shows up before strong moves. It usually sweeps a key level and closes with intent. PSPs often confirm SMT or SSMT divergences with a candle close at key levels — adding conviction to the idea that a reversal or expansion is about to unfold.
These points offer clean, asymmetric opportunities when aligned with structure or higher-timeframe bias. This indicator spots them automatically for you — no more guessing.
🚨 How to Use True Opens to Your Advantage:
True Opens act as precision anchors for market bias. When you compare the current cycle’s open to the higher timeframe’s open, it gives instant insight into context.
If the current session/day/week opens below the higher timeframe’s open, you’re operating in extreme discount.
If it opens above, you’re sitting in extreme premium.
That tells you whether you’re trading from a favorable location or chasing into poor pricing — especially when combined with PSPs, SMT, or Fair Value Gaps.
✨ Why Use True Opens?
True Opens aren’t just lines — they represent where institutions reset the auction. Price respects them across all timeframes. Whether you're scalping NY session or planning a swing entry, these levels help frame the market, highlight where power shifts, and clarify if you're early or late to a move.
⚠️ Caution:
If you find the PSP candle colors aren’t visible or appear behind other chart elements, right-click on the candles, select Visual Order, then choose Send to Back. This will ensure the highlights display properly.
🌠 Thank you for using my indicator. I appreciate your trust and support — wishing you success and clarity in your trading journey.

SMA Backtest Optimizer [Mr_Rakun]The SMA Backtest Optimizer is a powerful Pine Script tool designed to systematically analyze and compare various Simple Moving Average (SMA) periods to identify the most profitable configuration for trading strategies. This indicator tests multiple SMA periods (from 10 to 100) using a crossover strategy where buys occur when price crosses above the SMA and sells when price crosses below it.
Key Features:
Tests 10 different SMA periods to determine optimal settings
Calculates profit/loss based on a defined starting capital
Tracks total profit and number of trades for each period
Visually highlights the best performing SMA on your chart
Displays comprehensive results in an easy-to-read table
Labels the chart with key performance metrics
This code serves as a core framework that traders can customize for their specific needs. You can easily modify the strategy parameters, test different technical indicators, adjust capital settings, or implement more complex entry/exit rules. The optimization methodology can be applied to virtually any trading approach you wish to evaluate.
Feel free to adapt this framework to test your own trading ideas and discover which parameters work best in different market conditions.

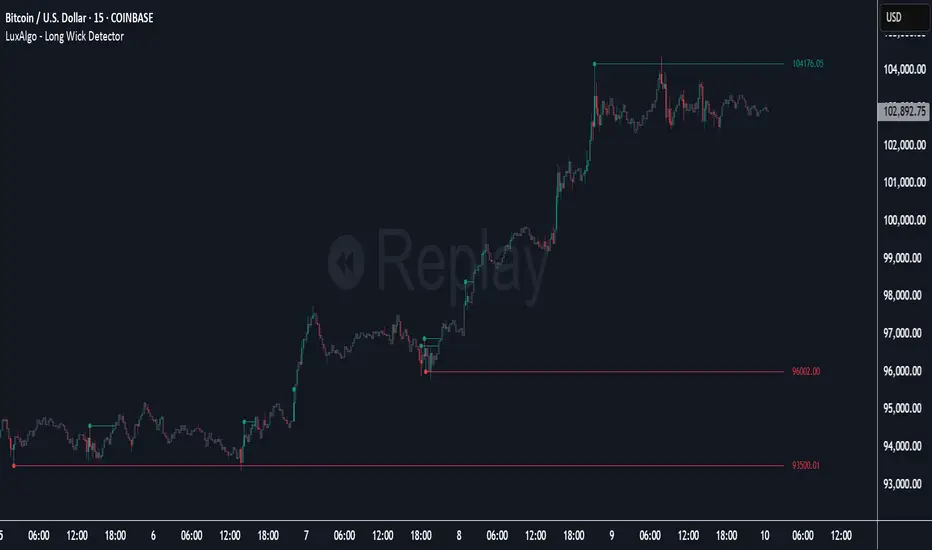
Long Wick Detector [LuxAlgo]The Long Wick Detector tool allows traders to identify candle wicks longer than a user-defined volatility threshold. This makes it useful for spotting zones with high supply or demand.
The tool displays mitigated and unmitigated levels and changes the color of the candles based on wick size and level breakouts.
🔶 USAGE
By default, the tool displays long mitigated and unmitigated candle wicks, with a maximum duration for an unmitigated long wick of 1,000 bars. What does all this mean?
🔹 Wick Threshold
Traders can adjust the volatility threshold to identify long wicks, with a higher threshold detecting more significant wicks.
As we can see in the image above, the tool detects more wicks with a smaller threshold compared to a higher one.
🔹 Level %
Traders can choose the percentage of the wick at which the level is located. By default, the level is displayed at the extremes of the wick. This parameter accepts values between 0 and 100.
100: extreme of the wick
50: middle of the wick
0: start of the wick
🔹 Max Duration
This parameter allows traders to specify the number of bars for the levels. The tool will only display mitigated or unmitigated levels up to the specified number of bars.
As shown in the above image, a longer duration allows more room for mitigation, displaying more levels.
🔹 Colored Candles
The tool allows for color customization using two parameters from the settings panel. The chart shows the different outputs.
The setting "Wick-Based Transparency" makes candles with smaller wicks less visible and candles with longer wicks more visible.
On the other hand, "Breakout-Based Color" changes the base color of the candles based on the mitigation of long wicks. When the price breaks above a detected top wick, the bullish color is used. When the price breaks below a detected bottom wick, the bearish color is used.
🔶 SETTINGS
Wick Threshold: The volatility threshold for wick detection. Use a smaller value to detect smaller wicks.
Level %: Placement of the plotted level relative to the wick.
Max Duration: The maximum duration in bars of mitigated wicks.
Mitigated Wicks: Enable or disable mitigated wicks.
🔹 Style
Wick Based Transparency: Make candles with smaller wicks more transparent and candles with longer wicks more solid.
Breakout Based Color: Change the base color based on wick mitigation.
Bullish & Bearish Colors
Stochastic RSI with Alerts# Stochastic RSI with Alerts - User Manual
## 1. Overview
This enhanced Stochastic RSI indicator identifies overbought/oversold conditions with visual signals and customizable alerts. It features:
- Dual-line Stoch RSI (K & D)
- Threshold-based buy/sell signals
- Configurable alert system
- Customizable parameters
## 2. Installation
1. Open TradingView chart
2. Open Pine Editor (📈 icon at bottom)
3. Copy/paste the full code
4. Click "Add to Chart"
## 3. Input Parameters
### 3.1 Core Settings
| Parameter | Default | Description |
|-----------|---------|-------------|
| K | 3 | Smoothing period for %K line |
| D | 3 | Smoothing period for %D line |
| RSI Length | 14 | RSI calculation period |
| Stochastic Length | 14 | Lookback period for Stoch calculation |
| RSI Source | Close | Price source for RSI calculation |
### 3.2 Signal Thresholds
| Parameter | Default | Description |
|-----------|---------|-------------|
| Upper Limit | 80 | Sell signal threshold (overbought) |
| Lower Limit | 20 | Buy signal threshold (oversold) |
### 3.3 Alert Settings
| Parameter | Default | Description |
|-----------|---------|-------------|
| Enable Buy Alerts | True | Toggle buy notifications |
| Enable Sell Alerts | True | Toggle sell notifications |
| Custom Alert Message | Empty | Additional text for alerts |
## 4. Signal Logic
### 4.1 Buy Signal (Green ▲)
Triggers when:
\text{%K crossover %D} \quad AND \quad (\text{%K ≤ Lower Limit} \quad OR \quad \text{%D ≤ Lower Limit})
### 4.2 Sell Signal (Red ▼)
Triggers when:
\text{%K crossunder %D} \quad AND \quad (\text{%K ≥ Upper Limit} \quad OR \quad \text{%D ≥ Upper Limit})
## 5. Alert System
### 5.1 Auto-Generated Alerts
The script automatically creates these alert conditions:
- **Buy Signal Alert**: Triggers on valid buy signals
- **Sell Signal Alert**: Triggers on valid sell signals
Alert messages include:
- Signal type (Buy/Sell)
- Current %K and %D values
- Custom message (if configured)
### 5.2 Alert Configuration
**Method 1: Script-Generated Alerts**
1. Hover over any signal marker
2. Click the 🔔 icon
3. Select trigger conditions:
- "Buy Signal Alert"
- "Sell Signal Alert"
**Method 2: Manual Setup**
1. Open Alert creation window
2. Condition: Select "Stoch RSI Alerts"
3. Choose:
- "Buy Signal Alert" for long entries
- "Sell Signal Alert" for exits/shorts
## 6. Customization Tips
### 6.1 Threshold Adjustment
// For day trading (tighter ranges)
upperLimit = 75
lowerLimit = 25
// For swing trading (wider ranges)
upperLimit = 85
lowerLimit = 15
### 6.2 Visual Modifications
Change signal markers via:
- `style=` : Try `shape.labelup`, `shape.flag`, etc.
- `color=` : Use hex codes (#FF00FF) or named colors
- `size=` : `size.tiny` to `size.huge`
## 7. Recommended Use Cases
1. **Mean Reversion Strategies**: Pair with support/resistance levels
2. **Trend Confirmation**: Filter with 200EMA direction
3. **Divergence Trading**: Compare with price action
## 8. Limitations
- Works best in ranging markets
- Combine with volume analysis for confirmation
- Not recommended as standalone strategy
---
This documentation follows technical writing best practices with:
- Clear parameter tables
- Mathematical signal logic
- Visual hierarchy
- Practical examples
- Usage recommendations

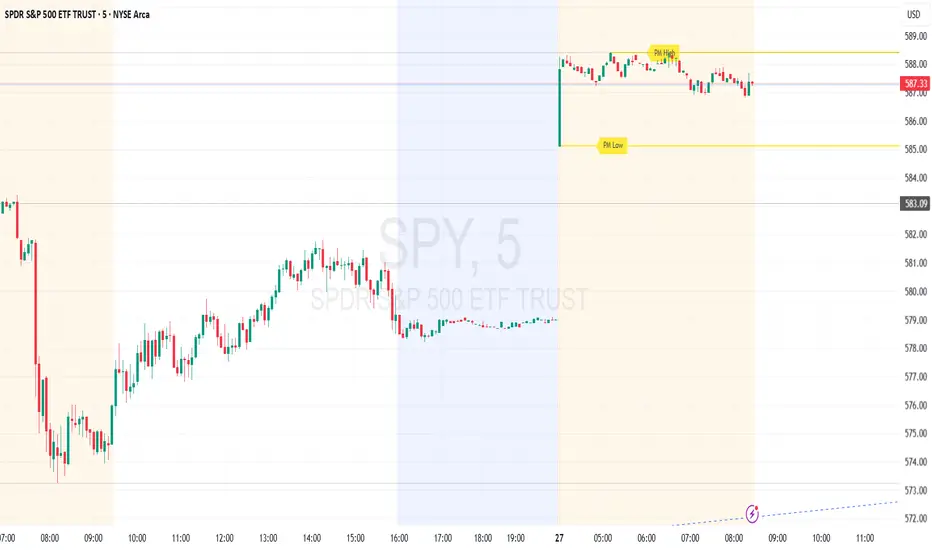
Premarket High/Low (Horizontal Rays)=== Script Description ===
This TradingView script automatically detects and displays the high and low prices
during the premarket session (04:00–09:30 Eastern Time) for the current trading day.
It draws horizontal rays that extend across the chart and labels them as "PM High" and "PM Low".
These markers are refreshed daily and only apply to today's session.
The script also provides full customization for:
- Line color, width, and style (solid, dotted, dashed)
- Label text color, background color, size, and style (left, right, up, down)
Time note: This script assumes data aligned with U.S. market hours.
ZenAlgo - DominatorThis indicator provides a structured multi-ticker overview of market momentum and relative strength by analyzing short-term price behavior across selected assets in comparison with broader crypto dominance and Bitcoin/ETH performance.
Ticker and Market Data Handling
The script accepts up to 9 user-defined symbols (tickers) along with BTCUSD and ETHUSD. For each symbol:
It retrieves the current price.
It also requests the daily opening price from the "D" timeframe to compute intraday percentage change.
For BTC, ETH, and dominance (sum of BTC, USDT, and USDC dominance), daily change is calculated using this same method.
This comparison enables tracking relative performance from the daily open, which provides meaningful insight into intraday strength or weakness among different assets.
Dominance Logic
The indicator aggregates dominance data from BTC , USDT , and USDC using TradingView’s CRYPTOCAP indices. This combined dominance is used as a reference in directional and status calculations. ETH dominance is also analyzed independently.
Changes in dominance are used to infer whether market attention is shifting toward Bitcoin/stablecoins (typically indicating risk-off sentiment) or away from them (typically risk-on behavior, benefiting altcoins).
Price Direction Estimation
The script estimates directional bias using an EMA-based deviation technique:
A short EMA (user-defined lookback , default 4 bars) is calculated.
The current close is compared to the EMA to assess directional bias.
Recent candle changes are also inspected to confirm a consistent short-term trend (e.g., 3 consecutive higher closes for "up").
A small threshold is used to avoid classifying flat movements as trends.
This directionality logic is applied separately to:
The selected ticker's price
BTC price
Combined dominance
This allows the script to contextualize the movement of each asset within broader market conditions.
Market Status Evaluation
A custom function analyzes ETH and BTC dominance trends along with their relative strength to define the overall market regime:
Altseason is identified when BTC dominance is declining, ETH dominance rising, and ETH outperforms BTC.
BTC Season occurs when BTC dominance is rising, ETH dominance falling, and BTC outperforms ETH.
If neither condition is met, the state is Neutral .
This classification is shown alongside each ticker's row in the table and helps traders assess whether market conditions favor Bitcoin, Ethereum, or altcoins in general.
Ticker Status Classification
Each ticker is analyzed independently using the earlier directional logic. Its status is then determined as follows:
Full Bull : Ticker is trending up while dominance is declining or BTC is also rising.
Bullish : Ticker is trending up but not supported by broader bullish context.
Bearish : Ticker is trending down but without broader confirmation.
Full Bear : Ticker is trending down while dominance rises or BTC falls.
Neutral : No strong directional bias or conflicting context.
This classification reflects short-term momentum and macro alignment and is color-coded in the results table.
Table Display and Plotting
A configurable table is shown on the chart, which:
Displays the name and status of each selected ticker.
Optionally includes BTC, ETH, and market state.
Uses color-coding for intuitive interpretation.
Additionally, price changes from the daily open are plotted for each selected ticker, BTC, ETH, and combined dominance. These values are also labeled directly on the chart.
Labeling and UX Enhancements
Labels next to the current candle display price and percent change for each active ticker and for BTC, ETH, and combined dominance.
Labels update each bar, and old labels are deleted to avoid clutter.
Ticker names are dynamically shortened by stripping exchange prefixes.
How to Use This Indicator
This tool helps traders:
Spot early rotations between Bitcoin and altcoins.
Identify intraday momentum leaders or laggards.
Monitor which tickers align with or diverge from broader market trends.
Detect possible sentiment shifts based on dominance trends.
It is best used on lower to mid timeframes (15m–4h) to capture intraday to short-term shifts. Users should cross-reference with longer-term trend tools or structural indicators when making directional decisions.
Interpretation of Values
% Change : Measures intraday move from daily open. Strong positive/negative values may indicate breakouts or reversals.
Status : Describes directional strength relative to market conditions.
Market State : Gives a general bias toward BTC dominance, ETH strength, or altcoin momentum.
Limitations & Considerations
The indicator does not analyze liquidity or volume directly.
All logic is based on short-term movements and may produce false signals in ranging or low-volume environments.
Dominance calculations rely on external CRYPTOCAP indices, which may differ from exchange-specific flows.
Added Value Over Other Free Tools
Unlike basic % change tables or price overlays, this indicator:
Integrates dominance-based macro context into ticker evaluation.
Dynamically classifies market regimes (BTC season / Altseason).
Uses multi-factor logic to determine ticker bias, avoiding single-metric interpretation.
Displays consolidated information in a table and chart overlays for rapid assessment.

MMTools - Catcher❖ Overview
Catcher is a professional trading indicator designed to provide insightful, high-quality purchasing signals to traders, algorithmic traders, and investors. The indicator employs trend-following, momentum, and volatility-based techniques, all integrated into the author's unique and sophisticated strategic framework. This approach ensures that only the highest-performing signals are selected and presented. Unlike the majority of indicators, Catcher seeks to deliver signals against local price movements. Furthermore, the indicator is engineered to adapt to changing market conditions, ensuring its sustained value and relevance.
❖ How The Indicator Works
The objective of Catcher is to detect market movements and signal emerging trends to follow — before the trend loses momentum. Following this phase, the indicator remains inactive during periods of consolidation and low buying interest, resuming only upon detecting indications of a new market movement.
The system is built on a custom market-following algorithm that dynamically adjusts its internal components by analyzing the prevailing trend direction, strength, and volatility. This allows the indicator to identify optimal entry points in changing market conditions. By continuously adapting, Catcher can filter out false signals more effectively than traditional fixed-logic strategies.
❖ Settings
The indicator has simple settings. It allows the addition of signals from up to three other timeframes, with each additional signal increasing in size to facilitate differentiation. However, the selected timeframes must be equal to or higher than the chart’s current timeframe.
⚙️ Exit Signals:
Crosses marked as “+” on the chart represent favorable exit points determined by timeout logic.
Both entries and exits are fully non-repainting, meaning they will not change their locations or disappear once displayed on the chart. Note that they appear at the opening of the bar.
❖ Application
The indicator demonstrates strong performance in trending markets. However, it is advisable to avoid trading during highly volatile, choppy markets. As illustrated in the images below, signals generated in stable, trending environments tend to yield more favorable outcomes compared to those produced in turbulent conditions.
-- Example of Catcher operating during trending market --
-- Example of Catcher operating in a choppy market --
⚡️ It is not necessary to wait for bar closures, as the signals do not repaint once displayed.
Catcher can be used independently or to complement your existing techniques, for instance, by confirming your ideas or identifying precise entry points. The more reliable technical tools you incorporate, the stronger your analysis can become. Here is an example of how Catcher integrates with classical technical analysis:
-- Example of Catcher operating with additional influencing factors --
❖ Conclusion
We believe that dedicated traders can achieve outstanding results by using our tools with commitment and a professional approach. We hope that Catcher offers you a fresh and valuable perspective on trading.
❖ Access
Please refer to the Author's Instructions field to request access to the script.
-----------------------------------------------------------
Disclaimer
The information provided by my scripts is for informational purposes only and does not constitute financial advice. Past performance is not indicative of future results. Always do your own research before making financial decisions.

Ultimate Scalping Tool[BullByte]Overview
The Ultimate Scalping Tool is an open-source TradingView indicator built for scalpers and short-term traders released under the Mozilla Public License 2.0. It uses a custom Quantum Flux Candle (QFC) oscillator to combine multiple market forces into one visual signal. In plain terms, the script reads momentum, trend strength, volatility, and volume together and plots a special “candlestick” each bar (the QFC) that reflects the overall market bias. This unified view makes it easier to spot entries and exits: the tool labels signals as Strong Buy/Sell, Pullback (a brief retracement in a trend), Early Entry, or Exit Warning . It also provides color-coded alerts and a small dashboard of metrics. In practice, traders see green/red oscillator bars and symbols on the chart when conditions align, helping them scalp or trend-follow without reading multiple separate indicators.
Core Components
Quantum Flux Candle (QFC) Construction
The QFC is the heart of the indicator. Rather than using raw price, it creates a candlestick-like bar from the underlying oscillator values. Each QFC bar has an “open,” “high/low,” and “close” derived from calculated momentum and volatility inputs for that period . In effect, this turns the oscillator into intuitive candle patterns so traders can recognize momentum shifts visually. (For comparison, note that Heikin-Ashi candles “have a smoother look because take an average of the movement”. The QFC instead represents exact oscillator readings, so it reflects true momentum changes without hiding price action.) Colors of QFC bars change dynamically (e.g. green for bullish momentum, red for bearish) to highlight shifts. This is the first open-source QFC oscillator that dynamically weights four non-correlated indicators with moving thresholds, which makes it a unique indicator on its own.
Oscillator Normalization & Adaptive Weights
The script normalizes its oscillator to a fixed scale (for example, a 0–100 range much like the RSI) so that various inputs can be compared fairly. It then applies adaptive weighting: the relative influence of trend, momentum, volatility or volume signals is automatically adjusted based on current market conditions. For instance, in very volatile markets the script might weight volatility more heavily, or in a strong trend it might give extra weight to trend direction. Normalizing data and adjusting weights helps keep the QFC sensitive but stable (normalization ensures all inputs fit a common scale).
Trend/Momentum/Volume/Volatility Fusion
Unlike a typical single-factor oscillator, the QFC oscillator fuses four aspects at once. It may compute, for example, a trend indicator (such as an ADX or moving average slope), a momentum measure (like RSI or Rate-of-Change), a volume-based pressure (similar to MFI/OBV), and a volatility measure (like ATR) . These different values are combined into one composite oscillator. This “multi-dimensional” approach follows best practices of using non-correlated indicators (trend, momentum, volume, volatility) for confirmation. By encoding all these signals in one line, a high QFC reading means that trend, momentum, and volume are all aligned, whereas a neutral reading might mean mixed conditions. This gives traders a comprehensive picture of market strength.
Signal Classification
The script interprets the QFC oscillator to label trades. For example:
• Strong Buy/Sell : Triggered when the oscillator crosses a high-confidence threshold (e.g. breaks clearly above zero with strong slope), indicating a well-confirmed move. This is like seeing a big green/red QFC candle aligned with the trend.
• Pullbacks : Identified when the trend is up but momentum dips briefly. A Pullback Buy appears if the overall trend is bullish but the oscillator has a short retracement – a typical buying opportunity in an uptrend. (A pullback is “a brief decline or pause in a generally upward price trend”.)
• Early Buy/Sell : Marks an initial swing in the oscillator suggesting a possible new trend, before it is fully confirmed. It’s a hint of momentum building (an early-warning signal), not as strong as the confirmed “Strong” signal.
• Exit Warnings : Issued when momentum peaks or reverses. For instance, if the QFC bars reach a high and start turning red/green opposite, the indicator warns that the move may be ending. In other words, a Momentum Peak is the point of maximum strength after which weakness may follow.
These categories correspond to typical trading concepts: Pullback (temporary reversal in an uptrend), Early Buy (an initial bullish cross), Strong Buy (confirmed bullish momentum), and Momentum Peak (peak oscillator value suggesting exhaustion).
Filters (DI Reversal, Dynamic Thresholds, HTF EMA/ADX)
Extra filters help avoid bad trades. A DI Reversal filter uses the +DI/–DI lines (from the ADX system) to require that the trend direction confirms the signal . For example, it might ignore a buy signal if the +DI is still below –DI. Dynamic Thresholds adjust signal levels on-the-fly: rather than fixed “overbought” lines, they move with volatility so signals happen under appropriate market stress. An optional High-Timeframe EMA or ADX filter adds a check against a larger timeframe trend: for instance, only taking a trade if price is above the weekly EMA or if weekly ADX shows a strong trend. (Notably, the ADX is “a technical indicator used by traders to determine the strength of a price trend”, so requiring a high-timeframe ADX avoids trading against the bigger trend.)
Dashboard Metrics & Color Logic
The Dashboard in the Ultimate Scalping Tool (UST) serves as a centralized information hub, providing traders with real-time insights into market conditions, trend strength, momentum, volume pressure, and trade signals. It is highly customizable, allowing users to adjust its appearance and content based on their preferences.
1. Dashboard Layout & Customization
Short vs. Extended Mode : Users can toggle between a compact view (9 rows) and an extended view (13 rows) via the `Short Dashboard` input.
Text Size Options : The dashboard supports three text sizes— Tiny, Small, and Normal —adjustable via the `Dashboard Text Size` input.
Positioning : The dashboard is positioned in the top-right corner by default but can be moved if modified in the script.
2. Key Metrics Displayed
The dashboard presents critical trading metrics in a structured table format:
Trend (TF) : Indicates the current trend direction (Strong Bullish, Moderate Bullish, Sideways, Moderate Bearish, Strong Bearish) based on normalized trend strength (normTrend) .
Momentum (TF) : Displays momentum status (Strong Bullish/Bearish or Neutral) derived from the oscillator's position relative to dynamic thresholds.
Volume (CMF) : Shows buying/selling pressure levels (Very High Buying, High Selling, Neutral, etc.) based on the Chaikin Money Flow (CMF) indicator.
Basic & Advanced Signals:
Basic Signal : Provides simple trade signals (Strong Buy, Strong Sell, Pullback Buy, Pullback Sell, No Trade).
Advanced Signal : Offers nuanced signals (Early Buy/Sell, Momentum Peak, Weakening Momentum, etc.) with color-coded alerts.
RSI : Displays the Relative Strength Index (RSI) value, colored based on overbought (>70), oversold (<30), or neutral conditions.
HTF Filter : Indicates the higher timeframe trend status (Bullish, Bearish, Neutral) when using the Leading HTF Filter.
VWAP : Shows the V olume-Weighted Average Price and whether the current price is above (bullish) or below (bearish) it.
ADX : Displays the Average Directional Index (ADX) value, with color highlighting whether it is rising (green) or falling (red).
Market Mode : Shows the selected market type (Crypto, Stocks, Options, Forex, Custom).
Regime : Indicates volatility conditions (High, Low, Moderate) based on the **ATR ratio**.
3. Filters Status Panel
A secondary panel displays the status of active filters, helping traders quickly assess which conditions are influencing signals:
- DI Reversal Filter: On/Off (confirms reversals before generating signals).
- Dynamic Thresholds: On/Off (adjusts buy/sell thresholds based on volatility).
- Adaptive Weighting: On/Off (auto-adjusts oscillator weights for trend/momentum/volatility).
- Early Signal: On/Off (enables early momentum-based signals).
- Leading HTF Filter: On/Off (applies higher timeframe trend confirmation).
4. Visual Enhancements
Color-Coded Cells : Each metric is color-coded (green for bullish, red for bearish, gray for neutral) for quick interpretation.
Dynamic Background : The dashboard background adapts to market conditions (bullish/bearish/neutral) based on ADX and DI trends.
Customizable Reference Lines : Users can enable/disable fixed reference lines for the oscillator.
How It(QFC) Differs from Traditional Indicators
Quantum Flux Candle (QFC) Versus Heikin-Ashi
Heikin-Ashi candles smooth price by averaging (HA’s open/close use averages) so they show trend clearly but hide true price (the current HA bar’s close is not the real price). QFC candles are different: they are oscillator values, not price averages . A Heikin-Ashi chart “has a smoother look because it is essentially taking an average of the movement”, which can cause lag. The QFC instead shows the raw combined momentum each bar, allowing faster recognition of shifts. In short, HA is a smoothed price chart; QFC is a momentum-based chart.
Versus Standard Oscillators
Common oscillators like RSI or MACD use fixed formulas on price (or price+volume). For example, RSI “compares gains and losses and normalizes this value on a scale from 0 to 100”, reflecting pure price momentum. MFI is similar but adds volume. These indicators each show one dimension: momentum or volume. The Ultimate Scalping Tool’s QFC goes further by integrating trend strength and volatility too. In practice, this means a move that looks strong on RSI might be downplayed by low volume or weak trend in QFC. As one source notes, using multiple non-correlated indicators (trend, momentum, volume, volatility) provides a more complete market picture. The QFC’s multi-factor fusion is unique – it is effectively a multi-dimensional oscillator rather than a traditional single-input one.
Signal Style
Traditional oscillators often use crossovers (RSI crossing 50) or fixed zones (MACD above zero) for signals. The Ultimate Scalping Tool’s signals are custom-classified: it explicitly labels pullbacks, early entries, and strong moves. These terms go beyond a typical indicator’s generic “buy”/“sell.” In other words, it packages a strategy around the oscillator, which traders can backtest or observe without reading code.
Key Term Definitions
• Pullback : A short-term dip or consolidation in an uptrend. In this script, a Pullback Buy appears when price is generally rising but shows a brief retracement. (As defined by Investopedia, a pullback is “a brief decline or pause in a generally upward price trend”.)
• Early Buy/Sell : An initial or tentative entry signal. It means the oscillator first starts turning positive (or negative) before a full trend has developed. It’s an early indication that a trend might be starting.
• Strong Buy/Sell : A confident entry signal when multiple conditions align. This label is used when momentum is already strong and confirmed by trend/volume filters, offering a higher-probability trade.
• Momentum Peak : The point where bullish (or bearish) momentum reaches its maximum before weakening. When the oscillator value stops rising (or falling) and begins to reverse, the script flags it as a peak – signaling that the current move could be overextended.
What is the Flux MA?
The Flux MA (Moving Average) is an Exponential Moving Average (EMA) applied to a normalized oscillator, referred to as FM . Its purpose is to smooth out the fluctuations of the oscillator, providing a clearer picture of the underlying trend direction and strength. Think of it as a dynamic baseline that the oscillator moves above or below, helping you determine whether the market is trending bullish or bearish.
How it’s calculated (Flux MA):
1.The oscillator is normalized (scaled to a range, typically between 0 and 1, using a default scale factor of 100.0).
2.An EMA is applied to this normalized value (FM) over a user-defined period (default is 10 periods).
3.The result is rescaled back to the oscillator’s original range for plotting.
Why it matters : The Flux MA acts like a support or resistance level for the oscillator, making it easier to spot trend shifts.
Color of the Flux Candle
The Quantum Flux Candle visualizes the normalized oscillator (FM) as candlesticks, with colors that indicate specific market conditions based on the relationship between the FM and the Flux MA. Here’s what each color means:
• Green : The FM is above the Flux MA, signaling bullish momentum. This suggests the market is trending upward.
• Red : The FM is below the Flux MA, signaling bearish momentum. This suggests the market is trending downward.
• Yellow : Indicates strong buy conditions (e.g., a "Strong Buy" signal combined with a positive trend). This is a high-confidence signal to go long.
• Purple : Indicates strong sell conditions (e.g., a "Strong Sell" signal combined with a negative trend). This is a high-confidence signal to go short.
The candle mode shows the oscillator’s open, high, low, and close values for each period, similar to price candlesticks, but it’s the color that provides the quick visual cue for trading decisions.
How to Trade the Flux MA with Respect to the Candle
Trading with the Flux MA and Quantum Flux Candle involves using the MA as a trend indicator and the candle colors as entry and exit signals. Here’s a step-by-step guide:
1. Identify the Trend Direction
• Bullish Trend : The Flux Candle is green and positioned above the Flux MA. This indicates upward momentum.
• Bearish Trend : The Flux Candle is red and positioned below the Flux MA. This indicates downward momentum.
The Flux MA serves as the reference line—candles above it suggest buying pressure, while candles below it suggest selling pressure.
2. Interpret Candle Colors for Trade Signals
• Green Candle : General bullish momentum. Consider entering or holding a long position.
• Red Candle : General bearish momentum. Consider entering or holding a short position.
• Yellow Candle : A strong buy signal. This is an ideal time to enter a long trade.
• Purple Candle : A strong sell signal. This is an ideal time to enter a short trade.
3. Enter Trades Based on Crossovers and Colors
• Long Entry : Enter a buy position when the Flux Candle turns green and crosses above the Flux MA. If it turns yellow, this is an even stronger signal to go long.
• Short Entry : Enter a sell position when the Flux Candle turns red and crosses below the Flux MA. If it turns purple, this is an even stronger signal to go short.
4. Exit Trades
• Exit Long : Close your buy position when the Flux Candle turns red or crosses below the Flux MA, indicating the bullish trend may be reversing.
• Exit Short : Close your sell position when the Flux Candle turns green or crosses above the Flux MA, indicating the bearish trend may be reversing.
•You might also exit a long trade if the candle changes from yellow to green (weakening strong buy signal) or a short trade from purple to red (weakening strong sell signal).
5. Use Additional Confirmation
To avoid false signals, combine the Flux MA and candle signals with other indicators or dashboard metrics (e.g., trend strength, momentum, or volume pressure). For example:
•A yellow candle with a " Strong Bullish " trend and high buying volume is a robust long signal.
•A red candle with a " Moderate Bearish " trend and neutral momentum might need more confirmation before shorting.
Practical Example
Imagine you’re scalping a cryptocurrency:
• Long Trade : The Flux Candle turns yellow and is above the Flux MA, with the dashboard showing "Strong Buy" and high buying volume. You enter a long position. You exit when the candle turns red and dips below the Flux MA.
• Short Trade : The Flux Candle turns purple and crosses below the Flux MA, with a "Strong Sell" signal on the dashboard. You enter a short position. You exit when the candle turns green and crosses above the Flux MA.
Market Presets and Adaptation
This indicator is designed to work on any market with candlestick price data (stocks, crypto, forex, indices, etc.). To handle different behavior, it provides presets for major asset classes. Selecting a “Stocks,” “Crypto,” “Forex,” or “Options” preset automatically loads a set of parameter values optimized for that market . For example, a crypto preset might use a shorter lookback or higher sensitivity to account for crypto’s high volatility, while a stocks preset might use slightly longer smoothing since stocks often trend more slowly. In practice, this means the same core QFC logic applies across markets, but the thresholds and smoothing adjust so signals remain relevant for each asset type.
Usage Guidelines
• Recommended Timeframes : Optimized for 1 minute to 15 minute intraday charts. Can also be used on higher timeframes for short term swings.
• Market Types : Select “Crypto,” “Stocks,” “Forex,” or “Options” to auto tune periods, thresholds and weights. Use “Custom” to manually adjust all inputs.
• Interpreting Signals : Always confirm a signal by checking that trend, volume, and VWAP agree on the dashboard. A green “Strong Buy” arrow with green trend, green volume, and price > VWAP is highest probability.
• Adjusting Sensitivity : To reduce false signals in fast markets, enable DI Reversal Confirmation and Dynamic Thresholds. For more frequent entries in trending environments, enable Early Entry Trigger.
• Risk Management : This tool does not plot stop loss or take profit levels. Users should define their own risk parameters based on support/resistance or volatility bands.
Background Shading
To give you an at-a-glance sense of market regime without reading numbers, the indicator automatically tints the chart background in three modes—neutral, bullish and bearish—with two levels of intensity (light vs. dark):
Neutral (Gray)
When ADX is below 20 the market is considered “no trend” or too weak to trade. The background fills with a light gray (high transparency) so you know to sit on your hands.
Bullish (Green)
As soon as ADX rises above 20 and +DI exceeds –DI, the background turns a semi-transparent green, signaling an emerging uptrend. When ADX climbs above 30 (strong trend), the green becomes more opaque—reminding you that trend-following signals (Strong Buy, Pullback) carry extra weight.
Bearish (Red)
Similarly, if –DI exceeds +DI with ADX >20, you get a light red tint for a developing downtrend, and a darker, more solid red once ADX surpasses 30.
By dynamically varying both hue (green vs. red vs. gray) and opacity (light vs. dark), the background instantly communicates trend strength and direction—so you always know whether to favor breakout-style entries (in a strong trend) or stay flat during choppy, low-ADX conditions.
The setup shown in the above chart snapshot is BTCUSD 15 min chart : Binance for reference.
Disclaimer
No indicator guarantees profits. Backtest or paper trade this tool to understand its behavior in your market. Always use proper position sizing and stop loss orders.
Good luck!
- BullByte

AxisAxis Indicator: Dynamic Trend Lines & Support/Resistance with Trading Mode Presets
Overview
The Axis indicator is a powerful, all-in-one tool for traders, designed to identify key trend lines and support/resistance (S&R) levels across various trading strategies. With 11 predefined trading modes—Scalping, Day Trading, Swing Trading, Long-Term, Position Trading, Breakout Trading, Mean Reversion, Trend Following, Range Trading, Volatility Trading, and Counter-Trend Trading—Axis adapts to your trading style by automatically adjusting parameters like volume Moving Average (MA) periods, fractal lookbacks, and alert proximity. Built-in timeframe validation ensures you’re using the optimal chart timeframe for your selected mode, with a warning label displayed if the timeframe is unsuitable. Whether you’re a scalper chasing quick moves or a position trader eyeing long-term trends, Axis provides precise, volume-filtered signals to enhance your trading decisions.
How It Works
Axis plots two sets of trend lines (A and B) and two sets of S&R levels (A and B) on your chart, each tailored to the selected trading mode:
Trend Lines (A & B): Identifies uptrend and downtrend lines using pivot highs/lows with mode-specific lookback periods. Lines are drawn only when volume exceeds the mode’s volume MA, ensuring high-probability signals.
Support/Resistance (A & B): Plots horizontal S&R levels based on pivot highs/lows, filtered by volume to highlight significant price levels.
Volume MA: Uses a mode-specific MA type (SMA, EMA, WMA, HMA, or VWMA) to validate pivots. MA periods are scaled by timeframe (e.g., 1m, 1h, Daily) and capped at 5,000 candles to prevent errors.
Timeframe Validation: Checks if the chart’s timeframe matches the mode’s recommended range (e.g., 5m–1h for Volatility Trading). If not, a yellow warning label appears (e.g., “Timeframe may not suit Scalping”).
Alerts: Triggers alerts for new trend lines, S&R levels, and price crosses, allowing real-time trade monitoring.
Trading Modes & Recommended Timeframes
Each mode is preconfigured with optimized settings for specific strategies and timeframes:
Scalping (1m–15m): Fast signals with short lookbacks (1–3 bars) and tight alerts (0.2%) for intraday scalps.
Day Trading (15m–1h): Intraday focus with moderate lookbacks (2–4 bars) and 0.3% alert proximity.
Swing Trading (1h–4h): Multi-day/week trades with balanced settings (2–5 bars, 0.5% alerts).
Long-Term (Daily–Weekly): Major trends with longer lookbacks (3–7 bars, 1.0% alerts).
Position Trading (Weekly–Monthly): Long-term moves with robust settings (4–20 bars, 1.5% alerts).
Breakout Trading (30m–4h): Detects breakouts with sensitive settings (1–4 bars, 0.25% alerts).
Mean Reversion (1h–Daily): Targets reversals with moderate settings (3–8 bars, 0.7% alerts).
Trend Following (4h–Weekly): Captures trends with longer lookbacks (4–18 bars, 1.2% alerts).
Range Trading (1h–4h): Optimized for consolidation with balanced settings (2–6 bars, 0.4% alerts).
Volatility Trading (5m–1h): High-volatility markets with ultra-sensitive settings (1–2 bars, 0.15% alerts).
Counter-Trend Trading (4h–Daily): Contrarian reversals with robust settings (3–9 bars, 0.9% alerts).
Key Features
11 Trading Modes: Preconfigured settings for diverse strategies, eliminating manual tuning.
Dynamic Volume MA: Supports SMA, EMA, WMA, HMA, and VWMA, scaled by timeframe for accuracy.
Timeframe Validation: Warns if the chart timeframe doesn’t suit the mode, preventing suboptimal setups.
Customizable Visuals: Adjust line widths and colors for trend lines and S&R levels.
Comprehensive Alerts: Alerts for new trend lines, S&R levels, and price crosses, integrable with TradingView’s alert system.
Performance Optimized: MA periods capped at 5,000 candles to avoid errors and ensure smooth operation.
How to Use
Add to Chart: Apply the Axis indicator to your TradingView chart.
Select Trading Mode: Choose a mode from the “Trading Mode” dropdown in the indicator settings (e.g., Volatility Trading for crypto on 5m).
Check Timeframe: Ensure your chart’s timeframe matches the mode’s recommended range (e.g., 5m–1h for Volatility Trading). A yellow warning label appears if the timeframe is unsuitable.
Customize Visuals: Adjust line widths and colors for trend lines (A & B) and S&R (A & B) in the settings.
Set Alerts: Create alerts for new trend lines, S&R levels, or price crosses via TradingView’s alert menu.
Trade Signals:
Trend Lines: Use uptrend/downtrend lines for trend confirmation or breakout setups.
S&R Levels: Trade bounces or breaks at support/resistance, confirmed by volume.
Alerts: Act on price cross alerts for entries/exits based on your strategy.
Tips for Best Results
Match Timeframe to Mode: Stick to recommended timeframes (e.g., 1h–4h for Swing Trading) to maximize signal accuracy. Heed warning labels for timeframe mismatches.
Test Across Assets: Volatility Trading shines in crypto during news events, while Range Trading suits forex/stocks in consolidation.
Backtest Strategies: Convert Axis to a strategy (e.g., enter on S&R cross, exit after X bars) to validate performance.
Optimize for Performance: If lag occurs on low timeframes, reduce the MA cap to 2,500 (edit math.min(..., 2500) in the code).
Combine with Other Tools: Pair Axis with indicators like RSI or MACD for confluence.
Why Choose Axis?
Axis simplifies technical analysis by offering a single indicator that adapts to your trading style. Its mode-based presets, volume-filtered signals, and timeframe validation make it ideal for traders of all levels, from scalpers to long-term investors. Whether you’re trading crypto, forex, or stocks, Axis delivers actionable insights with minimal setup.
Feedback & Support
If you have questions, suggestions, or need help customizing Axis, feel free to comment or contact me via TradingView. Your feedback helps improve the indicator for the community!

MARibbonMARibbon インジケーターについて
この「MARibbon」は、3本の移動平均線(MA1、MA2、MA3)を描画し、特にMA2とMA3の関係性に注目して、背景色でトレンドの強弱や転換のサインを視覚的に分かりやすく表示するインジケーターです。
主な特徴
3種類の移動平均線を表示可能
MA1(白色、期間40、太さ2)
MA2(水色、期間200、太さ4)
MA3(ピンク色、期間800、太さ4)
各MAの期間・種類(SMA、EMA、WMA、RMA)・タイムフレームは自由に設定可能。
MA2とMA3の関係性に応じて、チャート背景に色付きのリボン(帯)を表示。
背景リボンの意味
MA2 > MA3(ゴールデンクロス状況)
→ 背景を薄い緑色にして、上昇トレンドの可能性を示唆。
MA3 > MA2(デッドクロス状況)
→ 背景を薄い赤色にして、下降トレンドの可能性を示唆。
それ以外(等しい場合など)は背景色なし(透明)で表示。
入力可能な設定
各移動平均線の期間
各移動平均線の種類(SMA、EMA、WMA、RMA)
各移動平均線のタイムフレーム(デフォルトはチャートと同じ)
使い方
任意の銘柄・時間足のチャートにインジケーターを適用。
必要に応じて、3本の移動平均の期間・種類・時間足を調整。
MA2とMA3の位置関係によって、チャート背景の色が変わり、トレンドの強弱を直感的に把握可能。
MARibbon is a custom indicator that plots three moving averages (MA1, MA2, MA3) and visually fills the space between MA2 and MA3 with color bands to indicate trend strength and direction.
Each MA supports custom type (SMA / EMA / WMA / RMA), length, and timeframe.
A green band appears when MA2 is above MA3.
A red band appears when MA3 is above MA2.
This clean and minimal design helps traders easily visualize overlapping trends and potential crossovers.
💡 Use Cases:
Visually confirm confluence of long- and short-term trends
Identify ribbon-like zones of trend strength
Support for MA cross strategy analysis

YB Academy SNRThe YB Academy SNR indicator is a complete swing-based Support & Resistance mapping tool with powerful built-in entry/exit signals. Designed for traders who want to identify high-probability reaction zones and get real-time alerts for the best buy and sell opportunities, this script helps you trade with structure, confidence, and discipline—on any time frame.
How It Works
1. Automatic Support & Resistance Detection
The indicator automatically scans for major swing highs and swing lows on your chart using a sensitivity parameter.
Every time a new swing high/low forms, a horizontal SNR line is drawn at that price level.
Both support and resistance lines automatically extend to the right of your chart, providing a persistent map of key levels for future entries and exits.
You can control how many recent zones are shown (max_snrs), keeping your chart clean and focused.
2. Smart Buy/Sell Signal Generation
Buy signals (“YB Buy”): Trigger when price touches or bounces off a support line, with trend/momentum/freshness filters:
Price is above the EMA50 (trend filter)
MACD is bullish (momentum)
RSI confirms no overbought
Sell signals (“YB Sell”): Trigger when price hits resistance, with strict confirmation:
Price is below EMA50
MACD is bearish
RSI not oversold
Both signals are shown as clear up/down triangle arrows directly on your chart.
3. Powerful Alerts
Never miss a trade: Real-time alerts fire as soon as a valid buy or sell condition appears.
Use with TradingView app, web, or SMS for 24/7 notification—no chart-watching needed.
4. Fully Customizable
Change sensitivity for tighter/looser SNR mapping.
Control the look and feel: colors for SNR, signals, number of zones, extension distance.
Works on any market: gold, forex, indices, crypto, stocks.
5. Clean Visuals, Zero Clutter
SNR lines are automatically managed—older zones are removed as new ones appear.
Only the latest/best buy/sell signals are shown, so you can act quickly and decisively.
Perfect For:
Scalpers, Day Traders, Swing Traders
Anyone who wants to trade using clean price action levels, NOT lagging indicators
Traders looking for rule-based, mechanical entries and exits
What Makes This Unique?
Precision: Uses swing structure, not arbitrary pivots or moving averages, for SNR.
Multi-Filter Entries: Combines trend, momentum, and overbought/oversold logic for high-probability signals.
Alerts & Automation: Built-in, with no need for manual chart watching.
Simple to Use: Add to any TradingView chart, adjust settings, and go.
Upgrade your trading with the YB Academy SNR!
Get alerted to the real opportunities—right at the key price zones, with all the discipline of a professional.
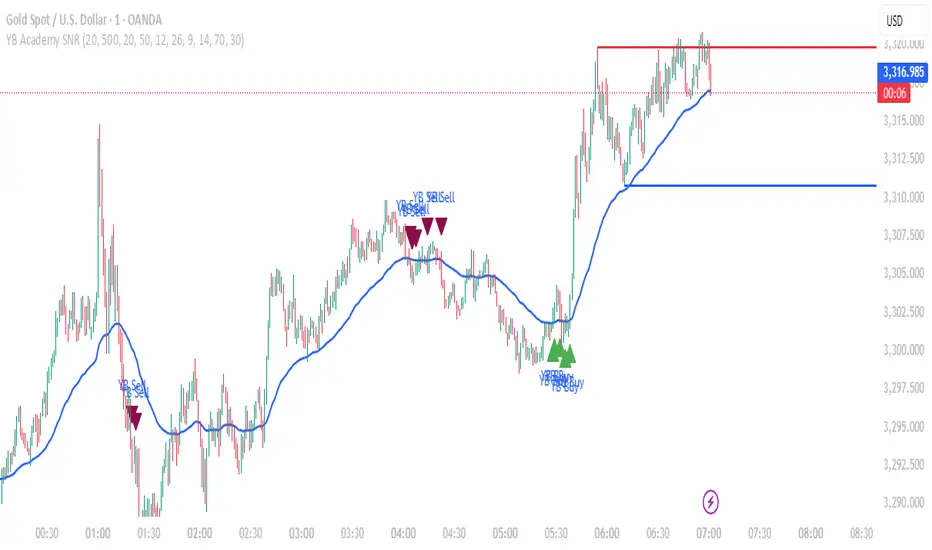
StochRSI Context EngineThe StochRSI Context Engine is a premium, logic-driven indicator built to provide comprehensive intraday momentum context using multi-timeframe Stochastic RSI analysis. Rather than issuing direct buy or sell signals, the tool is designed to give traders enhanced clarity on trend posture, overbought/oversold conditions, volatility states, and potential momentum reversals. It combines multiple layers of signal processing to deliver an intelligent overview of market conditions in real time.
What it does:
The indicator performs a multi-timeframe evaluation of the Stochastic RSI, sampling values from four customizable timeframes (default: 5m, 15m, 1h, 4h). These values are blended and processed through a series of analytical engines to provide the following:
1. StochRSI Multi-Timeframe Engine
* Computes a smoothed Stochastic RSI value on each selected timeframe.
* Applies user-defined smoothing (SMA, EMA, RMA, or WMA).
* Aggregates these into an average (sRSIavg) for further analysis.
2. Trend and Volatility Engine
* Uses EMA stacking logic (8, 21, 50) to determine directional alignment.
* Calculates linear regression slope for directional bias.
* Assesses volatility using ATR relative to price.
* Derives a trendScore based on EMA alignment, price position, and slope strength.
3. Bias and Slope Analysis
* Measures fast/slow EMA slope differentials to detect bias direction and strength.
* Computes slope deltas and volatility-weighted stacking to score bias conditions.
* Outputs a classification such as strong bullish, moderate bearish, or neutral.
4. Dynamic OB/OS Zone Detection
* Adapts overbought and oversold thresholds based on volatility and trend regime.
* Adjusts the zone boundaries if in a trending or high-volatility environment.
5. Microzone Proximity Detection
* Tracks whether the average StochRSI is approaching key OB/OS thresholds.
* Flags conditions like “Near Overbought,” “Near Oversold,” or “Mid Range.”
6. Velocity and Acceleration Detection
* Measures how quickly StochRSI values are changing.
* Uses delta calculations to gauge the momentum’s thrust or decay.
* Classifies shifts in RSI movement (e.g., flat, slow, fast, or thrusting).
7. Range Expansion / Compression Engine
* Evaluates whether StochRSI values across timeframes are diverging or compressing.
* Identifies regime changes in momentum coherence.
8. Momentum Scoring System
* Calculates a composite score based on bias, slope strength, volatility, and range.
* Labels momentum phases from dormant to full-throttle.
9. Confluence Detection
* Tallies how many of the 4 timeframes are currently overbought or oversold.
* High confluence increases the probability of valid reversal or continuation zones.
10. Support and Resistance Zone Memory
* Tracks and plots previous areas where StochRSI bounced or rejected near zones.
* Stores and updates these zones over time, acting as momentum-based S/R levels.
* Includes a proximity check to cluster zones that are close in value.
11. Divergence Detection Engine
* Detects classic bullish or bearish divergence between price and the aggregated StochRSI.
* Draws lines to show divergence structure and triggers real-time alerts.
12. Smart Background Highlighting
* Shades the background based on whether current StochRSI is in an overbought, oversold, or
neutral zone.
13. Real-Time Dashboard
* Displays trend, bias, confluence count, velocity, divergence state, momentum score, and
more.
* Dynamically updates and is optimized for top-right screen positioning with compact
formatting.
14. Smart Alerts
* Issues alerts for divergence detection and high-confluence reversal conditions.
15. Real-Time Labels on Curves
* Shows the selected timeframes alongside each plotted StochRSI line to clarify source data.
What it’s based on:
* Stochastic RSI as the core input signal, providing normalized momentum across timeframes.
* EMA stacking logic, adapted from institutional trend-following models.
* Volatility normalization using ATR to adapt thresholds in high vs. low volatility environments.
* Slope forecasting using linear regression to infer directional conviction.
* Bias analysis modeled on a composite of EMA distance, alignment, and directional thrust.
* Support/resistance zone memory derived from repeated interaction with dynamic OB/OS thresholds.
* Divergence logic based on localized price and oscillator peaks/troughs.
* Multi-factor confidence scoring, aggregating up to 6 inputs to rate market clarity.
This script is for educational and informational purposes only. It does not generate trade signals or provide financial advice. It is not intended to be used as a standalone system for trading or investment decisions. Use at your own discretion. Always confirm with your broader strategy and risk management practices.

Simple Buy/Sell SignalsThe code works by continuously monitoring the relationship between two moving averages (MAs) on live price data — a fast MA (shorter period) and a slow MA (longer period). These MAs smooth out price action to help identify trends. Here's how it functions step-by-step:
Inputs: The user selects the MA type (SMA or EMA) and the lengths (periods) for the fast and slow MAs.
Calculation: The script calculates the chosen MAs using real-time closing prices.
Signal Logic: It detects a Buy signal when the fast MA crosses above the slow MA (crossover) and a Sell signal when the fast MA crosses below the slow MA (crossunder).
Plotting: When a signal occurs, the script plots a green "BUY" arrow below the candle or a red "SELL" arrow above it.
Alerts: It includes alert conditions so users can receive notifications when a buy or sell condition is met.

Feigenbaum Projection Zones [ALLDYN]🔷 Feigenbaum Projection Zones
This tool visualizes non-overlapping projection zones above and below a manually defined price range (C.E. – Center Equilibrium) using Feigenbaum constants as spacing multipliers. It’s ideal for traders who prefer structured, mathematically grounded projection layers over standard Fibonacci tools.
📌 Features:
Manual high/low range input (C.E. zone)
Feigenbaum-based zone scaling with interleaved gaps
Color-coded zones (🟥 below CE, 🟩 above CE, 🟨 CE range)
Dotted midlines through each zone
Timeframe-restricted to 15m and below for clarity
Clean label/box/line management for minimal clutter
🔒 Source code is protected to preserve custom zone spacing logic.
🧠 Designed for advanced technical analysts who want mathematical projection zones based on deterministic scaling constants.
🔍 Feigenbaum Projections: Overview
Feigenbaum Projections are derived from chaos theory, specifically Mitchell Feigenbaum’s work on bifurcations and the universality of nonlinear systems. In market terms, they attempt to map fractal or recursive structures in price movements, especially those that might echo repeating patterns in chaotic systems.
✅ Benefits:
Captures fractal and nonlinear dynamics better than Fibonacci.
Self-similarity and scaling laws can offer insights into repeating structures not seen with classical tools.
Can help model transitions between trend and consolidation through bifurcation patterns.
Tied to mathematical constants (Feigenbaum constants), offering theoretical rigor in modeling chaotic price movement.
***Compact chart view to show the full range of the FGBZ Calculations***

wma+ tendance🟢 Wma+ tendance– Trend Ribbon with Weighted Moving Averages and Alerts
Description:
Wma+ tendance is a visual trend indicator that uses two Weighted Moving Averages (WMA) – a fast and a slow one – to clearly highlight market direction. It fills the space between the two WMAs with dynamic colors and includes alerts for trend changes.
🟩 Green: Uptrend – the fast WMA is above the slow WMA, and both are rising.
🟥 Red: Downtrend – the fast WMA is below the slow WMA, and both are falling.
⬜ Gray: No clear trend – indicating potential sideways or consolidating price action.
Features:
Trend ribbon visualized between fast and slow WMAs
Alerts for bullish and bearish trend detection
Customizable inputs for MA lengths and price source
Use cases:
Spot early trend formations
Combine with other indicators for confirmation
Adaptable for intraday and swing trading strategies
This script helps traders stay on the right side of the trend with minimal noise and real-time alerts.

Ichimoku Cloud Breakout Only LongThis is a very simple trading strategy based exclusively on the Ichimoku Cloud. There are no additional indicators or complex rules involved. The key condition is that we only open long positions when the price is clearly above the cloud — indicating a bullish trend.
For optimal results, the recommended timeframes are 1D (daily) or 1W (weekly) charts. These higher timeframes help filter out market noise and provide more reliable trend signals.
We do not short the market under any circumstances. The focus is purely on riding upward momentum when the price breaks out or stays above the cloud.
This strategy works best when applied to growth stocks with strong upward trends and good fundamentals — such as Google (GOOGL), Tesla (TSLA), Apple (AAPL), or NVIDIA (NVDA).
