Angular VolatilityAngular Volatility is a technical indicator developed to analyze the relationship between volume and direction using the real angle of a customizable moving average. Rather than focusing solely on price or raw volume, this system measures market energy as the product of volume and angle, helping to identify zones of acceleration, pause, or potential reversal.
🔹 Key features:
- Angular Volatility Index (angle × volume) with visual intensity coding.
- Angular oscillator bounded between ±90°, showing the real slope of the selected moving average.
- Intensity classification across four levels: moderate, elevated, high, and extreme.
- Optional candle coloring on the main chart based on detected intensity.
- Real-time info table with live values of the angle and volatility index.
- Full customization: moving average type, smoothing parameters, angle threshold, sensitivity, and colors.
- Built-in alert system with five automatic trigger conditions.
📌 This script was originally conceived as part of a larger system still in development. However, its autonomous logic and visual clarity allowed it to stand on its own as a practical, independent analytical tool.
⚠️ Compatibility: Works exclusively on the Binance platform and only on the following timeframes: 1m, 5m, 15m, 30m, 1h, 4h, and 1D. Using unsupported intervals or platforms will trigger a compatibility warning.
Author’s Instructions
- If you would like to access the complete user manual, feel free to request it via the script comments or through TradingView’s supported contact channels.
(Available in both English and Spanish.)
- The default chart image shown when loading this script includes:
• Four scenarios marked with labeled ovals (A, B, C, D)
• Key support and resistance zones
• Candles painted by volatility intensity
• A data table in the lower-right corner (highlighted with a yellow arrow)
• Two distinct arrows: one indicating price direction, the other pointing to the technical table.
Developed by the author as part of a broader analytical system still in progress.
Trend Analysis

ETH Pro Strategy Alerts (Buy & Sell)This indicator combines four powerful tools into a single confluence-based strategy:
✅ Chandelier Exit: Identifies trend direction and trailing stop levels.
✅ Triple RSI (6/12/24): Confirms momentum alignment across short, mid, and long term.
✅ Stochastic RSI: Pinpoints early entry/exit zones using overbought/oversold signals.
✅ OBV (On-Balance Volume): Validates price action with real volume strength.
Buy/Sell alerts trigger only when all conditions align, helping you avoid false signals and trade with confidence.

9 EMA vs 21 EMA Cloud (Anchored)ema cloud 9 ema and 21 ema. whenever 9 ema is above 21 ema the trend is bulish and vice versa. when ema is below 21 ema trend bearish

Metaplanet MSW Strike (Actual Schedule)This indicator displays the actual Moving Strike Warrant pricing schedule for Metaplanet Inc (3350.T), showing the precise strike prices that warrant holders can exercise at during each evaluation period.
Key Features
Accurate MSW Schedule: Reflects Metaplanet's actual warrant terms with the current strike price locked at 1,649 yen through July 1st, 2025, followed by 3-day re-evaluation cycles starting July 2nd.
Segmented Price Lines: Shows yellow horizontal lines only during their active periods, creating distinct blocks for each MSW window rather than continuous lines. Lines extend into the future to show when each strike price remains valid.
Automatic Calculations: Starting July 2nd, the indicator will automatically calculate new strike prices using the 3-day simple moving average of closing prices from the previous evaluation period.
Real-time Information: Displays current strike price on the right price scale and includes an information panel showing the active strike price and next evaluation date.
Visual Reference: Background colors indicate whether the current price is above (green) or below (red) the active strike price, helping traders quickly assess warrant profitability.

Hull For LoopHull For Loop is a sophisticated trend-following indicator that combines the smoothness of Hull Moving Averages with advanced trend detection algorithms and robust confirmation mechanisms.
## How It Works
At its foundation, Hull For Loop employs a custom-calculated Hull Moving Average using weighted moving average for-loops to achieve optimal smoothness and responsiveness. The system operates through three distinct layers: Hull MA calculation with adjustable smoothing multipliers, advanced trend detection using ATR-based slope thresholds, and multi-bar trend confirmation to filter false breakouts.
The logic flow is elegantly simple yet powerful:
- Hull Calculation combines half-period and full-period weighted moving averages, then applies square-root smoothing for enhanced responsiveness
- Trend Detection analyzes Hull slope against dynamic ATR-based thresholds, classifying market direction as bullish, bearish, or neutral
- Confirmation System requires sustained directional movement across multiple bars before triggering signals, dramatically reducing whipsaws
When Hull slope exceeds the positive threshold, bullish conditions emerge. When it falls below the negative threshold, bearish momentum takes control. The multi-bar confirmation ensures only sustained moves generate actionable signals, making this system ideal for trend-following strategies across volatile markets.
The advanced slope analysis mechanism adapts to market volatility through ATR integration, ensuring sensitivity remains optimal during both high-volatility breakouts and low-volatility consolidations, delivering consistent performance across varying market conditions.
## Features
- Custom Hull Implementation : For-loop calculations for precise weighted moving average control and enhanced smoothness
- Dynamic Trend Detection : ATR-based slope analysis automatically adjusts sensitivity to market volatility conditions
- Multi-Bar Confirmation : Configurable confirmation periods (1-5 bars) eliminate false signals and reduce trading noise
- Advanced Visual System : Dynamic color coding, optional arrows, and statistics table for comprehensive market visualization
- Optimized for Bitcoin : Extensively backtested parameters delivering 128.58% returns with 55% drawdown reduction versus buy-and-hold
- Flexible Configuration : Hull length (1-200), smoothing multiplier (0.1-3.0), sensitivity (1-10), and confirmation settings
- Professional Alerts : Comprehensive alert system for trend changes and entry signals with strength percentages
- Real-time Analytics : Optional statistics table displaying trend direction, strength, Hull value, and current price
## Signal Generation
Hull For Loop generates multiple signal types for comprehensive trend analysis and precise entry/exit timing:
Primary Signals : Confirmed trend changes from bullish to bearish or vice versa - highest probability directional moves
Entry Signals : Initial trend confirmation after multi-bar validation - optimal position entry points
Strength Indicators : Real-time trend strength percentages based on directional momentum over lookback periods
Visual Confirmations : Color-coded Hull line providing instant visual trend status
The confirmation system adds crucial reliability - signals must persist through the specified confirmation period before activation, ensuring only sustained moves trigger trading decisions rather than temporary price fluctuations.
## Visual Implementation
The indicator employs sophisticated visual elements for immediate trend comprehension and professional chart presentation:
- Dynamic Hull Line : Color-changing line (green/red/gray) with configurable width reflecting current trend status
- Optional Directional Arrows : Triangle markers below/above bars marking confirmed trend changes and entry points (disabled by default)
- Statistics Panel : Optional real-time table showing trend direction, strength percentage, Hull value, and current price
- Professional Color Scheme : Customizable bullish (green), bearish (red), and neutral (gray) color system
## Alerts
Hull For Loop includes comprehensive alert conditions for automated trading integration:
- Hull Trend Change - Confirmed trend direction shift with strength percentage
- Hull BUY Signal - Bullish trend confirmation with price and strength data
- Hull SELL Signal - Bearish trend confirmation with price and strength data
- Alert Frequency - Once per bar to prevent spam while maintaining accuracy
All alerts include contextual information: trend direction, current price, and trend strength percentage for informed decision-making.
## Use Cases
Trend Following : Optimized for sustained directional moves with superior drawdown protection compared to buy-and-hold strategies
Swing Trading : Multi-bar confirmation eliminates false breakouts while capturing significant trend changes
Position Trading : Smooth Hull calculation provides stable signals for longer-term directional positioning
Risk Management : Advanced confirmation system dramatically reduces whipsaw trades and false signals
Crypto Trading : Specifically optimized for Bitcoin with parameters delivering exceptional historical performance
The system demonstrates exceptional performance across volatile assets.


LON超级天宫指标指标名称
LON Oscillator with MA Crossover Signal
简短描述 (Short Description)
A comprehensive LON (Long-term Oscillator) indicator with multiple timeframe analysis and MA crossover signals for identifying optimal entry points.
详细描述 (Detailed Description)
Overview
The LON Oscillator is a powerful multi-timeframe technical analysis tool that combines short-term, medium-term, and long-term price momentum to identify potential trading opportunities. This indicator is particularly effective for swing trading and trend following strategies.
Key Features
Multi-timeframe Analysis: Combines 21-day, 37-day, and 55-day price momentum
MA Crossover Signals: 13-day and 55-day moving average crossovers for entry confirmation
Multiple Signal Types: Bottom detection, golden opportunities, top signals, and bounce signals
Visual Alerts: Color-coded signals and background highlights for easy identification
Signal Types
Bottom Signal: When medium-term line < 15, indicating oversold conditions
Golden Opportunity: When all three lines (short, medium, long) < 20, suggesting strong buying opportunity
Top Signal: When medium-term line > 80, indicating overbought conditions
Bounce Signal: When long-term line crosses above 15, signaling potential reversal
Perfect Opportunity: Short-term line crosses above long-term line with specific conditions
Strong Bottom: Multiple confirmation signals for major bottom formation
Usage Guidelines
Buy Signals: Look for golden opportunities and bounce signals when LON is above zero
Sell Signals: Consider taking profits when top signals appear
Risk Management: Use bottom signals for stop-loss placement
Trend Confirmation: Combine with volume and other technical indicators
Best Timeframes
Daily: Primary timeframe for swing trading
4-Hour: For shorter-term entries
Weekly: For long-term trend analysis
Settings
All parameters are optimized for daily charts
Can be adjusted for different timeframes and market conditions
Color scheme can be customized in settings
Disclaimer
This indicator is for educational and informational purposes only. Past performance does not guarantee future results. Always use proper risk management and combine with other analysis tools.

EMA 34 & 89 OnlyThis simple and clean indicator plots two widely-used Exponential Moving Averages (EMAs): the EMA 34 and EMA 89. These EMAs help traders identify the trend direction and potential areas of dynamic support or resistance.
EMA 34 (Orange): Often used to track short-to-mid-term price momentum.
EMA 89 (Blue): Helps gauge the broader market trend.
Commonly used in trend-following strategies, the crossover between EMA 34 and EMA 89 may signal trend shifts:
Bullish signal when EMA 34 crosses above EMA 89.
Bearish signal when EMA 34 crosses below EMA 89.

Breakouts with Trailing Stops V6 + AlertsBreakouts with Trailing Stops in Trading
Breakout trading is a strategy where traders aim to profit from an asset's price moving outside a defined support or resistance level, signaling a potential new trend. Trailing stops are a key risk management tool often used with breakouts to protect profits and limit potential losses.
What is a breakout?
A breakout occurs when an asset's price moves decisively above a resistance level (for a bullish breakout) or below a support level (for a bearish breakdown). This often signals increased momentum and potential for a significant price movement in the direction of the breakout.
Why use trailing stops with breakouts?
Trailing stops are particularly useful in breakout trading because they allow traders to capture potential profits as the price moves in their favor, while automatically adjusting to protect against sudden reversals.
How do trailing stops work with breakouts?
Initial Stop-Loss: When entering a breakout trade, a traditional stop-loss order is placed at a predetermined level to limit potential losses if the price reverses. For example, in a long position after a resistance breakout, the initial stop-loss might be placed below the former resistance level (which can now act as support).
Trailing Stop Activation: Once the price moves a favorable distance beyond the entry point, the trailing stop loss is activated. As highlighted by StoneX, it is a dynamic order that follows the price as it continues to move in the desired direction, maintaining a set distance below (for a long position) or above (for a short position) the current market price.
Profit Locking: If the price continues to rise (or fall for a short position), the trailing stop will move with it, "locking in" profits by raising the stop-loss level.
Exit Strategy: If the price reverses and hits the trailing stop, the position is automatically closed, ensuring that the trader retains a portion of the gains made while in the trade.
Advantages of using trailing stops with breakouts:
Locks in profits: Trailing stops help protect profits generated from successful breakout trades.
Automates exits: They automate the exit process, helping traders avoid emotional decision-making when the price reverses.
Allows for potential gains: They allow traders to stay in profitable trades as long as the trend continues.
Disadvantages of using trailing stops with breakouts:
Whipsaw risk: In volatile markets, the trailing stop may be triggered prematurely by minor price fluctuations.
Potential for missed gains: If the trailing stop is set too tightly, it may prevent the trader from capturing the maximum potential gains if the price experiences a minor pullback before continuing in the desired direction.
Tips for using trailing stops with breakouts:
Consider the asset's volatility: Adjust the trailing stop distance based on the asset's volatility to minimize the risk of premature stops.
Test different trailing stop methods: Experiment with different trailing stop methods to find what works best for your trading style and the specific asset you are trading.
Backtest your strategy: Before applying a trailing stop strategy to live trading, backtest it on historical data to evaluate its performance under different market conditions.
Combine with other indicators: Use other technical indicators, such as volume or momentum oscillators, to confirm the validity of breakouts and improve the effectiveness of your trailing stop strategy.
By carefully considering the market dynamics, using appropriate indicators, and implementing proper risk management techniques, traders can effectively utilize trailing stops with breakouts to capture potential profits while minimizing risk.
Have a good trade.

Multi-Indicator Switch PanelThe Multi-Indicator Switch Panel is a powerful all-in-one TradingView toolkit that allows traders to toggle multiple popular indicators on and off from a single, intuitive control panel — without cluttering the chart or reloading scripts.
This panel gives you real-time control over the following indicators (configurable per version):

8 EMA vs 21 EMA Crossover AlertsThis indicator creates a Buy signal when 8 EMA crosses above 21 EMA and vice versa on any time frame selected on the chart

3M Structure (Free)The Free 3M Indicator is designed to help traders identify market structure by highlighting structure breaks and plotting Bullish and Bearish Triple M candles. It’s ideal for range identification.
🔸 Features included:
– Structure break highlights
– Bullish and Bearish Triple M candle plotting
🔸 Not included (Premium only):
– DTC candles for Abdi’s entry system
– Structure break counter
– Alerts for structure breaks or Triple M setups
For full access, including alerts and premium entry features, join our 3M Discord community and access a free 7-day trial

LANZ Strategy 1.0 [Backtest]🔷 LANZ Strategy 1.0 — Time-Based Session Trading with Smart Reversal Logic and Risk-Controlled Limit Orders
This backtest version of LANZ Strategy 1.0 brings precision to session-based trading by using directional confirmation, pre-defined risk parameters, and limit orders that execute overnight. Designed for the 1-hour timeframe, it allows traders to evaluate the system with configurable SL, TP, and risk settings in a fully automated environment.
🧠 Core Strategy Logic:
1. Directional Confirmation at 18:00 NY:
At 18:00 NY, the system compares the 08:00 open vs the 18:00 close:
If the direction matches the previous day, the signal is reversed.
If the direction differs, the current day's trend is kept.
This logic is designed to avoid momentum exhaustion and capture corrective reversals.
2. Entry Level Definition:
Based on the confirmed direction:
For BUY, the Low of the day is used as Entry Point (EP).
For SELL, the High of the day becomes EP.
The system plots a Stop Loss and Take Profit based on user-defined pip inputs (default: SL = 18 pips, TP = 54 pips → RR 1:3).
3. Time-Limited Entry Execution (LIMIT Orders):
Orders are sent after 18:00 NY and can be triggered anytime between 18:00 and 08:00 NY.
If EP is not touched before 08:00, the order is automatically cancelled.
4. Manual Close Feature:
If the trade is still open at the configured hour (default 09:00 NY), the system closes all positions, simulating realistic intraday exit scenarios.
5. Lot Size Calculation Based on Risk:
Lot size is dynamically calculated using the account size, risk percentage, and SL distance.
This ensures consistent risk exposure regardless of market volatility.
⚙️ Step-by-Step Flow:
08:00 NY → Captures the open of the day.
18:00 NY → Confirms direction and defines EP, SL, and TP.
After 18:00 NY → If conditions are met, a LIMIT order is placed at EP.
Between 18:00–08:00 NY → If price touches EP, the trade is executed.
At 08:00 NY → If EP wasn’t touched, the order is cancelled.
At Configured Manual Close Time (default 09:00 NY) → All open positions are force-closed if still active.
🧪 Backtest Settings:
Timeframe: 1-hour only
Order Type: strategy.entry() with limit=
SL/TP Configurable: Yes, in pips
Risk Input: % of capital per trade
Manual Close Time: Fully adjustable (default 09:00 NY)
👨💻 Credits:
Developed by LANZ
Strategy logic and trading concept built with clarity and precision.
Code structure and documentation by Kairos, your AI trading assistant.
Designed for high-confidence execution and clean backtesting performance.

LANZ Strategy 1.0🔷 LANZ Strategy 1.0 — Session-Based Directional Logic with Visual Multi-Account Risk Management
LANZ Strategy 1.0 is a structured and disciplined trading strategy designed for the 1-hour timeframe, operating during the NY session and executing trades overnight. It uses the directional behavior between 08:00 and 18:00 New York time to define precise limit entries for the following night. Ideal for traders who prefer time-based execution, clear visuals, and professional risk management across multiple accounts.
🧠 Core Components:
1. Session Direction Confirmation:
At 18:00 NY, the system evaluates the market direction by comparing the open at 08:00 vs the close at 18:00:
If the direction matches the previous day, it is reversed.
If it differs, the current day’s direction is kept.
This logic is designed to avoid trend exhaustion and favor potential reversal opportunities.
2. EP Level & Risk Definition:
Once direction is defined:
For BUY, EP is set at the Low of the session.
For SELL, EP is set at the High of the session.
The system automatically plots:
SL fixed at 18 pips from EP
TP at 3.00× the risk → 54 pips from EP
All levels (EP, SL, TP) are shown with visual lines and price labels.
3. Time-Restricted Entry Execution:
The entry is only valid if price touches the EP between 19:00 and 08:00 NY.
If EP is not touched before 08:00 NY, the trade is automatically cancelled.
4. Multi-Account Lot Sizing:
Traders can configure up to five different accounts, each with its own capital and risk percentage.
The system calculates and displays the lot size per account, based on SL distance and pip value, in a dynamic floating label.
5. Outcome Tracking:
If TP is hit, a +3.00% profit label is displayed along with a congratulatory alert.
If SL is hit, a -1.00% label appears with a loss alert.
If the trade is still open by 09:00 NY, it is manually closed, and the result is shown as a percentage of the initial risk.
📊 Visual Features:
Custom-colored angle and guide lines.
Dynamic angle line starts at 08:00 NY and tracks price until 18:00.
Shaded backgrounds for key time zones (e.g., 08:00, 18:00, 19:00).
BUY/SELL signals shown at 19:00 based on match/divergence logic.
Label panel showing risk metrics and lot size for each active account.
⚙️ How It Works:
08:00 NY: Marks the session open and initiates a dynamic angle line.
18:00 NY: Evaluates the session direction and calculates EP/SL/TP based on outcome.
19:00 NY: Activates limit order monitoring.
During the night (until 08:00 NY): If EP is touched, the trade is triggered.
At 08:00 NY: If no touch occurred, trade is cancelled.
Overnight: TP/SL logic is enforced, showing percentage outcomes.
At 09:00 NY: If still open, trade is closed manually and result is labeled visually.
🔔 Alerts:
🚀 EP execution alert when touched
💢 Stop Loss hit alert
⚡ Take Profit hit alert
✅ Manual close at 09:00 NY with performance result
🔔 Daily reminder at 19:00 NY to configure and prepare the trade
📝 Notes:
Strategy is exclusive to the 1-hour timeframe.
Works best on assets with clean NY session movement.
Perfect for structured, semi-automated swing/overnight trading styles.
Fully visual, self-explanatory, and backtest-friendly.
👨💻 Credits:
Developed by LANZ
A strategy created with precision, discipline, and a vision for traders who value time-based entries, clean execution logic, and visual confidence on the chart.
Special thanks to Kairos — your AI assistant — for the detailed structure, scripting, and documentation of the strategy.

ATR Trailing Stops Strategy with Cross Arrowsadds signals when the ATR line is crossed.
Can be used for entries as well as a stop loss area.


High & Low SessionsHigh und Low von drei variablen Sessions rechts neben dem aktuellen Preis darstellen

Algorithmic ScalperAlgorithmic Scalper — Adaptive Trend-Cycle Trading System
Overview
Algorithmic Scalper is an advanced trend detection and signal generation tool designed for scalpers and intraday traders. Its primary goal is to help traders spot and confirm high-probability trend entries with precision. By combining a multi-layer trend detection engine, an ATR-driven trend structure, and EMA trend clustering, it delivers clear LONG, SHORT, OOT LONG (early countertrend long), and OOT SHORT (early countertrend short) signals that can be acted upon within a structured trading framework.
What It Does
Algorithmic Scalper analyzes price action across four core dimensions:
1. Trend Detection — Identifies the dominant trend using a 4-EMA trend cluster (customizable values: 20, 50, 100, 200), which provides the foundation for trend classification and signal labeling.
2. Cycle Timing — Uses a proprietary trend-cycle engine inspired by the Schaff trend approach. This engine applies smoothing and filtering across four internal phases to adapt to market shifts, making trend-confirmation significantly more robust compared to traditional RSI or Stoch-style indicators.
3. ATR Barrier Framework — Constructs a dynamic ATR-based trend zone, similar to advanced ATR trailing methods. This zone adjusts itself in real-time based on market volatility, allowing precise breakout detection and trend adherence.
4. Momentum Validation — Incorporates a MACD-style momentum measure (differential EMA + signal line) that confirms trend strength and trend changes.
5. Signal Alert - Supports built‑in alerts, allowing traders to be notified instantly when a new signal is triggered, so they can stay engaged with the market even when away from the screen.
How It Works
The indicator uses the interplay between these elements to classify price action into one of four actionable states:
1. LONG: Strong trend-confirmation signal aligning trend, momentum, and ATR structure.
2. SHORT: Strong trend-confirmation signal for downside movement.
3. OOT LONG: Early warning for a countertrend long entry when price is stretched away from the trend zone, ideal for reversal or scalp strategies.
4. OOT SHORT: Early warning for a countertrend short entry when price is extended to the upside.
Result: Each signal is calculated only when trend, trend-cycle, momentum, and ATR align, making the entries highly selective and aligned with market structure.
How To Use It
1. Confirm the Context: Always assess the signal within the current market structure. Use higher timeframes to confirm trend direction and strength.
2. Act According to the Signal Type:
-- LONG / SHORT: Enter trend-following positions when trend and momentum align. These signals are ideal for breakout or trend-confirmation trades.
-- OOT LONG / OOT SHORT: Enter countertrend positions when price is extended from its trend zone and confirmed by trend-cycle shifts. These are higher risk and require tighter risk controls.
Why It Is Unique
1. Integrates trend detection, trend-cycling, ATR trend structure, and MACD-style momentum into a single streamlined tool.
2. Goes beyond simple EMA ribbons by adding adaptive trend-cycle filtering for higher precision trend detection.
3. Provides four clearly classified signal types for both trend and countertrend setups.
4. Enables traders to clearly understand the market state, making it ideal for both breakout/trend and reversal strategies.
Apply Risk Management
Never use signals in isolation. Maintain a pre-defined risk/reward ratio, utilize stop losses, and adapt position sizes according to market volatility and personal risk tolerance.
Timeframe Selection
The indicator is optimized for 5-minute and 15-minute charts, making it ideal for scalping and active intraday strategies.
Best Suited For
Scalpers, intraday traders, and active market participants.
Important Notes
The signals generated by Algorithmic Scalper are meant to support decision-making. They should always be used in conjunction with sound trading knowledge, risk management practices, and personal market analysis.
The indicator does not guarantee outcomes and should not be treated as a standalone buy/sell tool. Its value lies in providing actionable trend context, allowing traders to make confident decisions.
This tool is built to evolve as market dynamics evolve, making it a robust long-term addition to any trading toolkit.
License
This indicator was developed by the ProphetAlgoAI team. Its use is restricted to TradingView under a private, invite-only agreement. Redistribution or use outside TradingView is strictly prohibited unless explicitly authorized by the ProphetAlgoAI team.

Daily & Pre-Market Key LevelsThis can be used to identify Pre market high, Pre market low, Previous day high, Previous day low, Daily high & Daily Low. In between PMH & PML, there is a red shaded area where you do not trade.

ORB IndicatorORB – Opening Range Breakout Strength (Applies to First 2 Bars Only)
The ORB (Opening Range Breakout) indicator is a momentum-based tool designed to highlight potential long trade opportunities during the first two candles of the regular trading session. It’s built to detect early strength by filtering for clean bullish price action and relative outperformance against a benchmark index.
🔍 Signal Criteria
A blue triangle is plotted at the close of the candle if the following conditions are met:
The candle is bullish (close > open)
The body makes up at least 60% of the total candle range
The candle occurs during the first or second bar after session start (default: 9:30 AM)
The candle shows greater range strength (in %) than a benchmark symbol (e.g., QQQ or SPY), scaled by a configurable multiplier
⚙️ Customizable Settings
Benchmark Ticker: Choose any symbol (default: NASDAQ:QQQ)
Range Multiplier: Adjust the strength threshold relative to the benchmark’s range
Session Start Time: Set the hour and minute to match your market’s open
📈 Features
Visual signal: blue triangle below the bar
Alert-ready: Get notified instantly when a valid ORB setup appears
Executes only at bar close to ensure confirmed signal
SMA Smooth Market Structure (Multi-Timeframe)SMA Market Structure (Multi-Timeframe) is a powerful tool for tracking structural price action, using simple moving averages across any higher timeframe (HTF). It blends Smart Money Concepts with clean swing logic to reveal trend shifts, breaks of structure, and supply/demand zones.
This indicator highlights key structure features:
• Break of Structure (BOS) – Automatic detection of bullish or bearish swing breaks
• Internal Shifts – Early clues that the market is building toward a reversal
• Liquidity Sweeps (LS) – Detects swing failures that may trap traders
• Zigzag Swing Lines – Cleanly connects swing highs and lows
• Dynamic Zones – Demand (green) and supply (red) blocks drawn from engulfing breakouts
How to Use:
• Set your preferred HTF (e.g. 1H on a 15m chart) to view structure in proper context and
adjust SMA to smooth out market structure for directional consistency
• Watch BOS lines and swing labels like HH, HL, LH, LL for directional clarity
• Use the MS (Market Shift) label to identify full reversals after internal shifts + BOS
• Demand/Supply zones mark areas of previous strength and will update or mitigate automatically
• Alerts notify you of every BOS, MS, HH, LL, and LS event — no need to monitor manually
Customization Features:
• Toggle visibility of market shift markers, internal shifts, and zones
• Choose how internal shifts are calculated (High/Low or Open)
• Customize line style, width, and colors for BOS and zigzag lines
• Control zone duration and how mitigated zones behave (fade or delete)
• Built-in safety for Pine Script’s history limits using smart offset caps
Best Use Tips:
• Combine with price action patterns or volume for confirmation
• MS + BOS + zone tap often marks a high-probability reversal setup
• Use it to align lower timeframe entries with higher timeframe structure
For traders who want structure clarity without clutter, this tool is built to keep your chart actionable and adaptive.

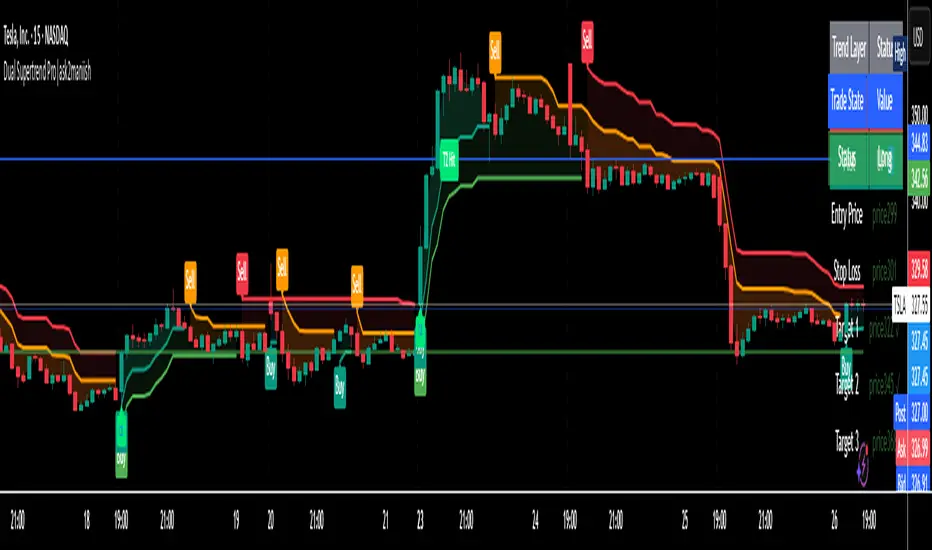
Dual Supertrend Pro|ask2maniishDual Supertrend | ask2maniish
🔍 Overview
The Dual Supertrend indicator overlays two distinct Supertrend layers (Main & Fast) to deliver enhanced trend detection, signal filtering, and trade management. It combines traditional ATR-based trend logic with an optional dynamic risk model and visual trade tracking tools — ideal for intraday scalping, swing trading, or institutional-style strategies.
⚙️ Key Features
🔁 Dual Supertrend Logic: Combines a Main and Fast Supertrend for multi-layer confirmation.
🧠 Smart Entry Signals: Generates buy/sell signals only when both layers agree (combined confirmation).
🎯 Dynamic Trade Management:
Entry/SL/Target logic using ATR.
Auto Breakeven, Trailing SL, and Exit after Target 3.
📊 Trade State Dashboard:
On-chart table showing live status, targets, and trade side.
Visual labels for entry, SL hit, and each target.
🧾 Tooltip for SL Settings: Detailed ATR configurations based on strategy style (Scalping, Swing, Institutional, etc.).
🧠 Use Cases
Strategy Type ATR Period Multiplier Notes
Conservative Trading 14 1.0 – 1.5× Balanced, avoids whipsaws, better R:R
Volatile Markets 21 1.5 – 2.5× For crypto, indices, strong trends
Intraday Scalping 5 – 10 0.5 – 1.0× Tighter SLs for rapid trades
Swing Trades 14 – 21 1.5 – 3.0× Handles spikes, rides long trends
Institutional Logic Dynamic 1.5× below OB SL below CHoCH or Order Block structure zones
You can view this tooltip in the Trade Management group inputs.
🧰 Inputs
📌 Supertrend (Main)
ATR Period
ATR Multiplier
ATR Method (SMA/True Range)
Signal Toggle
Highlight Toggle
⚡ Supertrend (Fast)
ATR Period (Shorter)
ATR Multiplier (Smaller)
ATR Method (SMA/True Range)
Signal Toggle
Highlight Toggle
🎯 Trade Management
SL & Target ATR Period
Target Multiplier
Auto Exit after Target 3
Entry/Exit Label Toggle
Target Hit Label Toggle
Show SL/Target Lines
🧮 Trend State Table
Location Selectable
Combined Trend Label: Strong Up 🔼 / Down 🔽 / Mixed ⚠️
📈 Signals & Alerts
Trigger alerts for all the following:
Main Supertrend Buy/Sell
Fast Supertrend Buy/Sell
Confirmed Combined Buy/Sell when both layers align
📊 Visualization
📉 Supertrend bands with optional background fill
✅ Entry label with trend direction
🎯 Target hit labels with color-coded levels
🧾 Trade Dashboard with real-time trade info
📌 Best Practices
Use combined signals (CB, CS) for filtered trend entries.
Adjust ATR multiplier based on market volatility.
Use in confluence with SMC, OB, or CHoCH zones for higher accuracy.
Enable trade table for real-time tracking of SL and targets.
👨💻 Credits
Script developed by @ask2maniish, with adaptive trade logic and dual-layer Supertrend logic optimized for precision entries and automated exits.
Supply & Demand Zones with Touch CountSupply and demand zones usually mean areas where price reversed multiple times, acting like support (demand) or resistance (supply).
