Real 10Y Yield (DGS10 - T10YIE)The Real 10Y Yield (DGS10 – T10YIE) indicator computes the inflation-adjusted U.S. 10-year Treasury yield by subtracting the 10-year breakeven inflation rate (T10YIE) from the nominal 10-year Treasury yield (DGS10), both sourced directly from FRED. By filtering out inflation expectations, this script reveals the true, real borrowing cost over a 10-year horizon—one of the most reliable gauges of overall risk sentiment and capital–market health.
How It Works
Data Inputs
• DGS10 (Nominal 10-Year Treasury Yield)
• T10YIE (10-Year Breakeven Inflation Rate)
Both series are fetched on a daily timeframe via request.security from FRED.
Real Yield Calculation
pine
Copy
Edit
real10y = DGS10 – T10YIE
A positive value indicates that nominal yields exceed inflation expectations (real yields are positive), while a negative value signals deep-negative real rates.
Thresholds & Coloring
• Bullish Zone: Real yield < –0.1 %
• Bearish Zone: Real yield > +0.1 %
The background turns green when real yields drop below –0.1 %, reflecting an ultra-accommodative environment that historically aligns with risk-on rallies. It turns red when real yields exceed +0.1 %, indicating expensive real borrowing costs and a potential shift toward risk-off.
Alerts
• Deep-Negative Real Yields (Bullish): Triggers when real yield < –0.1 %
• High Real Yields (Bearish): Triggers when real yield > +0.1 %
Why It’s Powerful
Forward-Looking Sentiment Gauge
Real yields incorporate both market-implied inflation and nominal rates, making them a leading indicator for risk appetite, equity flows, and crypto demand.
Clear, Actionable Zones
The –0.1 % / +0.1 % thresholds cleanly delineate structurally bullish vs. bearish regimes, removing noise and false signals common in nominal-only yield studies.
Macro & Cross-Asset Confluence
Combine with equity indices, dollar strength (DXY), or credit spreads for a fully contextual macro view. When real yields break deeper negative alongside weakening dollar, it often precedes stretch in risk assets.
Automatic Alerts
Never miss regime shifts—alerts notify you the moment real yields breach key zones, so you can align your strategy with prevailing macro momentum.
How to Use
Add to a separate pane for unobstructed visibility.
Monitor breaks beneath –0.1 % for early “risk-on” signals in stocks, commodities, and crypto.
Watch for climbs above +0.1 % to hedge or rotate into defensive assets.
Combine with your existing trend-following or mean-reversion strategies to improve timing around major market turning points.
–––
Feel free to adjust the threshold lines to your preferred sensitivity (e.g., tighten to ±0.05 %), or overlay with moving averages to smooth out whipsaws. This script is ideal for macro traders, portfolio managers, and quantitative quants who demand a distilled, inflation-adjusted view of real rates.
Indicators and strategies

Daily Price Change (%)Description:
This script displays the percentage change of the last N candles either above each bar or along a shared horizontal line.
You can choose between two calculation methods:
Close vs Previous Close
Open vs Close
Labels are fully customizable:
Adjustable text size
Custom background color
Number of candles to display
Fixed 10% spacing above candles (prevents overlap)
Ideal for visualizing short-term momentum and price action in a clean, non-intrusive format.
Examples:
Disclaimer:
This script is provided for informational and educational purposes only.
The author assumes no liability for any financial losses, software errors, or misinterpretations.
Always do your own research and use trading tools at your own risk.

Essa - Market Structure DetectorA comprehensive tool for identifying real-time market structure patterns using pivot analysis, adaptive volatility filtering, and multi-timeframe confluence. This script highlights higher highs (HH), higher lows (HL), lower highs (LH), and lower lows (LL), while offering intelligent confirmations and optional visual aids.
Key Features:
Dynamic detection of HH, HL, LH, LL based on pivot structures
Adaptive sensitivity using ATR-based volatility filters
Confirmation logic based on breakout alignment
Optional ZigZag line rendering between key pivots
Customisable labels with confluence indicators
Multi-timeframe pattern scanning with auto-scaling timeframes
Info panel showing current pattern, trend bias, mode, and structure across 5 higher timeframes
Built-in alerts for structure shifts and high-confluence setups
This tool is ideal for traders who rely on structure-based entries, multi-timeframe confluence, and precision pattern recognition to anticipate trend reversals or continuations with high confidence.

Essa - Enhanced Fibonacci Confluence ToolkitA precision-engineered trading tool designed to identify high-probability reversal zones using price action alone. This version expands on traditional Fibonacci confluence techniques by integrating a multi-tiered market structure framework and advanced state management.
Key Features:
Fully automated CHoCH (Change of Character) detection
Tiered market structure logic (Short, Intermediate, Long-Term)
Dynamic Area of Interest (AOI) zone rendering
Automatic Fibonacci retracement plotting from swing highs/lows
Customisable Fibonacci levels (0% to 100%, including 23.6%, 61.8%, 65%, 78.6%)
Real-time Fibonacci invalidation logic with on-chart alerts
Bullish and bearish engulfing candle detection with structure-based filtering
Configurable swing labels (◉, △▽, H/L) with size control
Adjustable CHoCH line styles and widths
Optional display of Fibonacci level labels
Modular and efficient codebase with object-oriented architecture
Originally inspired by the LuxAlgo Fibonacci Confluence Toolkit (v5). Credit to LuxAlgo for the foundational concept.


Previous Day OHLC# Previous Day OHLC Levels Indicator
## Overview
The Previous Day OHLC indicator is a simple yet powerful tool that plots the Open, High, Low, and Close levels from previous trading sessions. This indicator helps traders identify key support and resistance levels based on historical price action, making it easier to spot potential reversal zones and breakout levels.
## Key Features
### 📊 **Previous Day OHLC Levels**
- Displays the Open, High, Low, and Close prices from 1-5 days ago
- Lines automatically extend to the right for easy visualization
- Updates daily to show the most relevant levels
### 🎨 **Fully Customizable Styling**
- **Individual Line Colors**: Choose unique colors for each OHLC level
- **Line Styles**: Select from Solid, Dashed, or Dotted lines for each level
- **Line Width**: Adjust thickness from 1-4 pixels for better visibility
- **Price Labels**: Display actual price values on each line with customizable sizing
### ⚙️ **Flexible Settings**
- **Lookback Period**: Choose to display levels from 1-5 days ago (maximum safety limit)
- **Label Control**: Toggle price labels on/off and adjust their size
- **Performance Optimized**: Clean code that won't slow down your charts
## How to Use
1. **Add to Chart**: Apply the indicator to any timeframe chart
2. **Customize Settings**: Adjust colors, styles, and lookback period to your preference
3. **Identify Levels**: Use the plotted lines as potential support/resistance zones
4. **Trade Setup**: Look for price reactions at these key levels for entry/exit signals
## Best Practices
- **Day Trading**: Use 1-day lookback for intraday support/resistance
- **Swing Trading**: Extend lookback to 2-5 days for broader context
- **Multi-Timeframe**: Combine with other timeframe analysis for confirmation
- **Risk Management**: Use these levels for stop-loss and take-profit placement
## Color Coding (Default)
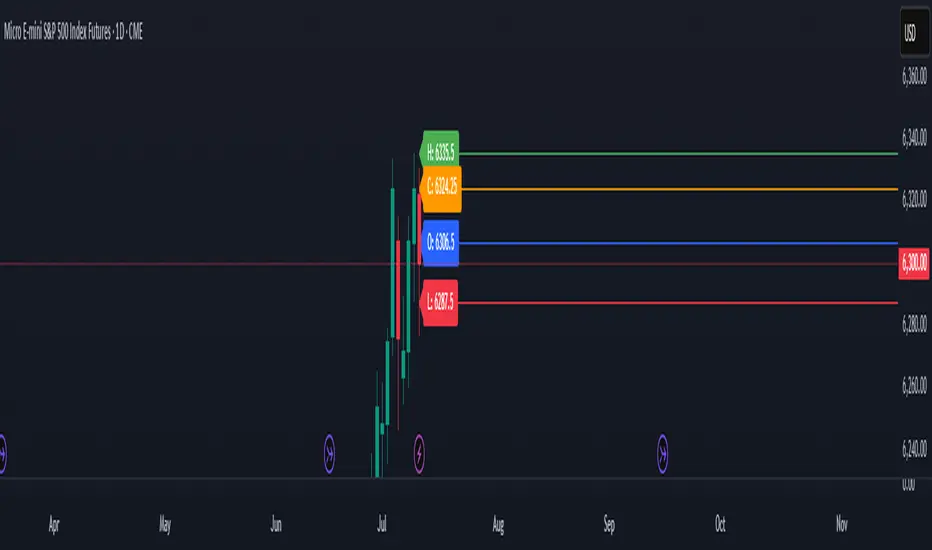
- **Open**: Blue - Starting price of the previous session
- **High**: Green - Highest price reached
- **Low**: Red - Lowest price reached
- **Close**: Orange - Final price of the session
## Why This Indicator Works
Previous day OHLC levels are among the most watched price points by professional traders. These levels often act as:
- **Support/Resistance**: Price tends to react at these historical levels
- **Breakout Confirmation**: Strong moves beyond these levels can signal trend continuation
- **Reversal Zones**: Price often bounces from these key levels
- **Psychological Levels**: Market participants remember these important price points
## Technical Specifications
- **Pine Script Version**: v6
- **Overlay**: Yes (plots directly on price chart)
- **Performance**: Optimized for smooth chart operation
- **Compatibility**: Works on all timeframes and instruments
Perfect for traders of all experience levels who want to incorporate previous day levels into their technical analysis toolkit!
Essa's Sessions IndicatorOverview
This powerful tool is designed to visually map out the key trading sessions: Asia, London, and New York directly on your chart. By highlighting these periods and plotting their respective highs and lows, it helps you identify critical price levels, gauge market sentiment, and pinpoint potential breakout opportunities with ease.
What It Does
Visualizes Key Trading Sessions: Automatically draws colored backgrounds for the Asia, London, and New York sessions to show you exactly when the most important market activity is happening.
Plots Session Highs & Lows: Displays precise horizontal lines for the highest and lowest prices reached during each session, acting as key support and resistance levels.
Dual Timezone Mode: Easily switch between London (GMT/BST) and New York (EST/EDT) timezones with a single click. The indicator automatically adjusts all session times for you, ensuring accuracy no matter where you are.
Interactive & Informative Labels: Hover over any session high or low label to see a detailed tooltip containing:
The exact price level.
The session's price range (calculated in pips or points).
The total daily price range for broader context.
A simple volatility gauge (from "Low Vol 😴" to "High Vol 🔥").
Customizable Alerts: Enable breakout alerts to receive instant notifications the moment the price closes above a session high or below a session low.
Simple, powerful, and highly informative, this indicator is an essential tool for traders looking to build strategies around session-based price action.

Session VWAPsThis indicator plots volume-weighted average price (VWAP) lines for three major trading sessions: Tokyo, London, and New York. Each VWAP resets at the start of its session and tracks the average price weighted by volume during that window. You can choose the exact session times, turn individual sessions on or off, and optionally extend each VWAP line until the end of the trading day.
It’s designed to give you a clear view of how price is behaving relative to session-specific value areas. This can help in identifying session overlaps, shifts in price control, or whether price is holding above or below a particular session’s average. The indicator supports futures-style day rollovers and works across markets.

National Financial Conditions Index (NFCI)This is one of the most important macro indicators in my trading arsenal due to its reliability across different market regimes. I'm excited to share this with the TradingView community because this Federal Reserve data is not only completely free but extraordinarily useful for portfolio management and risk assessment.
**Important Disclaimers**: Be aware that some NFCI components are updated only monthly but carry significant weighting in the composite index. Additionally, the Fed occasionally revises historical NFCI data, so historical backtests should be interpreted with some caution. Nevertheless, this remains a crucial leading indicator for financial stress conditions.
---
## What is the National Financial Conditions Index?
The National Financial Conditions Index (NFCI) is a comprehensive measure of financial stress and liquidity conditions developed by the Federal Reserve Bank of Chicago. This indicator synthesizes over 100 financial market variables into a single, interpretable metric that captures the overall state of financial conditions in the United States (Brave & Butters, 2011).
**Key Principle**: When the NFCI is positive, financial conditions are tighter than average; when negative, conditions are looser than average. Values above +1.0 historically coincide with financial crises, while values below -1.0 often signal bubble-like conditions.
## Scientific Foundation & Research
The NFCI methodology is grounded in extensive academic research:
### Core Research Foundation
- **Brave, S., & Butters, R. A. (2011)**. "Monitoring financial stability: A financial conditions index approach." *Economic Perspectives*, 35(1), 22-43.
- **Hatzius, J., Hooper, P., Mishkin, F. S., Schoenholtz, K. L., & Watson, M. W. (2010)**. "Financial conditions indexes: A fresh look after the financial crisis." *US Monetary Policy Forum Report*, No. 23.
- **Kliesen, K. L., Owyang, M. T., & Vermann, E. K. (2012)**. "Disentangling diverse measures: A survey of financial stress indexes." *Federal Reserve Bank of St. Louis Review*, 94(5), 369-397.
### Methodological Validation
The NFCI employs Principal Component Analysis (PCA) to extract common factors from financial market data, following the methodology established by **English, W. B., Tsatsaronis, K., & Zoli, E. (2005)** in "Assessing the predictive power of measures of financial conditions for macroeconomic variables." The index has been validated through extensive academic research (Koop & Korobilis, 2014).
## NFCI Components Explained
This indicator provides access to all five official NFCI variants:
### 1. **Main NFCI**
The primary composite index incorporating all financial market sectors. This serves as the main signal for portfolio allocation decisions.
### 2. **Adjusted NFCI (ANFCI)**
Removes the influence of credit market disruptions to focus on non-credit financial stress. Particularly useful during banking crises when credit markets may be impaired but other financial conditions remain stable.
### 3. **Credit Sub-Index**
Isolates credit market conditions including corporate bond spreads, commercial paper rates, and bank lending standards. Important for assessing corporate financing stress.
### 4. **Leverage Sub-Index**
Measures systemic leverage through margin requirements, dealer financing, and institutional leverage metrics. Useful for identifying leverage-driven market stress.
### 5. **Risk Sub-Index**
Captures market-based risk measures including volatility, correlation, and tail risk indicators. Provides indication of risk appetite shifts.
## Practical Trading Applications
### Portfolio Allocation Framework
Based on the academic research, the NFCI can be used for portfolio positioning:
**Risk-On Positioning (NFCI declining):**
- Consider increasing equity exposure
- Reduce defensive positions
- Evaluate growth-oriented sectors
**Risk-Off Positioning (NFCI rising):**
- Consider reducing equity exposure
- Increase defensive positioning
- Favor large-cap, dividend-paying stocks
### Academic Validation
According to **Oet, M. V., Eiben, R., Bianco, T., Gramlich, D., & Ong, S. J. (2011)** in "The financial stress index: Identification of systemic risk conditions," financial conditions indices like the NFCI provide early warning capabilities for systemic risk conditions.
**Illing, M., & Liu, Y. (2006)** demonstrated in "Measuring financial stress in a developed country: An application to Canada" that composite financial stress measures can be useful for predicting economic downturns.
## Advanced Features of This Implementation
### Dynamic Background Coloring
- **Green backgrounds**: Risk-On conditions - potentially favorable for equity investment
- **Red backgrounds**: Risk-Off conditions - time for defensive positioning
- **Intensity varies**: Based on deviation from trend for nuanced risk assessment
### Professional Dashboard
Real-time analytics table showing:
- Current NFCI level and interpretation (TIGHT/LOOSE/NEUTRAL)
- Individual sub-index readings
- Change analysis
- Portfolio guidance (Risk On/Risk Off)
### Alert System
Professional-grade alerts for:
- Risk regime changes
- Extreme stress conditions (NFCI > 1.0)
- Bubble risk warnings (NFCI < -1.0)
- Major trend reversals
## Optimal Usage Guidelines
### Best Timeframes
- **Daily charts**: Recommended for intermediate-term positioning
- **Weekly charts**: Suitable for longer-term portfolio allocation
- **Intraday**: Less effective due to weekly update frequency
### Complementary Indicators
For enhanced analysis, combine NFCI signals with:
- **VIX levels**: Confirm stress readings
- **Credit spreads**: Validate credit sub-index signals
- **Moving averages**: Determine overall market trend context
- **Economic surprise indices**: Gauge fundamental backdrop
### Position Sizing Considerations
- **Extreme readings** (|NFCI| > 1.0): Consider higher conviction positioning
- **Moderate readings** (|NFCI| 0.3-1.0): Standard position sizing
- **Neutral readings** (|NFCI| < 0.3): Consider reduced conviction
## Important Limitations & Considerations
### Data Frequency Issues
**Critical Warning**: While the main NFCI updates weekly (typically Wednesdays), some underlying components update monthly. Corporate bond indices and commercial paper rates, which carry significant weight, may cause delayed reactions to current market conditions.
**Component Update Schedule:**
- **Weekly Updates**: Main NFCI composite, most equity volatility measures
- **Monthly Updates**: Corporate bond spreads, commercial paper rates
- **Quarterly Updates**: Banking sector surveys
- **Impact**: Significant portion of index weight may lag current conditions
### Historical Revisions
The Federal Reserve occasionally revises NFCI historical data as new information becomes available or methodologies are refined. This means backtesting results should be interpreted cautiously, and the indicator works best for forward-looking analysis rather than precise historical replication.
### Market Regime Dependency
The NFCI effectiveness may vary across different market regimes. During extended sideways markets or regime transitions, signals may be less reliable. Consider combining with trend-following indicators for optimal results.
**Bottom Line**: Use NFCI for medium-term portfolio positioning guidance. Trust the directional signals while remaining aware of data revision risks and update frequency limitations. This indicator is particularly valuable during periods of financial stress when reliable guidance is most needed.
---
**Data Source**: Federal Reserve Bank of Chicago
**Update Frequency**: Weekly (typically Wednesdays)
**Historical Coverage**: 1973-present
**Cost**: Free (public Fed data)
*This indicator is for educational and analytical purposes. Always conduct your own research and risk assessment before making investment decisions.*
## References
Brave, S., & Butters, R. A. (2011). Monitoring financial stability: A financial conditions index approach. *Economic Perspectives*, 35(1), 22-43.
English, W. B., Tsatsaronis, K., & Zoli, E. (2005). Assessing the predictive power of measures of financial conditions for macroeconomic variables. *BIS Papers*, 22, 228-252.
Hatzius, J., Hooper, P., Mishkin, F. S., Schoenholtz, K. L., & Watson, M. W. (2010). Financial conditions indexes: A fresh look after the financial crisis. *US Monetary Policy Forum Report*, No. 23.
Illing, M., & Liu, Y. (2006). Measuring financial stress in a developed country: An application to Canada. *Bank of Canada Working Paper*, 2006-02.
Kliesen, K. L., Owyang, M. T., & Vermann, E. K. (2012). Disentangling diverse measures: A survey of financial stress indexes. *Federal Reserve Bank of St. Louis Review*, 94(5), 369-397.
Koop, G., & Korobilis, D. (2014). A new index of financial conditions. *European Economic Review*, 71, 101-116.
Oet, M. V., Eiben, R., Bianco, T., Gramlich, D., & Ong, S. J. (2011). The financial stress index: Identification of systemic risk conditions. *Federal Reserve Bank of Cleveland Working Paper*, 11-30.

Recent Pullback Percentage//@version=5
indicator("Recent Pullback Percentage", shorttitle="Pullback %", format=format.percent)
// 定義回顧期間
lookbackPeriod = input.int(60, title="Lookback Period")
// 找到近期最高價
highestHigh = ta.highest(high, lookbackPeriod)
// 計算回檔百分比
pullbackPercent = ((close - highestHigh) / highestHigh)
plot(pullbackPercent, title="Pullback Percentage")

Belev Echad IndicatorSmart Indicator showing SMA (20, 50, 100, 200), ATR, RSI values as well as the respected company's name as a watermark for educational purposes in Belev Echad.

CPR by myBiniyogThis is a clean, professional CPR (Central Pivot Range) + Pivot Points indicator built using Pine Script v6.
🔹 What it plots:
• Central Pivot Range (Pivot, TC, BC)
• Daily, Weekly, and Monthly pivot levels
• Classic Support (S1, S2, S3) and Resistance (R1, R2, R3)
🔹 Customization:
• Enable/disable CPR or pivot levels separately
• Toggle weekly and monthly pivot visibility
• Color-coded: Blue for CPR, Green for supports, Red for resistances
• Weekly levels are plotted as crosses, monthly as circles
🔹 Trading Ideas:
• Narrow CPR suggests breakout potential
• Price above CPR = bullish bias, below CPR = bearish
• Use pivot levels for intraday support/resistance reference
🎯 Ideal for intraday, swing, and positional traders looking to track dynamic support-resistance zones using CPR-based logic.
Built with ❤️ by **myBiniyog**
⚠️ For educational use only. This indicator does not provide buy/sell signals or investment advice.

BG 3:00 / 2:00 Candle High/Low LinesBG 3:00 Candle High/Low Lines
This indicator highlights the high and low of the 1-hour candle exactly at 3:00 AM Bulgarian local time (EET/EEST). Horizontal lines are drawn at these levels and extended 5 hours forward, providing clear visualization of key daily levels.
Key Features:
Automatically adjusts for Bulgarian local time, including daylight saving time changes.
Marks only the 3:00 AM candle on the 1-hour chart for a clean and focused view.
Allows customizable colors for the high and low lines separately.
Lines extend 5 hours ahead to aid in tracking important support and resistance levels.
Ideal for traders analyzing the Bulgarian market or anyone interested in monitoring the 3:00 AM Europe/Sofia time frame.
Use this tool to identify crucial price levels aligned with Bulgarian time and enhance your intraday trading strategy.

RSI + Fibonacci Bollinger BandsIn the current context of the cryptocurrency market, the search for effective trading strategies has become an imperative for investors. In this regard, developing completely new and innovative scripts in TradingView, with a high probability of profit, represents a stimulating challenge. The following is a proposed strategy that, while it may integrate existing elements of the TradingView ecosystem, establishes a distinctive and avant-garde approach to analyzing the price of Bitcoin against Tether (USDT).
The essence of this script lies in the combination of analytical tools that are not usually joined in common practice. One can start from traditional indicators, such as Bollinger Bands and the Relative Strength Index (RSI), but their implementation must be revisited to obtain an unprecedented result. Instead of using these indicators conventionally, it is suggested to create an adaptive divergence indicator that not only detects overbought or oversold conditions, but also adjusts its parameters based on the recent volatility of the market.
The proposal focuses on a system that uses a 50-period exponential moving average as a baseline, combined with Bollinger Bands to establish support and resistance levels. However, instead of simply observing the breaking of these bands, buy and sell signals would be implemented based on corroborations from the volatility-adjusted RSI. This approach would allow capturing trend changes more efficiently and with minimal delay in the execution of orders.
In addition, an alert system could be included that notifies the trader of divergences between the price and the RSI, which could increase the chances of anticipating crucial movements in the market. The implementation of this functionality would be carried out through the use of Pine Script version 6, which would guarantee optimized and modern code.
In conclusion, the creation of an innovative script for analyzing the price of Bitcoin against USDT in TradingView should focus on the development of synergistic strategies that transcend conventional methods. The combination of well-established indicators, adapted to the dynamic conditions of the market, can offer traders a valuable tool in their arsenal. Innovation, in this area, is essential to adapt to a constantly changing environment and maximize profit opportunities.

EMACross + ADX/RSI/SMI filters + AlertsSimple EMA Cross indicator, but with ability to add filters based on ADX/RSI/SMI

Weekend Trap
Weekend Trap Indicator
A comprehensive weekend range analysis tool designed to identify and track low-liquidity weekend price movements with advanced market maker detection.
What is the Weekend Trap?
The Weekend Trap refers to price ranges established during low-liquidity weekend periods (Saturday 5:00 AM to Monday 5:00 AM Perth time) when institutional trading is minimal.
Key Features
📊 Weekend Range Detection
Automatically identifies weekend periods based on Perth timezone
Creates visual rectangles showing weekend high/low ranges
Displays 50% midline for key pivot levels
Configurable range cutoff (default: Sunday 3:00 PM)
🎯 Advanced Market Maker Detection
PVSRA-style volume analysis for institutional activity identification
4-color coding system:
🟢 Lime: 200% Bull volume (Peak volume + bullish candle)
🔴 Red: 200% Bear volume (Peak volume + bearish candle)
🔵 Blue: 150% Bull volume (Rising volume + bullish candle)
🟣 Fuchsia: 150% Bear volume (Rising volume + bearish candle)
Weighted volume calculation for better peak detection
Circles positioned above bars for clear visualization
📈 Range Analytics
Clean range labels showing:
Absolute price range
Percentage movement
Historical analysis with configurable lookback period
Current weekend tracking with real-time updates
Settings Overview
Core Settings
Weeks to Backtest (1-52): Number of completed weekends to display
Show Weekend Trap Rectangles: Toggle rectangle visibility
Use Wicks for Rectangle Height: Include wicks vs. body-only ranges
Sunday Range Cutoff Hour: When to stop updating weekend range
Visual Customization
Rectangle colors and borders
Market maker marker sizes (tiny to large)
PVSRA color scheme for different volume levels
Label display options
Market Maker Detection
Automatic PVSRA analysis during weekend periods
150% threshold: Volume ≥ 150% of 10-period average
200% threshold: Volume ≥ 200% of average OR weighted volume peak
Real-time detection with immediate visual feedback
How to Use
Add to your chart (works on any timeframe, recommended: 1H-4H)
Set your preferred lookback period (default: 4 weeks)
Observe weekend ranges and note market maker activity
Monitor volume spikes indicated by colored circles
Analysis Applications
Weekend Range Analysis
Identify price ranges during low-liquidity periods
Track historical weekend price movements
Analyze range size and frequency patterns
Market Maker Detection
Identify institutional accumulation/distribution
Spot manipulation during low-liquidity periods
Analyze volume patterns and anomalies
Historical Pattern Recognition
Weekend range comparison across multiple periods
Multiple timeframe analysis capability
Volume pattern identification
Technical Details
Timezone: Australia/Perth (GMT+8)
Weekend Period: Saturday 5:00 AM → Monday 5:00 AM
Volume Analysis: 10-period moving average baseline
Weighted Volume: Volume × (High - Low) for peak detection
Object Management: Automatic cleanup based on lookback period
Best Practices
Use on liquid markets (major forex pairs, crypto, indices)
Adjust lookback period based on analysis timeframe
Monitor during Asia-Pacific trading hours for best results
Consider fundamental events that may affect weekend gaps
Credits
Volume analysis inspired by PVSRA (Price Volume Spread Range Analysis) methodology for institutional activity detection.
This indicator is designed for educational and analysis purposes.

SuperPerformance_V1.24SuperPerformance V1.24 - Advanced Performance Analysis Indicator
🎯 CORE FEATURES
📊 Performance Analysis
• Stock vs Index comparison across 6 timeframes (1D to 200D)
• Conviction scoring system (Perfect/Solid/Good/Ok/Weak/Poor)
• Real-time outperformance tracking with ✓/✗ indicators
🏢 Sector Analysis
• Top 5 sector ranking with live performance data
• 10 Indian market sectors tracking (PHARMA, TECH, FINANCE, etc.)
• Automatic sector identification for current stock
📈 Technical Tools
• Triple Moving Averages (SMA/EMA/WMA/HMA)
• Distance from MA analysis with percentage/spread calculations
• Enhanced hover tooltips showing distance info
🔔 Smart Alerts
• Dynamic Circuit Breakers (20%/10%/5%/2%) that adapt to volatility
• Extreme distance alerts when price deviates significantly from MA
🎨 Visual Interface
• 4 customizable tables: Stock Performance, Sector Performance, Distance Analysis, Sector Display
• Dark/Light themes with professional styling
• Flexible positioning - place tables anywhere on chart
• Mini mode for compact display
⚡ Advanced Features
• Real-time data from 10+ Indian indices
• Granular controls - show/hide any columns or rows
• Multiple tooltip methods (Labels/Data Window)
• Professional color coding for quick analysis
🎯 PERFECT FOR:
Indian stock traders, sector rotation analysis, performance monitoring, and technical analysis with institutional-grade features.
📌 KEY BENEFITS:
✅ Multi-timeframe performance tracking
✅ Sector rotation insights
✅ Advanced moving average analysis
✅ Professional-grade visualization
✅ Customizable alerts and notifications
✅ Indian market focus with NSE data integration
🔧 TECHNICAL SPECIFICATIONS:
• Pine Script v5 compatible
• Overlay indicator
• Real-time data processing
• Memory optimized
• Multi-security data support
• Professional color schemes

Previous Day OHLC + Open MarkerPrevious Day OHLC + Open Marker
This indicator is designed to help traders quickly identify the most important price levels from the previous trading session and today’s open. It provides a clean and configurable overlay of the previous day’s OHLC (Open, High, Low, Close) along with the current day's opening price, making it easy to spot price reactions, liquidity sweeps, and confluence zones.
📌 Key Features
✅ Previous Day OHLC Lines
Plots horizontal lines for High (H), Low (L), Open (O), and Close (C) from the previous session
Each line is independently toggleable
Fully customizable in color, transparency, and thickness
✅ Today's Session Open (DO)
Marks the current day's opening price
Helps identify directional bias, trend/momentum shifts, or mean-reversion points
✅ Minimalist Labels for Clarity
Text-only labels like H, L, O, C, and DO — no bulky label boxes
Color-matched to each line for visual simplicity
Optional display to keep charts clean
✅ Session-Based Highlight Zone
Optionally highlights the area between the previous day’s High and Low with a shaded box
Useful for identifying the day’s value area or range breakouts
✅ Smart Alerts
Receive alerts when price crosses any of the levels: PDH, PDL, PDO, PDC, or Today’s Open
Helps you catch key interactions without watching the chart constantly
🧠 Ideal For
Intraday traders using VWAP, order blocks, or liquidity concepts
Swing traders who want to see how current price relates to prior structure
Scalpers looking for clean levels to enter fades, reversals, or breakouts
Anyone applying institutional trading concepts (PDH/PDL sweeps, FVGs, BPRs, etc.)
⚙️ Customization Options
Toggle each level (H/L/O/C/DO) individually
Show or hide labels and highlight zone
Customize color, line thickness, and transparency
Clean layout — no line extensions across the entire chart
🧼 Design Philosophy
This script was created for clarity, speed, and minimalism. It avoids clutter while preserving all the crucial context price action traders need. Labels are informative but unobtrusive, and alerts help automate level tracking.
🛠 Built with Pine Script v5
🔔 Alerts Included
📊 Optimized for both intraday and swing trading
📦 Lightweight and modular by design

Custom MA 5-Line Tool (Fully Adjustable)功能 說明
週期可調 每條線的天數可自訂(3、5、8、13、21 或其他)
可切換類型 可選擇 SMA 或 EMA
線條顏色粗細 每條線都可設定顏色與粗細
顯示控制 可選擇是否顯示每條均線
Feature Description
Custom Periods MA periods (default: 3, 5, 8, 13, 21) can be manually adjusted
Type Selection Choose between SMA or EMA for each line individually
Visibility Control Enable or disable any moving average line
Color & Thickness Settings Customize the color and line width for each MA

day trading check indicatorDay Trading Check Indicator
By Trades per Minute · Creator: Trader Malik
Overview
The Day Trading Check Indicator is an on‐chart status panel that gives you a quick “go/no-go” snapshot of four key metrics—MACD, VWAP, Float, and Bearish Sell-Off—directly in TradingView’s top-right corner. It’s designed for fast decision-making during high-velocity intraday sessions, letting you instantly see whether each metric is “bullish” (green) or “bearish” (red), plus live float data.
What It Shows
Column Description
Metric The name of each metric: MACD, VWAP, Float, Bearish Sell-Off
Status/Value A color-coded status (“GREEN”/“RED” or “YES”/“NO”) or the float value formatted in K/M/B
Metrics & Calculations
MACD (1-Minute)
Calculation: Standard MACD using EMA (12) – EMA (26) with a 9-period signal line, all fetched from the 1-minute timeframe via request.security().
Status:
GREEN if MACD ≥ Signal
RED if MACD < Signal
VWAP (Session-Anchored)
Calculation: Built-in session VWAP (ta.vwap(close)) resets each new trading session.
Status:
GREEN if current price ≥ VWAP
RED if current price < VWAP
Float
Calculation: Retrieves syminfo.shares_outstanding_float (total float), then scales it into thousands (K), millions (M), or billions (B), e.g. “12.3 M.”
Display: Always shown as the absolute float value, white on semi-transparent black.
Bearish Sell-Off
Calculation: Checks the last five 1-minute bars for any “high-volume down” candle (volume above its 20-bar SMA and close < open).
Status:
YES if at least one such bar occurred in the past 5 minutes
NO otherwise
Key Features
Dynamic Table: Automatically shows only the metrics you enable via the Display Options group.
Size Selector: Choose Small, Medium, or Large text for easy visibility.
Clean Styling: Distinct header row with custom background, consistent row shading, centered status text, and a subtle gray border.
Lightweight Overlay: No cluttering plots—just a concise status panel in the corner.
Published by Trader Malik / Trades per Minute
Version: Pine Script v5


Samrat Directional Movement Index with Mediun to track ADX Samrat Directional Movement Index with Mediun to track ADX has a mediun line added for better tracking of ADX and +DI an -DI for traders.Feedback welcome

CPR by myBiniyog“CPR by myBiniyog” plots Central Pivot Range (CPR) and Daily Pivot Points (R1, R2, S1, S2) using clean and intuitive circle markers on price charts. Ideal for intraday traders who rely on key support and resistance zones.
🔹 **CPR Levels**:
- TC (Top Central)
- Pivot
- BC (Bottom Central)
🔹 **Daily Pivot Points**:
- R1 & R2 (Resistance Zones)
- S1 & S2 (Support Zones)
The CPR is based on previous day's OHLC data and can help traders predict:
- Narrow CPR = potential breakout day
- Wide CPR = potential sideways movement
The indicator auto-plots these levels as circles on intraday timeframes (like 5-min or 15-min charts). It's designed to be visually clean and fast to read.
Built in Pine Script v5. Open-source. Free for educational use.
Best suited for Nifty, Bank Nifty, stocks, crypto and forex traders who prefer CPR-based systems.
Made by: myBiniyog
