Multi-SMA (100, 200, 365)This indicator plots three Simple Moving Averages (SMAs) on the chart.
The lengths are fixed at 100, 200, and 365 periods.
It is a good buying zone for Bitcoin
Indicators and strategies

Custom ETF with Dynamic Weights & RatioHi,
Want to create your own ETF from your portfolio?
This script lets you:
Add up to 10 stocks to form an ETF.
Assign weightings to each stock.
Create a second ETF to compare with your first ETF.
Compare both ETFs to determine which performs best.

COG GravityBased on the COG concept by veryfid — but shown directly on the chart instead of an oscillator pane.
Long Entry
Price crosses above the COG line, and
Price is above the SMA
COG velocity is rising (momentum is building)
Short Entry
Price crosses below the COG line, and
Price is below the SMA
COG velocity is falling (momentum is weakening)
Feel free to modify the script and let me know ☺️

MA Bands with Dynamic ColorsThe chart displays the 50-day, 100-day, and 200-day moving averages (MAs).
When the 50-day MA is above both the 100-day and 200-day MAs, the chart turns green, indicating a bullish trend with increasing positive momentum.
Conversely, when the 50-day MA is below the 100-day and 200-day MAs, the chart turns red, signaling a bearish trend with negative momentum.
This color-coded system, with green and red clouds, helps traders identify the trend direction and gauge positive or negative momentum for potential trading opportunities.

Reverse XReverse X is a visual tool that shows the price levels required to reach specific RSI values. It calculates and plots up to four reverse-engineered RSI lines directly on the chart. Each line can be customized with its own RSI target, color, line width, and visibility toggle. The lines are smoothed using EMA to reduce noise, and transparent fills between them highlight RSI zones. Ideal for traders who want to anticipate price movement needed to push RSI to key levels like 30, 50, or 70.

3-Candle HH/HL or LH/LL (Number Labels Over Candles)What This Script Does:
This Pine Script detects 3 consecutive candlesticks that show:
Higher Highs and Higher Lows → a bullish structure
Lower Highs and Lower Lows → a bearish structure
When such a pattern is found, the script:
Marks each of the 3 candles with a number: 1, 2, and 3
Labels appear centered on each candle (at the close price)
You can adjust:
Label size (tiny → huge)
Background color (bullish/bearish)
Text color
Example:
If candles form:
Candle A: higher high & higher low
Candle B: higher than A
Candle C: higher than B
Then you’ll see 1, 2, 3 labels on those candles in green (or your selected color).
Same goes for a bearish pattern in red.

Live Breakout Zones (No Repaint)The Live Breakout Zones indicator is a non-repainting, real-time breakout detection tool designed to help traders identify critical price breakouts as they happen — without lag and without repainting past signals.
This indicator scans recent price action to determine the highest high and lowest low over a user-defined lookback period. When price closes above the recent high or below the recent low, it immediately plots a breakout zone on the chart and provides a visual confirmation through labels and optional alerts.
🔍 Key Features:
✅ No Repainting – Signals are locked in as soon as a breakout happens; no future bar confirmation is needed.
⏱️ Minimal Lag – Reacts on breakout of recent range highs/lows without waiting for pivots or candle confirmation.
📦 Breakout Zones – Automatically draws colored rectangles showing the breakout level and zone width for clearer analysis.
🔔 Real-Time Alerts – Alerts for both bullish and bearish breakouts help you stay informed without watching the screen.
⚙️ Customizable – Adjustable lookback length, zone width, and color settings to match your strategy or chart style.
📈 Use Cases:
Identify key breakout moments for entry or retest zones.
Confirm breakout-based strategies in trending or consolidating markets.
Use zones for setting risk-reward areas, SL/TP levels, or re-entry planning.
⚙️ Settings:
Lookback Range (High/Low): Defines how many previous bars are checked for breakout levels.
Zone Width: Number of bars to extend the breakout box forward.
Bullish/Bearish Zone Color: Choose custom colors for breakout visualization.
🧠 Trading Tip:
Combine this tool with volume spikes, tail candles, or support/resistance for more reliable breakout setups.

SMA 5/10/30 close🧊
SMA 5/10/30 close
SMA 5/10/30 close
SMA 5/10/30 close
SMA 5/10/30 close
SMA 5/10/30 close

Market Direction Arrowsmy indicater when market is up trend they show green arrow when market is down trend they
show red arrow confirm my indicater never fail

Heatmap w/ ATRThis script combines Heatmap Volume with a scaled ATR (Average True Range) overlay for dynamic market insight. Volume bars are color-coded based on how many standard deviations they deviate from a moving average, helping identify spikes, absorption, or anomalies.
The ATR is scaled relative to the maximum volume observed to maintain visual alignment in the same pane. This allows traders to compare price volatility (ATR) against real market activity (volume) in one view.
Use this overlay to:
Spot high-volatility, high-conviction moves (rising ATR + red/orange bars)
Detect low-volume fakeouts (high ATR, cool-colored bars)
Identify compression zones before expansion (low ATR + normal volume)

Combined Indicators: RSI, DMI, ATR, EMA, SMAit is a script that adds every single type of indicator ( but not ribbons ) ...
give it your interest and try it out !!!
feel free to give it a like ...
yours truly jitendra thakur ...

Market Generated InformationCredits
Original Author: mcthatsme
Remixed to add in London's High and Low
Overview
The Market Generated Information (MGI Levels v2) is a comprehensive technical analysis. It overlays key price levels from daily, weekly, and monthly timeframes on a chart, providing traders with critical market reference points such as Open, High, Low, Close, Volume Weighted Average Price (VWAP), and standard deviation bands. These levels help traders identify potential support, resistance, and pivot points for intraday and longer-term trading strategies. The indicator is highly customizable, allowing users to tailor the displayed levels, colors, line styles, and label settings to their preferences.
Features
Multi-Timeframe Levels: Displays key price levels from daily, weekly, and monthly sessions, including Open, High, Low, Close, VWAP, and VWAP standard deviation bands (SD1, SD2, SD3).
Session-Based Calculations: Supports Regular Trading Hours (RTH) and Extended Trading Hours (ETH) for stocks and futures, with specific session times for New York, London, and overnight sessions.
Customizable Display: Users can toggle the visibility of specific levels, adjust line styles (solid, dashed, dotted), colors, thicknesses, and label settings (size, offset, and price inclusion).
Opening Range and Initial Balance: Plots the Opening Range (default: 9:30–10:00 AM EST) and Initial Balance (default: 9:30–10:30 AM EST) for intraday traders.
Tested Level Tracking: Optionally tracks untested or tested levels, hiding or showing them based on user preferences.
Overnight and T+2 Levels: Includes overnight high/low and T+2 (two days prior) levels for additional context.
VWAP Calculations: Computes VWAP and its standard deviation bands for daily, weekly, and monthly periods.
Holiday and Session Filters: Adjusts for market-specific conditions, such as Good Friday or shortened trading sessions.
Inputs and Customization
The indicator is organized into three main groups: Daily Levels, Weekly Levels, and Monthly Levels. Each group allows users to configure the following:
Visibility: Toggle whether to show levels (e.g., Show Daily Levels, Show Weekly Levels).
Session Times: Define session ranges (e.g., New York RTH: 9:30 AM–4:00 PM EST, Opening Range: 9:30–10:00 AM EST).
Line and Label Settings: Customize line colors, styles (solid, dashed, dotted), thickness, label text size (Tiny, Small, Normal, Large, Huge), label offset, and whether to include price values in labels.
Number of Periods: Specify how many previous days (1–40), weeks (1–20), or months (1–12) to display.
Tested/Untested Levels: Choose to keep untested levels or show tested levels (Open, High, Low, Close).
Timeframe for Calculations: Option to use a 30-second or 1-minute timeframe for Opening Range and Initial Balance calculations to accommodate different TradingView plans.
Key Levels
Daily Levels: Includes Current Day High/Low, Previous Day High/Low, Opening Range High/Mid/Low, Initial Balance High/Mid/Low, Globex Open, RTH Open, Midnight Open, London Open/Close/High/Low, Previous Day 50% (HL2/OC2), T+2 Open/Close/High/Low, Overnight High/Low, RTH Close, 5 PM Close, and VWAP with standard deviation bands.
Weekly Levels: Previous Week High/Low, 50% (HL2/OC2), Current Week Open, Previous Week Close, and VWAP with standard deviation bands.
Monthly Levels: Previous Month High/Low, 50% (HL2/OC2), Current Month Open, Previous Month Close, and VWAP with standard deviation bands.
Troubleshooting
Levels Not Displaying: Check if the timeframe is ≤ 30 minutes for daily levels and ensure session times are correct for your market.
Incorrect Prices: Verify that extended hours are enabled for ETH charts or disabled for RTH-only charts.
Too Many Lines/Labels: Reduce the number of previous days/weeks/months or disable unneeded levels.
Session Errors: Ensure session times are in UTC-5 (New York time) and match your asset’s trading hours.
License
This script is licensed under the Mozilla Public License 2.0. See mozilla.org for details.


Multi-Timeframe EMA Overlay [Smoothed Approximation]in.tradingview.com This indicator displays Exponential Moving Averages (EMAs) from multiple timeframes (5m, 15m, 1H, 4H, 1D) on a single chart, regardless of your current timeframe.
HOW IT WORKS
You choose a base EMA length (e.g., 20).
The script calculates equivalent lengths for other timeframes (e.g., for a 1H EMA while on a 1-minute chart: 20 × 60 = 1200 length).
These adjusted EMAs are then computed and plotted — giving a continuous, smooth curve rather than a stepped line.
KEY FEATURES
🟪 5m, 🟦 15m, 🟩 1H, 🟧 4H, 🟥 1D EMAs.
🧠 Smooth approximation — good for visual trend tracking without step lag.
🎛️ Toggle visibility for each timeframe EMA independently.
📈 Uses
Trend Confirmation:
Aligning short-term trades with higher timeframe trends (e.g., go long only when 15m & 1H EMAs are trending up).
Confluence Zones:
Price action near multiple EMA levels from different timeframes can indicate strong support/resistance zones.
Entry Filters:
Avoid trades against dominant higher timeframe trends.
Example: On a 5m chart, only go long if price > 1H EMA.
Reversal Watch:
EMA convergence or crossovers across timeframes can signal potential trend shifts.

TJR's BOS strategy 2.0 (improved version)BOS STRATEGY for the break of structures in an uptrend or a downtrend. used well for identifying wether or not strucutre has been broken to th upside or downside

PE Bands w/ Persistent EPS ProxyThis Pine Script is a valuation overlay for any stock or index, built around the idea of tracking and projecting P/E (Price-to-Earnings) multiple bands using trailing EPS and a growth assumption. Here's a full breakdown:
🔍 Purpose:
To visualize price bands based on valuation multiples (like 16x, 18x, 20x, etc.) of forward EPS, estimated from actual reported EPS over the last 4 quarters.
🧱 Core Components:
✅ @version=6
Specifies the latest Pine Script version (v6), ensuring compatibility with the newest syntax.
✅ indicator(...)
Declares a chart overlay indicator titled 'PE Bands w/ Persistent EPS Proxy', meaning the plots will appear on top of the price chart.
1. 📈 Growth Assumption Input
pinescript
Copy
Edit
Growth = input.float(1.08, 'Growth')
User input for projected forward EPS growth (default: +8%). This models earnings growth from trailing 12 months to forward 12 months.
2. 🧮 Retrieve EPS Data
pinescript
Copy
Edit
epsRaw = request.earnings(syminfo.tickerid, earnings.actual, gaps = barmerge.gaps_off)
Uses the built-in request.earnings() function to fetch actual EPS.
Works with any symbol that supports earnings data.
barmerge.gaps_off ensures EPS only shows on report bars (not filled in between).
3. 🧠 Persistent Memory for Last 4 EPS Values
pinescript
Copy
Edit
var float eps1 = na
...
if not na(epsRaw)
eps4 := eps3
eps3 := eps2
eps2 := eps1
eps1 := epsRaw
Implements a shift register: keeps track of the last 4 quarterly EPS values, so it can compute a full TTM (trailing 12-month) EPS even though epsRaw only updates quarterly.
4. 📊 Trailing 12-Month EPS
pinescript
Copy
Edit
epsTTM = na(eps1) or na(eps2) or na(eps3) or na(eps4) ? na : eps1 + eps2 + eps3 + eps4
Sums the most recent 4 quarters to get a TTM earnings proxy.
If any value is still na, the result is na.
5. 🔮 Forward EPS Estimation
pinescript
Copy
Edit
fwdEPS = epsTTM * Growth
Projects forward EPS using a growth multiplier (1.08 = +8%).
You could customize this to vary over time (e.g., macro-modelled growth).
6. 📐 Valuation Bands
pinescript
Copy
Edit
pe16 = fwdEPS * 16
...
pe24 = fwdEPS * 24
Calculates price levels the stock/index would be trading at under different valuation multiples of forward EPS.
These become bands: 16x, 18x, 20x, etc.
7. 📉 Plot Bands
pinescript
Copy
Edit
plot(pe16, ...)
...
plot(pe24, ...)
Draws horizontal or sloped bands that reflect valuation ranges.
If SPX is above the 22x or 24x band, you might consider the market overvalued.
If it’s near 16x, potentially undervalued (depending on forward EPS quality).
✅ Summary:
This is a dynamic, earnings-based valuation overlay for use on equity or index charts. It uses:
Real EPS data (as it gets reported)
Persistent memory to calculate trailing 12M EPS
Growth modeling to estimate forward EPS
Price targets for different forward P/E multiples

MFI Candles MTF TableMFI Candles + Multi-Timeframe Table | by julzALGO
This open-source script visualizes the Money Flow Index (MFI) in a new format — as candles instead of a traditional oscillator line. It provides a clean, volume-driven view of momentum and pressure, ideal for traders seeking more actionable and visual cues than a typical MFI plot.
What Makes It Unique:
• Plots "MFI Candles" — synthetic candles based on smoothed MFI values using a selected timeframe (default: 1D), giving a new way to read volume flow.
• Candles reflect momentum: green if MFI rises, red if it falls.
• Background turns red when MFI is overbought (≥ 80) or green when oversold (≤ 20).
Multi-Timeframe Strength Table:
• Displays MFI values from 15m, 1h, 4h, and 1D timeframes — all in one dashboard.
• Color-coded for quick recognition: 🔴 Overbought, 🟢 Oversold.
• Values are smoothed with linear regression for better clarity.
Custom Settings:
• MFI calculation length
• Smoothing factor
• Candle source timeframe
• Toggle table and OB/OS background
How to Use:
- Use MFI Candles to monitor momentum shifts based on money flow.
- Use the Multi-Timeframe Table to identify when multiple timeframes align — helpful for timing entries and exits.
- Watch the background for extreme conditions (OB/OS) that may signal upcoming reversals or pressure exhaustion.
Happy Trading!

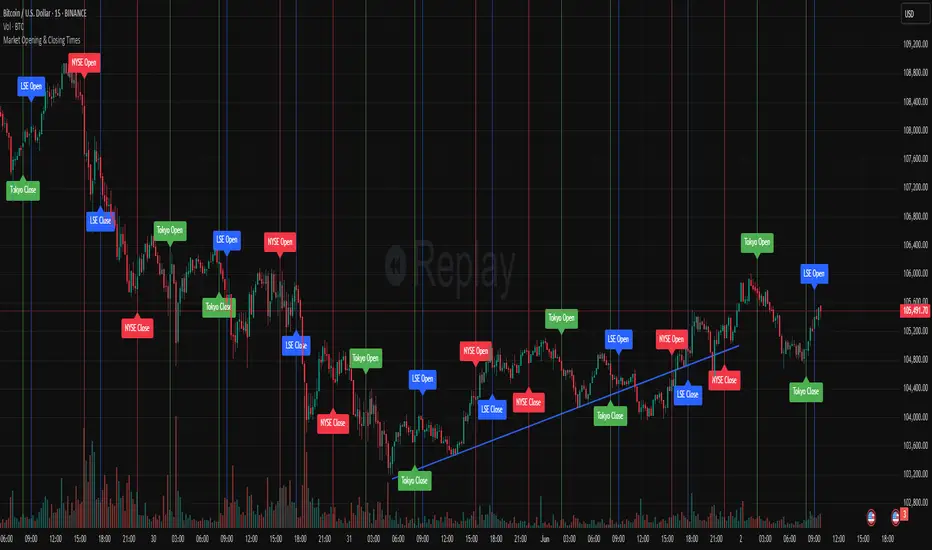
Market Opening & Closing TimesThis indicator highlights the opening and closing times of major global markets (NYSE, LSE, Tokyo) on any chart timeframe. Users can toggle the display of lines and labels, and customize colors per market.
Features:
Toggle each market’s Open/Close separately
Global toggles: Show/Hide all lines or labels
Customizable colors for NYSE, LSE, and Tokyo markers
Accurate event detection using timezone-aware timestamp checks within each bar
Annualized Historical VolatilityAnnualized, realized vol calculated as
hv = std_dev(log returns) x sqrt(trading periods)

Breakout Strength Radar🚀 What It Does:
The Breakout Strength Radar tells you:
✅ Trend direction: Bullish / Bearish / Neutral
✅ Trend slope: Rising / Falling / Flat
→ Is the trend gaining strength or fading?
✅ Momentum: Strong Bullish / Strong Bearish / Neutral
→ Is there fuel behind the move?
✅ Volatility condition: Expanding / Contracting / Stable
→ Is the market opening up (breakout likely) or squeezing (consolidation)?
✅ Breakout Watch:
→ Tells you when the market just shifted from a squeeze to expansion — this is prime breakout territory.
🏗️ How It Works Under The Hood:
📈 Trend:
→ Compares EMA 50 vs EMA 200. Standard institutional trend filter.
⛰️ Slope:
→ Checks whether EMA50 is rising, falling, or flat based on its slope over the past 5 bars.
🚀 Momentum:
→ Uses RSI:
→ RSI > 55 → Momentum Bullish
→ RSI < 45 → Momentum Bearish
→ RSI between 45-55 → Neutral / No strong pressure
🌪️ Volatility:
→ Uses Bollinger Band Width (BB Width):
→ Expanding → Breakouts, volatility rising.
→ Contracting → Squeeze, compression, range.
💥 Breakout Watch:
→ Triggers when volatility was contracting for 5 candles → then starts expanding.
→ This often precedes massive directional moves.
🎯 How to Use It for Swing Trades:
🔥 Prime Swing Setup Checklist:
→ ✅ Trend: Bullish or Bearish (no Neutral).
→ ✅ Slope: Rising (Bull) or Falling (Bear).
→ ✅ Momentum: Strong Bullish or Strong Bearish.
→ ✅ Volatility: Expanding.
→ ✅ Breakout Watch: Active → If it just flipped from contraction to expansion, this is often the start of the move.
→ → This is a high-conviction swing setup.
🔥 Swing Entry Example (Long):
→ Trend: Bullish
→ Slope: Rising
→ Momentum: Strong Bullish
→ Volatility: Expanding
→ Breakout Watch: Active (optional but ideal)
→ ✅ → Look for pullbacks to support zones, moving averages, or breaks of recent highs.
→ Entry → On pullback confirmation or breakout candle.
→ Stop → Below swing low / ATR stop.
→ TP → Based on Risk/Reward or prior highs.
🔥 Swing Entry Example (Short):
→ Trend: Bearish
→ Slope: Falling
→ Momentum: Strong Bearish
→ Volatility: Expanding
→ ✅ Ideal when price is breaking down from a squeeze or retesting failed support.
🚫 Avoid Trades When:
Trend is Neutral.
Slope is Flat.
Volatility is Contracting.
Momentum is Neutral.
→ These are chop conditions → low win rate → avoid.
🧠 Pro Tips:
📊 Combine it with structure: Use it with supply/demand, support/resistance zones, or liquidity levels.
⏳ Hold during expansions: As long as Volatility = Expanding, the move often continues.
🚩 Exit or tighten stops if: Volatility contracts and slope flattens → move may be done.
🔥 Breakout Watch Active: Means a squeeze just broke → often the start of large moves.
🏆 Bottom Line:
→ This tool isn’t about buy/sell signals.
→ It’s a market condition scanner that tells you:
“Is this a time to hunt aggressive swing trades or stand down?”
→ When all conditions align → You have a high-probability trade environment.

Fair Value Gap (FVG) Detector — ICT SMC BasedThis is an open-source Fair Value Gap (FVG) indicator, based on the principles taught in ICT (Inner Circle Trader) and Smart Money Concepts (SMC). It identifies imbalances or inefficiencies in price action where the body/wick of the middle candle in a three-candle formation does not overlap with the first and third candles.
🔹 What is an FVG?
An FVG is formed when there is a price imbalance, typically between three consecutive candles:
A bullish FVG forms when the low of candle 1 is above the high of candle 3.
A bearish FVG forms when the high of candle 1 is below the low of candle 3.
These gaps are believed to represent areas of institutional activity and are often used as potential entries, targets, or reaction zones.
🔹 Features:
Detects both bullish and bearish FVGs
Clean chart visuals using colored boxes
Adjustable box opacity and text alignment
Option to show or hide filled FVGs
Optional filter to only display gaps above a minimum size (e.g., 100 points)
Multi-timeframe support (if enabled in script settings)
Box label customization (text alignment: center/left/right)
🔹 How to Use:
Use the indicator on any timeframe or instrument
Larger gaps may indicate stronger price inefficiencies
Combine with market structure, liquidity zones, or order blocks for confirmation
This version is open-source, so traders can view and adapt the logic as needed.
The indicator is designed for transparency, education, and clarity of Smart Money Concepts.

MABB55 Full-CrossIndicates when the MABB55 crosses the:
MABB13
MABB21
EMA8
When a full crossover happens, where the long-term average (MABB 55) moves above or below the faster ones (EMA 8, MABB 13, and 21) it means the trend has shifted so strongly and consistently that it overcomes short-term price movement. That kind of shift usually signals a trend reversal.
Bullish reversals with the MABB55 crossing from above, indicated by a green arrowl.
Bearish reversals with the MABB55 crossing from below, indicated by a red arrow.
