Indicators and strategies


Session Backgrounds (Asia, London, US) - Weekdays Onlythis is to mark asia, london, us session so we can easily see what is current session while trading

8 AM & 9 AM NY Candle HighlighterThis indicator helps me to know when the 9am NY candle has closed above or below the previous candle.

Trading session High/Low (Lumiere)Trading session High/Low
What it does:
Plots the High and Low for each session (Asia, London, New York) as horizontal zones that “snap” to the first true extreme of the session and then extend right.
Key points:
Snap‑to‑extreme only: Lines don’t draw at the open; they appear only once price makes a new session high or low, and anchor exactly at that bar.
Persistent until next session: Once drawn, each session’s lines stay on the chart after the session ends, and are cleared only when that same session next opens (or when you hide it).
Three configurable sessions:
Asia: 18:00–03:00 (UTC‑4)
London: 03:00–09:30 (UTC‑4)
New York: 09:30–16:00 (UTC‑4)
Customizable appearance:
You can toggle each session on/off, choose its color, and set line width.
The time that is already set on the different sessions is based on the standard session open/close. If you want to change it, it will refer to the NY time, UTC -4.

15m EMA 50 CloudDescription:
The 15m EMA 50 Cloud is a simple but powerful tool designed for scalpers and intraday traders who hunt for low timeframe patterns while staying anchored to higher timeframe trend context.
This indicator displays the 50-period EMA and its volatility cloud from the 15-minute chart on any timeframe - including 1m, 3m, or 5m. The cloud adapts dynamically and remains visible even when you zoom into lower timeframes, helping you instantly see whether price is trading above, below or within the 15m trend structure.
Features:
* Plots the 15-minute 50 EMA Cloud on any chart, regardless of your selected timeframe.
* Cloud width is based on 15m price volatility (standard deviation), inspired by the popular "Traders Reality" indicator.
* Option to enable or hide the EMA line for a cleaner look.
* Customizable colors for the cloud fill, border, and EMA line.
* Works with all markets and all symbols.
How to Use:
* Perfect for scalpers who want to spot micro patterns (e.g., on 1m or 3m charts) while keeping
the 15m EMA cloud as a visual "road map".
* Use the cloud as a dynamic support/resistance zone or to define higher timeframe trend bias.
* Combine with your favorite price action or orderflow setups for multi-timeframe confluence.
Settings:
* Toggle EMA line ON/OFF.
* Adjust cloud and border colors for your chart style.
For educational purposes only. This indicator does not provide financial advice or signals. Always use proper risk management.
⚠️ Important Notice
This tool is provided for educational and informational purposes only . It is designed to assist in technical analysis learning and visual chart study.
It is not intended to be used as financial advice, a buy/sell signal, or any form of investment recommendation .
By using this indicator, you acknowledge that all actions you take are your own and you assume full responsibility for any decisions made.

SCPEM - Socionomic Crypto Peak Model (0-85 Scale)SCPEM Indicator Overview
The SCPEM (Socionomic Crypto Peak Evaluation Model) indicator is a TradingView tool designed to approximate cycle peaks in cryptocurrency markets using socionomic theory, which links market behavior to collective social mood. It generates a score from 0-85 (where 85 signals extreme euphoria and high reversal risk) and plots it as a blue line on the chart for visual backtesting and real-time analysis.
#### How It Works
The indicator uses technical proxies to estimate social mood factors, as Pine Script cannot fetch external data like sentiment indices or social media directly. It calculates a weighted composite score on each bar:
- Proxies derive from price, volume, and volatility data.
- The raw sum of factor scores (max ~28) is normalized to 0-85.
- The score updates historically for backtesting, showing mood progression over time.
- Alerts trigger if the score exceeds 60, indicating high peak probability.
Users can adjust inputs (e.g., lengths for RSI or pivots) to fine-tune for different assets or timeframes.
Metrics Used (Technical Proxies)
Crypto-Specific Sentiment
Approximated by RSI (overbought levels indicate greed).
Social Media Euphoria
Based on volume relative to its SMA (spikes suggest herding/FOMO).
Broader Social Mood Proxies
Derived from ATR volatility (high values signal uncertain/mixed mood).
Search and Cultural Interest Proxied by OBV trend (rising accumulation implies growing interest).
Socionomic Wildcard
Uses Bollinger Band width (expansion for positive mood, contraction for negative).
Elliott Wave Position
Counts recent price pivots (more swings indicate later wave stages and exhaustion).

CVDoogle (CVDoogle Indicator)This is a free simple line indicator that represents Cumulative Volume Delta. The script has been tuned specifically to most popular timeframes to be more accurate of the timeframe of the chart. This may make the line appear less smooth than other indicators, but should be more accurate to the current timeframe of the chart.
This indicator was created to be used along with the following to create a Poor Man's Exochart:
Use Volume Footprint instead of Candles on the TradingView chart
Settings:
Row Size - Auto (ATR)
ATR Length - 9
Display - Cluster
Type - Delta
Add Open Interest Suite - By Leviathan indicator
Timeframes covered by this indicator
15s
30s
1m
2m
3m
5m
6m
10m
12m
15m
24m
30m
45m
1H
2H
3H
4H
5H
6H
8H
12H
1D

MP MTF FVG/IFVG/BPRMP MTF FVG/IFVG/BPR — Script Description
Overview:
The “MP MTF FVG/IFVG/BPR” indicator is a multi-timeframe (MTF) trading tool that automatically identifies and visualizes three key Smart Money Concepts (SMC) price imbalances:
FVG (Fair Value Gap)
IFVG (Improved/Mitigated Fair Value Gap)
BPR (Balanced Price Range)
The script allows traders to monitor these liquidity zones across multiple custom timeframes (up to 6), helping them spot high-probability trade setups and market structure shifts. Designed for intraday and swing traders, it adapts to any market—forex, stocks, indices, or crypto.
Key Features:
Multi-Timeframe Support:
Select up to 6 different timeframes for simultaneous analysis.
Toggle visibility, set custom max number of imbalances to show per TF, and choose custom colors for each type and timeframe.
FVG Detection:
Automatically marks Fair Value Gaps (price imbalances where rapid moves may leave “inefficiency” between candles), highlighting both bullish and bearish gaps.
IFVG Identification:
Optionally marks mitigated or improved FVGs based on user logic or additional filters, to highlight areas where imbalances have been partially filled.
BPR Highlighting:
Detects and draws Balanced Price Ranges—zones where price efficiently rebalances after filling a previous gap or sweep.
Visualization:
Draws clean colored boxes/lines for each zone, with options for border style, fill opacity, and label display (including timeframe tags).
Option to enable or disable the midline for BPRs.
Performance Optimization:
Limits max active boxes/lines per TF to prevent chart clutter or performance lag.
Works Only On Closed Bars:
The indicator is designed to avoid drawing liquidity zones on unfinished candles, ensuring only valid, confirmed imbalances are shown.
Use Cases:
Identify high-probability entry/exit zones based on institutional trading concepts.
Spot potential reversal, retracement, or continuation areas.
Combine with your own execution model or other SMC tools for more robust strategies.
Parameters:
Enable/disable each timeframe (TF1–TF6)
Custom timeframe selection for each
Max FVGs, IFVGs, BPRs per TF
Custom color for each type/timeframe
Optional BPR midline and color
Notes:
This script is for educational purposes and should be used with risk management.
For best results, combine with additional confirmation signals and trade planning.

z-score-calkusi-v1.143z-scores incorporate the moment of N look-back bars to allow future price projection.
z-score = (X - mean)/std.deviation ; X = close
z-scores update with each new close print and with each new bar. Each new bar augments the mean and std.deviation for the N bars considered. The old Nth bar falls away from consideration with each new historical bar.
The indicator allows two other options for X: RSI or Moving Average.
NOTE: While trading use the "price" option only.
The other two options are provided for visualisation of RSI and Moving Average as z-score curves.
Use z-scores to identify tops and bottoms in the future as well as intermediate intersections through which a z-score will pass through with each new close and each new bar.
Draw lines from peaks and troughs in the past through intermediate peaks and troughs to identify projected intersections in the future. The most likely intersections are those that are formed from a line that comes from a peak in the past and another line that comes from a trough in the past. Try getting at least two lines from historical peaks and two lines from historical troughs to pass through a future intersection.
Compute the target intersection price in the future by clicking on the z-score indicator header to see a drag-able horizontal line to drag over the intersection. The target price is the last value displayed in the indicator's status bar after the closing price.
When the indicator header is clicked, a white horizontal drag-able line will appear to allow dragging the line over an intersection that has been drawn on the indicator for a future z-score projection and the associated future closing price.
With each new bar that appears, it is necessary to repeat the procedure of clicking the z-score indicator header to be able to drag the drag-able horizontal line to see the new target price for the selected intersection. The projected price will be different from the current close price providing a price arbitrage in time.
New intermediate peaks and troughs that appear require new lines be drawn from the past through the new intermediate peak to find a new intersection in the future and a new projected price. Since z-score curves are sort of cyclical in nature, it is possible to see where one has to locate a future intersection by drawing lines from past peaks and troughs.
Do not get fixated on any one projected price as the market decides which projected price will be realised. All prospective targets should be manually updated with each new bar.
When the z-score plot moves outside a channel comprised of lines that are drawn from the past, be ready to adjust to new market conditions.
z-score plots that move above the zero line indicate price action that is either rising or ranging. Similarly, z-score plots that move below the zero line indicate price action that is either falling or ranging. Be ready to adjust to new market conditions when z-scores move back and forth across the zero line.
A bar with highest absolute z-score for a cycle screams "reversal approaching" and is followed by a bar with a lower absolute z-score where close price tops and bottoms are realised. This can occur either on the next bar or a few bars later.
The indicator also displays the required N for a Normal(0,1) distribution that can be set for finer granularity for the z-score curve.This works with the Confidence Interval (CI) z-score setting. The default z-score is 1.96 for 95% CI.
Common Confidence Interval z-scores to find N for Normal(0,1) with a Margin of Error (MOE) of 1:
70% 1.036
75% 1.150
80% 1.282
85% 1.440
90% 1.645
95% 1.960
98% 2.326
99% 2.576
99.5% 2.807
99.9% 3.291
99.99% 3.891
99.999% 4.417
9-Jun-2025
Added a feature to display price projection labels at z-score levels 3, 2, 1, 0, -1, -2, 3.
This provides a range for prices available at the current time to help decide whether it is worth entering a trade. If the range of prices from say z=|2| to z=|1| is too narrow, then a trade at the current time may not be worth the risk.
Added plot for z-score moving average.
28-Jun-2025
Added Settings option for # of Std.Deviation level Price Labels to display. The default is 3. Min is 2. Max is 6.
This feature allows likelihood assessment for Fibonacci price projections from higher time frames at lower time frames. A Fibonacci price projection that falls outside |3.x| Std.Deviations is not likely.
Added Settings option for Chart Bar Count and Target Label Offset to allow placement of price labels for the standard z-score levels to the right of the window so that these are still visible in the window.
Target Label Offset allows adjustment of placement of Target Price Label in cases when the Target Price Label is either obscured by the price labels for the standard z-score levels or is too far right to be visible in the window.
9-Jul-2025
z-score 1.142 updates:
Displays in the status line before the close price the range for the selected Std. Deviation levels specified in Settings and |z-zMa|.
When |z-zMa| > |avg(z-zMa)| and zMa rising, |z-zMa| and zMa displays in aqua.
When |z-zMa| > |avg(z-zMa)| and zMa falling, |z-zMa| and zMa displays in red.
When |z-zMa| <= |avg(z-zMa)|, z and zMa display in gray.
z usually crosses over zMa when zMa is gray but not always. So if cross-over occurs when zMa is not gray, it implies a strong move in progress.
Practice makes perfect.
Use this indicator at your own risk

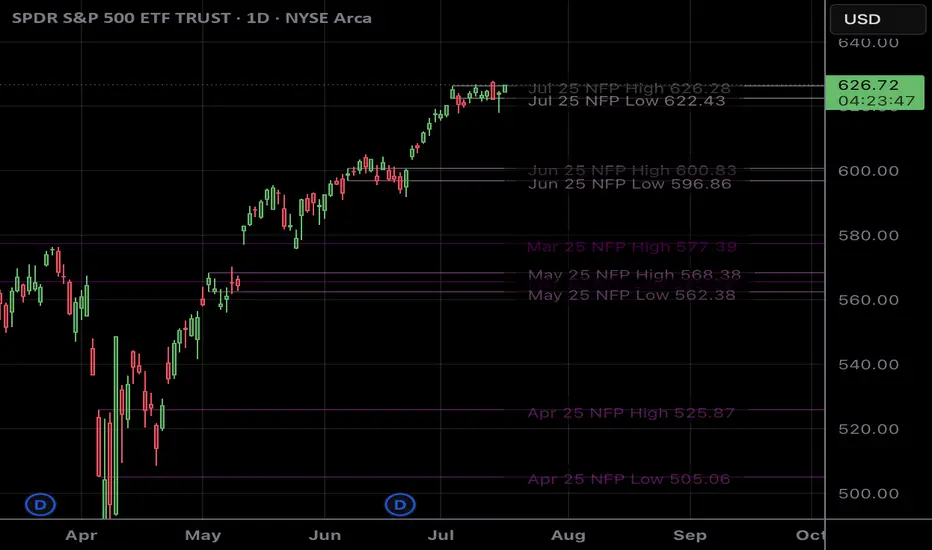
NFP RangesPlots the NFP daily ranges for NFP days. Includes extended hours ranges when the time frame is sub 1D, otherwise, only the daily range is taken.
NFP Dates are pre-populated through 2029 and historically through 2022. Will update script to include farther-out dates before they become necessary.
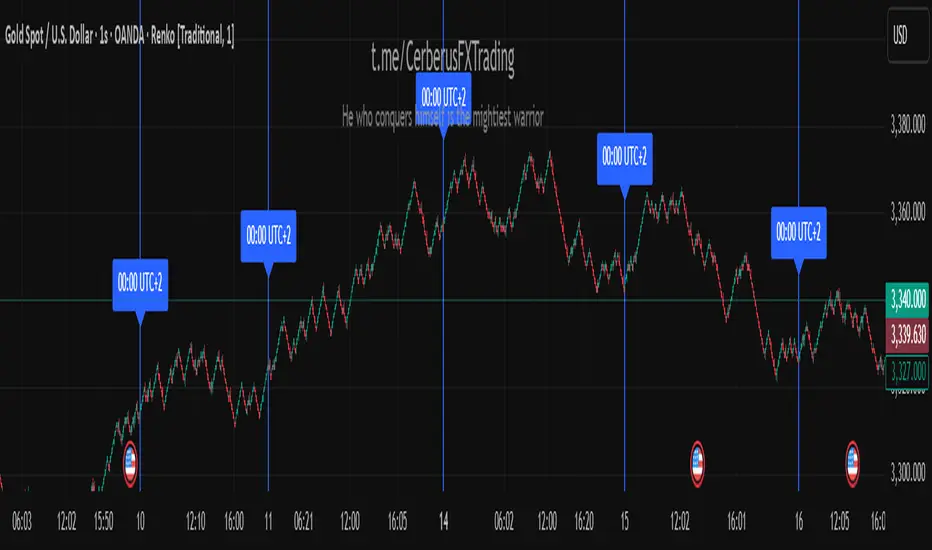
CerberusFX Midnight Line UTC+2Daily Vertical Line UTC+2
Plots a vertical blue line spanning the full chart height at the start of each day at 00:00 UTC+2 (or the next available candle). Includes a label ("00:00 UTC+2") above the candle for clarity. Ideal for separating trading days on intraday charts in the UTC+2 timezone.
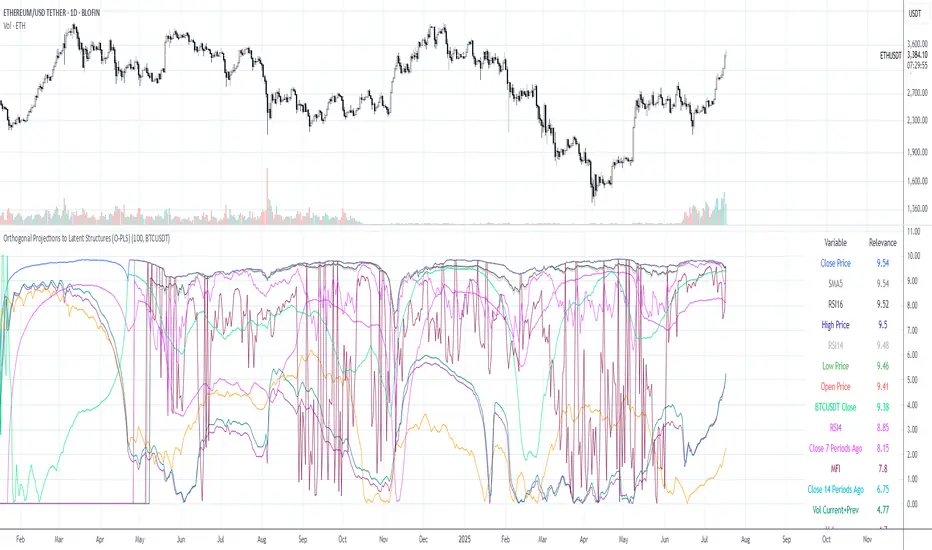
Orthogonal Projections to Latent Structures (O-PLS)Version 0.1
Orthogonal Projections to Latent Structures (O-PLS) Indicator for TradingView
This indicator, named "Orthogonal Projections to Latent Structures (O-PLS)", is designed to help traders understand the relevance or predictive power of various market variables on the future close price of the asset it's applied to. Unlike standard correlation coefficients that show a simple linear relationship, O-PLS aims to separate variables into "predictive" (relevant to Y) and "orthogonal" (irrelevant noise) components. This Pine Script indicator provides a simplified proxy of the relevance score derived from O-PLS principles.
Purpose of the Indicator
The primary purpose of this indicator is to identify which technical factors (such as price, volume, and other indicators) have the strongest relationship with the future price movement of the current trading instrument. By providing a "relevance score" for each input variable, it helps traders focus on the most influential data points, potentially leading to more informed trading decisions.
Inputs
The indicator offers the following user-definable inputs:
* **Lookback Period:** This integer input (default: 100, min: 10, max: 500) determines the number of past bars used to calculate the relevance scores for each variable. A longer lookback period considers more historical data, which can lead to smoother, less reactive scores but might miss recent shifts in variable importance.
* **External Asset Symbol:** This symbol input (default: `BINANCE:BTCUSDT`) allows you to specify an external asset (e.g., `BINANCE:ETHUSDT`, `NASDAQ:TSLA`) whose close price will be included in the analysis as an additional variable. This is useful for cross-market analysis to see how other assets influence the current chart.
* **Plot Visibility Checkboxes (e.g., "Plot: Open Price Relevance", "Plot: Volume Relevance", etc.):** These boolean checkboxes allow you to toggle the visibility of individual relevance score plots on the chart, helping to declutter the display and focus on specific variables.
Outputs
The indicator provides two main types of output:
Relevance Score Plots: These are lines plotted in a separate pane below the main price chart. Each line corresponds to a specific market variable (Open Price, Close Price, High Price, Low Price, Volume, various RSIs, SMAs, MFI, and the External Asset Close). The value of each line represents the calculated "relevance score" for that variable, typically scaled between 0 and 10. A higher score indicates a stronger predictive relationship with the future close price.
Sorted Relevance Table : A table displayed in the top-right corner of the chart provides a clear, sorted list of all analyzed variables and their corresponding relevance scores. The table is sorted in descending order of relevance, making it easy to identify the most influential factors at a glance. Each variable name in the table is colored according to its plot color, and the external asset's name is dynamically displayed without the "BINANCE:" prefix.
How to Use the Indicator
1. **Add to Chart:** Apply the "Orthogonal Projections to Latent Structures (O-PLS)" indicator to your desired trading chart (e.g., ETH/USDT).
2. **Adjust Inputs:**
* **Lookback Period:** Experiment with different lookback periods to see how the relevance scores change. A shorter period might highlight recent correlations, while a longer one might show more fundamental relationships.
* **External Asset Symbol:** If you trade BTC/USDT, you might add ETH/USDT or SPX as an external asset to see its influence.
3. **Analyze Relevance Scores:**
* **Plots:** Observe the individual relevance score plots over time. Are certain variables consistently high? Do scores change before significant price moves?
* **Table:** Refer to the sorted table on the latest confirmed bar to quickly identify the top-ranked variables.
4. **Incorporate into Strategy:** Use the insights from the relevance scores to:
* Prioritize certain indicators or price actions in your trading strategy. For example, if "Volume" has a high relevance score, it suggests volume confirmation is critical for future price moves.
* Understand the influence of inter-market relationships (via the External Asset Close).
How the Indicator Works
The indicator works by performing the following steps on each bar:
1. **Data Fetching:** It gathers historical data for various price components (open, high, low, close), volume, and calculated technical indicators (SMA, RSI, MFI) for the specified `lookback` period. It also fetches the close price of an `External Asset Symbol` .
2. **Standardization (Z-scoring):** All collected raw data series are standardized by converting them into Z-scores. This involves subtracting the mean of each series and dividing by its standard deviation . Standardization is crucial because it brings all variables to a common scale, preventing variables with larger absolute values from disproportionately influencing the correlation calculations.
3. **Correlation Calculation (Proxy for O-PLS Relevance):** The indicator then calculates a simplified form of correlation between each standardized input variable and the standardized future close price (Y variable) . This correlation is a proxy for the relevance that O-PLS would identify. A high absolute correlation indicates a strong linear relationship.
4. **Relevance Scaling:** The calculated correlation values are then scaled to a range of 0 to 10 to provide an easily interpretable "relevance score" .
5. **Output Display:** The relevance scores are presented both as time-series plots (allowing observation of changes over time) and in a real-time sorted table (for quick identification of top factors on the current bar) .
How it Differs from Full O-PLS
This indicator provides a *simplified proxy* of O-PLS principles rather than a full, mathematically rigorous O-PLS model. Here's why and how it differs:
* **Dimensionality Reduction:** A full O-PLS model would involve complex matrix factorization techniques to decompose the independent variables (X) into components that are predictive of Y and components that are orthogonal (unrelated) to Y but still describe X's variance. Pine Script's array capabilities and computational limits make direct implementation of these matrix operations challenging.
* **Orthogonal Components:** A true O-PLS model explicitly identifies and removes orthogonal components (noise) from the X data that are unrelated to Y. This indicator, in its simplified form, primarily focuses on the direct correlation (relevance) between each X variable and Y after standardization, without explicitly modeling and separating these orthogonal variations.
* **Predictive Model:** A full O-PLS model is ultimately a predictive model that can be used for regression (predicting Y). This indicator, however, focuses solely on **identifying the relevance/correlation of inputs to Y**, rather than building a predictive model for Y itself. It's more of an analytical tool for feature importance than a direct prediction engine.
* **Computational Intensity:** Full O-PLS involves Singular Value Decomposition (SVD) or Partial Least Squares (PLS) algorithms, which are computationally intensive. The indicator uses simpler statistical measures (mean, standard deviation, and direct correlation calculation over a lookback window) that are feasible within Pine Script's execution limits.
In essence, this Pine Script indicator serves as a practical tool for gaining insights into variable relevance, inspired by the spirit of O-PLS, but adapted for the constraints and common use cases of a TradingView environment.
Oz SIGNAL PRO v6 is a powerful 15-minute trend-following indicator tailored for precision trading. It detects Break of Structure (BOS) and CHoCH signals with built-in volume confirmation and overlays premium/discount zones directly on the chart. The indicator includes:
🔹 Visual buy/sell labels at breakout points
🔸 Dynamic EMA and VWAP for trend filtering
🟩 Automatic support/resistance zones
🔔 Alert-ready for signal automation
Ideal for intraday traders seeking clean, high-confidence signals.
Upgrade-ready: Easily extend with FVGs, order blocks, liquidity sweeps & backtesting.

TMA Lock - Triple Moving Averages with Timeframe ControlKeep your 50, 100, and 200-day moving averages consistent across all chart timeframes! No more recalculating MAs when switching from daily to hourly charts.
Key Features:
Timeframe Lock - MAs stay true to your selected timeframe (daily, weekly, etc.) regardless of chart view
Fully Customizable - Adjust periods, colors, line styles, and smoothing strength


MA Deviation
This indicator visualizes the percentage deviation between up to 3 configurable moving averages (MA), helping traders assess trend momentum and potential overextension.
✅ Key Features
Supports multiple MA types: Choose from SMA, EMA, WMA, RMA, VWMA, and HMA.
Set up to 3 custom MAs with different periods.
Plots the deviation (%) between each pair of selected MAs.
Background color highlights extreme deviations (green = strong positive deviation, red = strong negative deviation).
Data Window flag (1 or 0) shows whether background highlight is active.
⚠️ Notes
Deviation percentages are not predictive, but useful for identifying trend strength or market overheating.
Especially useful for trend analysis, not for exact entry signals.
Even if not all lines are shown, the background color may still appear based on the enabled MA comparisons.
このインジケーターは、3本の移動平均線(MA)の乖離率を視覚化し、相場の過熱感やトレンドの強さを判定するためのツールです。
✅ 主な機能
複数の移動平均タイプに対応:SMA, EMA, WMA, RMA, VWMA, HMAから選択可能。
最大3本の移動平均を自由に設定可能。
それぞれのMA間の乖離率(%)をチャートにプロット。
指定した閾値を超えた時に背景色を表示(緑=乖離が正方向に大きい、赤=負方向に大きい)。
データウィンドウ上で「背景表示フラグ」も確認可能(サインが出ているかどうかが数値で確認できます)。
⚠️ 注意事項
乖離率は過去の価格と比較したものであり、将来の価格を保証するものではありません。
短期トレードよりも、トレンドの強弱や過熱感の把握に適しています。
複数のMAを使用しない場合でも、背景色は他の設定されたMAペアで判定されることにご注意ください。

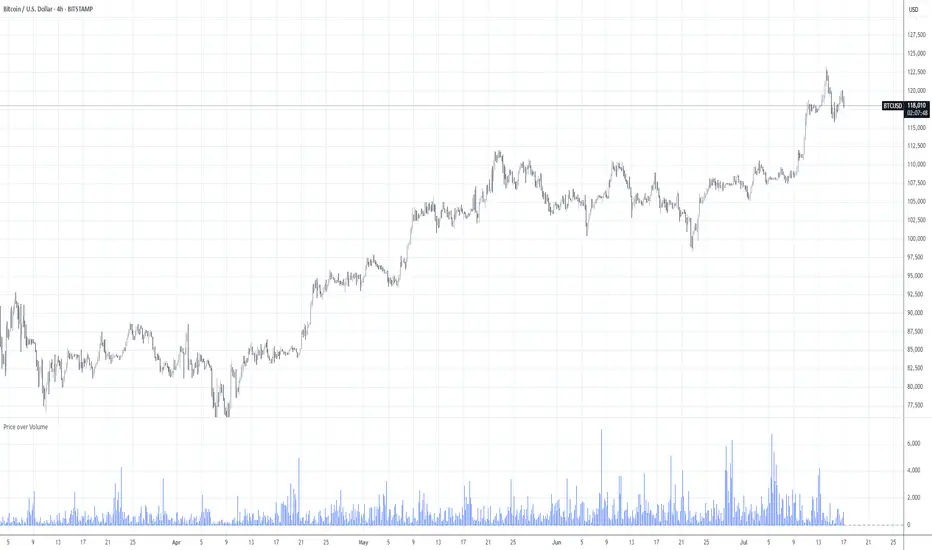
Price over VolumeVersion 0.1
Price over Volume Indicator
Description
The Price over Volume indicator calculates the ratio of the closing price to the trading volume (price / volume) for the current chart's symbol and displays it as a histogram in a separate pane. A horizontal zero line is included as a reference to highlight positive and negative values or periods of undefined data (e.g., zero volume). The indicator is designed to help traders analyze the relationship between price movements and trading volume.
Insights Provided
Price-Volume Dynamics: The indicator shows how price per unit of volume fluctuates, offering insights into market efficiency and liquidity. High ratios may indicate low volume relative to price, suggesting potential volatility or thin markets, while low ratios may reflect high volume supporting price stability.
Trend and Momentum Analysis: Spikes or trends in the price-to-volume ratio can signal significant market events, such as buying/selling pressure or low liquidity periods, helping traders identify potential reversals or continuations.
Zero Line Reference: The zero line helps identify periods where the ratio is undefined (e.g., zero volume) or negative (if applicable), aiding in the interpretation of market conditions.
Volume Sensitivity: By normalizing price by volume, the indicator highlights how volume influences price movements, which is useful for assessing the strength of trends or breakouts.
How to Use
Setup: Apply the indicator to any chart with price and volume data (e.g., stocks, cryptocurrencies like BINANCE:BTCUSDT). The histogram appears in a separate pane below the main chart.
Interpretation :
High Ratios: Indicate low trading volume relative to price, potentially signaling overbought conditions or low liquidity. Use with caution in thin markets.
Low Ratios: Suggest high volume supporting price levels, indicating stronger market participation or stability.
Spikes: Watch for sudden increases in the ratio, which may precede volatility or significant price moves.
Zero Line: Periods where the histogram is absent (due to zero volume) indicate no trading activity, useful for identifying illiquid periods.
Trading Applications:
Confirmation Tool: Combine with other indicators (e.g., RSI, MACD) to confirm trend strength. A rising price-to-volume ratio with a price uptrend may indicate weakening volume support, suggesting a potential reversal.
Volume Analysis: Use alongside volume-based indicators (e.g., OBV, VWAP) to assess whether price movements are backed by sufficient volume.
Scalping/Day Trading: Monitor intraday ratio changes to identify high-impact periods with low volume, which may offer short-term trading opportunities.
Customization: Adjust the histogram color or style (e.g., change to line plot) via the Pine Editor to suit your preferences. Consider adding smoothing (e.g., moving average) for cleaner signals.
Notes
Data Requirements: Ensure the chart’s symbol has valid volume data. Symbols with no volume (e.g., some forex pairs) will result in undefined (na) values.
Limitations: The indicator is sensitive to zero-volume periods, which may cause gaps in the histogram. Use on high-liquidity symbols for best results.
Performance: Lightweight and efficient, suitable for all timeframes.
This indicator is ideal for traders seeking to understand the interplay between price and volume, offering a unique perspective on market dynamics for informed trading decisions.
MTF Trend Table - Manual InputMTF Trend Table - Manual Input
Description:
This indicator displays a simple and clear multi-timeframe (MTF) trend table in the upper right corner of your chart. You can manually set the current trend direction (Up, Down, or Neutral) for each timeframe: Monthly, Weekly, Daily, 4h, 1h, and 15min. The table shows the status of each timeframe with colored backgrounds—green for Up, red for Down, and gray for Neutral—making it easy to monitor trend alignment across different timeframes at a glance.
Features:
Manual selection of trend direction for each timeframe.
Color-coded status: green (Up), red (Down), gray (Neutral).
Quickly visualize trend alignment across Monthly, Weekly, Daily, 4h, 1h, and 15min.
Table is positioned in the top right corner of the chart for easy reference.
How to use:
Open the indicator settings and select the trend direction for each timeframe based on your own analysis. Use this tool as a visual aid to track and confirm trend bias in your trading system.

Option Auto Anchored VWAPThis indicator automatically shows two Anchored VWAP lines.
The first gets placed on the very first candle of the chart.
The second is set on the last or current day you select in the settings.

ATR Stop Loss Non-Decreasing & LineThe script calculates a custom stop-loss level based on the Average True Range (ATR) indicator, ensuring that this stop-loss level never decreases from one bar to the next unless a reset condition is met. It also visually displays the ATR value and the calculated stop-loss level as a line on the chart.
