🔥WHY ALTCOINS FOLLOW THE BTC PRICE? A FULL GUIDE FOR TRADERS!🔥Hi, friends! I will explain why altcoins are following BTC and how traders can take advantage of this idea.
The first and main crypto is Bitcoin. I am sure that 99% of traders/investors discover crypto through BTC.
📊THE 4 MAIN REASONS WHY ALTCOINS FOLLOW BTC:
🔥 Bitcoin is the most influential cryptocurrency: As the first cryptocurrency and the largest by market capitalization, Bitcoin has a significant impact on the entire cryptocurrency market. The price of Bitcoin often affects the prices of other cryptocurrencies, and it can cause other altcoins to rise or fall in value.
Therefore, it's essential to keep a close eye on Bitcoin's price if you're trading altcoins, as it can indicate market trends and potential opportunities.
🔥 Altcoin prices are correlated with Bitcoin: Many altcoins have a strong correlation with Bitcoin's price movement. This means that if Bitcoin's price is rising, it's likely that the value of altcoins will also increase. However, if Bitcoin's price falls, altcoins are also likely to experience a decline in value.
As such, tracking Bitcoin's price can provide valuable insights into the behavior of other cryptocurrencies in the market .
🔥 Bitcoin can act as a safe haven asset: During times of market volatility or economic uncertainty, Bitcoin has historically acted as a safe haven asset. This means that investors tend to flock to Bitcoin as a way to store value and protect their investments.
As a result, Bitcoin's price can rise during times of crisis, and this can have an impact on altcoin prices as well. By monitoring Bitcoin's price, traders can gain insight into market sentiment and adjust their trading strategies accordingly.
🔥 Bitcoin is a market indicator: Bitcoin's price is often used as an indicator of the overall health of the cryptocurrency market. For instance, if Bitcoin's price is rising, it may indicate that the market is bullish and that investors are optimistic about the future of cryptocurrency.
On the other hand, if Bitcoin's price is falling, it may suggest that the market is bearish and that investors are taking a cautious approach.
By keeping an eye on Bitcoin's price, traders can gain a better understanding of market trends and make more informed decisions when trading altcoins.
✅HOW TRADERS CAN USE THIS BTC-ALTCOIN PATTERN
I made 4 simple comparisons for you to show it. I used Bitcoin (as #1 crypto) and ETH (#1 altcoin). Take a look on the chart and the numbers on it.
🚩 1st case. If BTC falls at the beginning of the bull market = altcoins fall so much.
In the first case BTC fell by -60-65% and ETH fell by -70-75%. It's not too much for ETH, but you can check the other alts. They fell by -85-90%.
🚩 2nd case. After the long consolidations altcoin grow higher than BTC.
BTC made +35%, but ETH made +81%. It's 2 times bigger than BTC.
🚩 3rd case. BTC and altcoins during the rally grow equally. Except for some skyrocketing crypto as AXS, SOL and etc, of course.
+452% for BTC and +480% for ETH.
🚩 4th case. New ATH is a time for altcoins' pumps. This is the time when they grow by 300-400% in a few weeks.
As you see, BTC made +5%, but ETH +157%!
🔥SUMMARY. So, the 2nd case (after the consolidation) and 4th case (at the new ATH) is the best to catch strong altcoins movements for a hundred percent% and 40-50 or even 100RR. Now you can use it in your trading, cause you will know what BTC do now and how it will affect altcoins.
I hope this idea was useful for you. Do you have your own notes? Write your most profitable BTC-atlcoins patterns in the comments!
💻Friends, press the "boost"🚀 button, write comments and share with your friends - it will be the best THANK YOU.
P.S. Personally, I open an entry if the price shows it according to my strategy.
Always do your analysis before making a trade.
Supply and Demand

📊 Smart Money Concepts | Supply & Demand🧐What is Smart Money?
Smart money refers to the capital that institutional investors, central banks, and other professionals or financial institutions control. It is managed by expert investors who can foresee market trends and make most of the profits. Smart money was originally a gambling term, where it refers to the gamblers that have extensive knowledge of the activity that they wager on or have insider information that the common public is not able to access. The smart money concept suggests that these investors can identify trends and opportunities before the broader market and position themselves accordingly. They may also be able to manipulate the market to their advantage by creating buying or selling pressure on certain securities. Some traders try to follow the smart money by analyzing the actions of these large investors through public filings, news reports, or other sources of information. However, it is important to note that not all trades made by institutional investors or large financial institutions are necessarily "smart," and blindly following their actions can be risky.
🔹 Supply Zone
In trading, a supply zone is a price range where there is an abundance of sell orders, resulting in increased selling pressure and potentially a temporary resistance level. A supply zone can be identified on a price chart as an area where the price has previously reversed or stalled, and where there are many unfilled sell orders or pending sell orders. Traders may use supply zones as a reference point for making trading decisions. For example, if the price approaches a supply zone, traders may consider selling or taking profits on existing positions. Conversely, if the price breaks through a supply zone, traders may see it as a bullish signal and consider buying or adding to long positions.
🔹 Demand Zone
In trading, a demand zone is a price range where there is an abundance of buy orders, resulting in increased buying pressure and potentially a temporary support level. A demand zone can be identified on a price chart as an area where the price has previously reversed or found support, and where there are many unfilled buy orders or pending buy orders. For example, if the price approaches a demand zone, traders may consider buying or adding to long positions. Conversely, if the price breaks through a demand zone, traders may see it as a bearish signal and consider selling or taking profits on existing positions.
👤 @AlgoBuddy
📅 Daily Ideas about market update, psychology & indicators
❤️ If you appreciate our work, please like, comment and follow ❤️

Learn How Support Becomes Resistance
Support and resistance levels are important points in time where the forces of supply and demand meet. These support and resistance levels are seen by technical analysts as crucial when determining market psychology and supply and demand.
Support is the level at which demand is strong enough to stop the asset from falling any further.
Resistance is the level at which supply is strong enough to stop the asset from moving higher.
The psychology behind support and resistance.
First let’s assume there are buyers who’ve been buying a stock close to a support area. Let’s say that support level is $50. They buy some stock at $50 and now it moves up and away from that level to $55. The buyers want to buy more stock at $50, but not $55. They decide if the price moves back down to $50, they will buy more. They’re creating demand at the $50 level.
Let’s take another group of investors. They were thinking about buying the stock at $50 but never did before. Now the stock is at $55 and they regret not buying it. If it gets to $50 again, they will not make the same mistake and they will buy the stock. This creates potential demand.
The third group bought the stock below $50; let’s say they bought it at $40. When the stock got to $50, they sold their stock, only to watch it go to $55. Now they want to buy it back at the same price they sold it, $50. They’ve changed their sentiment from sellers to buyers. This creates more demand.
A key concept of technical analysis is that when a resistance or support level is broken, its role is reversed. If the price falls below a support level, that level will become resistance. If the price rises above a resistance level, it will often become support. As the price moves past a level of support or resistance, it is thought that supply and demand has shifted, causing the breached level to reverse its role.
Thanks for reading bro, you are the best☺️
Like, comment and subscribe to boost your trading!
Dear followers, let me know, what topic interests you for new educational posts?

Limit and Market orders, cognitive & behavioral reviewWe assume a spot market for this article purely on the result of TRADES' interaction with no market making effect from the broker or exchange. You can only profit from buying at a lower price and selling at a higher price. So, there is no short in here. And we assume that you already know the basics of market and limit orders. As you can see the table on the chart for the whole idea, we want to talk a bit deeper.
Limit Orders
Limit Order is like a Wall, it makes liquidity on the order book to fill the market orders and that is why it is called MAKER.
In limit order, the price is more important than the time.
Limit order makes the market less volatile.
Market Orders
Market Order is like a Wrecking Ball, it takes liquidity from the order book and is filled from limit orders and that is why it is called TAKER.
In market order, the time is more important than the price.
Market order makes the market more volatile.
Now for both of these order types we have Buyers and Sellers.
Buyers always want to buy at lower price, and sellers always want to sell at higher price, so every limit buy should be lower than the current price and every limit sell should be higher than the current price.
If you put a buy limit order higher than the current price or a sell limit order lower than the current price, it will act as a TAKER order not a maker order.
If there is a buy market order at the same time with another sell market order, the buy market order is filled with the lowest sell limit order on the order book and the sell market order is filled with the highest buy limit order on the order book.
So, in every trade that is executed on the order book, one of the buyers or the sellers should be a market order and the other one should be a limit order. It's either the buyer is maker, and the seller is taker, or the buyer is taker, and the seller is maker. That's how the price moves!
Selling market orders push the price to go lower and buying market orders push the price to move higher.
Selling limit orders pull the price from going higher and buying limit orders pull the price from going lower.
Selling limit orders are more spread above the resistances BUT buying limit orders are more concrete at the support price.
Now let's talk about a few facts from Behavioral Finance !
1- Confirmation Bias
: the tendency to interpret new evidence as confirmation of one's existing beliefs or theories (like when the price is inside the ichimoku cloud). So, if I buy at any price, till a long time I will think that it will go higher! and this may be why a lot of people have big losses over time and do not commit to their stop loss.
2- Loss aversion or Prospect Theory : the tendency to prefer avoiding losses to acquiring equivalent gains. losses are twice as powerful, psychologically, as gains (like the urge feeling for revenge trading when you have lost in your last trade). This may be why people use Market orders for exiting from a position instead of Limit orders.
A graph of perceived value of gain or loss vs. strict numerical value of gain or loss.
3- Risk aversion : a preference for a sure outcome over a gamble with higher or equal expected value (like when you can enter at a better price but you rather to confirm your analysis sacrificing your potential profit). This may be why people (or maybe it is better to say good traders) use Limit Orders for entering at a position instead of market orders.
Now if someone buys at a high price and gets in loss, there is a conflict between Confirmation Bias and Loss aversion. If confirmation bias wins (which is for most of the people with lower experience), you just stay in the loss in the hope of a pivot point to sell at break even and that creates an additional sell pressure on a price point near resistance which was seen before (something like Double TOP pattern). But if Loss aversion wins, you commit to your stop loss and get out faster which creates a selling pressure force in a price point under the main support areas which is the result of triggering domino like stop losses.
I try to explain few different concepts together in a structured way. I would be glad to hear your opinion.

🔥SECRET METHOD TO IDENTIFY LONG TERM TREND:VOLUME PROFILE+POC🚀🔥Hi, friends! Trend is the most important thing in trading, so you have to know how to identify it and be a successful trader.
In this idea, I will explain to you the most easiest and useful method for trend identification. I know that you haven't heard about that.
📊 THE INSTRUMENTS WE USE TO IDENTIFY THE TREND:
🔥 Fixed Range Volume Profile (FRVP)
🔥 Point of control or POC
🔥 Bitcoin monthly candles/bars. They help to identify the long-term trend without local noise
✅ IF YOU WANT TO UNDERSTAND IF THE BULL MARKET BEGINS AND CONTINUES, YOU NEED:
1. Use the Volume Profile. Just pick it at the left side of the TradingView chart at "Prediction and Measurement Tools".
2. Stretch the volume profile on a monthly candle/bar.
3. After this you will see the Point of Control (POC, red line) which shows you where the most liquidity is concentrated.
4. If the price continues to close above the POC each month, this means that we have a healthy bull market.
5*. If you see that the monthly candle is close below the POC, you need to be more careful with your trends. This can indicate about a trend change, but it happens at least 1 time in the middle of the bull market.
Check the precious bull market. Thats work perfectly!
🚩 You can check if it rule works for the BEAR market and write it in the comments.
📊 WHY IT'S IMPORTANT TO UNDERSTAND THE LONG TERM TREND
I know that you guys know the most famous trading quote: "Trend is your friend." . Naive but very useful recommendation.
The understanding of the long term trend helps you to reduce 50-70% of your losing trades and increase your winrate at least to 60-80%:
🔥 you can use only trend following strategy and make much more money (open only long trades on bull market or open only a short trades on bear market)
🔥 reduce the risk when opening a trade against the trend and cut the losses.
🚩 Additionally, if you buy crypto (BTC, ETH or other alts) on spot, you can use this method to buy and hold crypto till BTC not change the trend. This method helps you to make a huge profit.
So friends, this 5 min educational idea helps you to grow your deposit much faster and don't get big losses during the trading.
Traders, was it useful for you? I know I have is a lot of experienced traders. Write your most useful trading tips in the comments to help the newbies.
💻Friends, press the "boost"🚀 button, write comments and share with your friends - it will be the best THANK YOU.
P.S. Personally, I open an entry if the price shows it according to my strategy.
Always do your analysis before making a trade.

E-Book Gift + TRADABLE VS NON-TRADABLE ORDER BLOCKSABBREVIATIONS & DEFINATIONS
ORDER BLOCK
OB is a Down/Up Candle at/near Support or Resistance before the move Up/Down, respectively.
Down Candle is a Bearish Candle
Up Candle is a Bullish Candle
Bullish Order Block is Down candle at/near Support level, before the move up
Bearish Order Block is Up Candle at/near the Resistance level, before the move down
IMBALANCE
This is Insufficient Trading in the market. Sometimes called Liquidity Void .
When there is insufficient trading in the market, the price often comes back to fill out the orders
that were left.
Imbalance is created by 2-3 or more Extended Range Candles
ERC candle often closes at 80% of the candle range
Assumptions;
When the Market Maker want to move price up at a certain level, it is assumed that, there should
be enough sell orders to pair their buy orders with (this is how they make profit).
So, when the MM moves away from a given level with strength and magnitude, leaving behind a LV
(IMB), we can use this to assume that sell orders that were available at that level were not enough to pair
with their Buy Orders.
Therefore, the MM will, often, come back at this level for mitigation
MITIGATION
Mitigation means; to reduce risk.
When the MM moves price away from a level with strength and magnitude, say they are buying; it is
assumed that this is used to entice retail traders to join the move.
And because most retail traders are price chasers, they join the ride with their Stop Loses set. This is
the reason (assumed) that the MM will come back to clear retail traders SL. When their (Retail Traders)
SL are hit, they are knocked out of the move, hence MM mitigating their risk (THEY WILL RESUME
THE INITIAL TREND HENCE MOVING ALONE).
you can download that E-book from below URL

Supply and Demand BasicsHey all this is my first video on Supply and Demand. Wanted to share a quick little overview of what my routine generally looks like. I plan to share more and dive further into Supply and Demand.

Pre Market Levels are CRITICAL in Day Trading 10X Gains For MeCME_MINI:ES1! AMEX:SPY NASDAQ:QQQ CME_MINI:NQ1! NASDAQ:TSLA
I wanted to share a basic strategy I've been using that has helped me increase my profitability almost 10X
Most people don't know that when the regular trading hours (RTH) markets are closed, the futures markets are running
Generally overnight action during the pre market will set a clear high and a clear low. Those key pivots are hidden support and resistance that you WILL NOT see on the normal chart.
Strategy
1 - Draw the Pre Market High/Low
2 - Use the Fibonacci tool in the direction of the overnight action either Bullish or Bearish
3 - Use the 0.618 Level as the KEY Algo level where you BUY THE DIP or SELL THE RIP
4 - Rinse and repeat - Always have a stop loss at the last major pivot and scale out profits over 25%
Here is a more complete video guide from a trade I took last week:
www.youtube.com

How to find strong Support and Resistance using Bollinger BandsHey traders, Above is my first video ever made on this Platform in which i explain a simple way to find strong support and resistance zones using bollinger bands indicator.

True SMC entry module to pass Funded Accounts!!!Hello traders. In this module we aim to explain how to enter the trades along with market makers for high RR entries. Entering like this will protect your Stoploss since your orders are along with the Market makers and market makers defend their positions. As a result your position in also defended in this case. Please pay attention to the annotations made on the chart.
Happy Trading
Team Lamda!!!

🔥WHAT IS NEEDED FOR BITCOIN TO GROW HIGHER? 1300%vs4900%🚀🔥Hi friends! A lot of newbies consider these things as something bad. These make them very unhappy and disappointed because their position gets the loss. These things are the pullbacks or corrections after significant growth. Everyone is waiting for it now to buy more cheap crypto.
📊 The pullback is the price fall after significant growth. But why is it so good for price growth:
🔥 1. it makes the market (BTC as well) much healthier because it liquidates overleverage traders.
For example, -40% pullback liquidates all traders with 1.5x leverage and coll down the market (as it was in the 2016-2017 bull market).
🔥 2. it gives the opportunity to enter the long traders for the advanced traders. If we have 5-6 pullbacks every time after 100-150% growth, you can use already earned money in new trades (increase the risk per trade).
When the price doesn't make the pullbacks and you enter the trade at the very beginning of the bull market, you have no chance to exit the trade and use the margin from the profit to increase the risk per trade.
✅ COMPARISON OF 2016-2017 AND 2020-2021
🚩 2016-2017 BULL MARKET
The market had made 4900% of profit in just 2 years. I mention 6 huge dumps with 30-40% drawdowns. These dumps cool down the market and liquidate overleveraged traders. Lots of entrance opportunities. Hope the next bull market will be the same.
Of course, you can say that market was not as big as now and I agree with you. But the whole BTC capitalization is equal to 3.5% of the entire gold cap, so it's just the beginning for crypto.
🚩2020-2021 BULL MARKET
This bull market as well as the 2019 local bull market was almost with no pullbacks and entrance possibilities. Bitcoin had made just +1300% in 2 years. Just 3 pullbacks with +16-30%. Almost no liquidations and no cool down of the market. Not the best growth as the result.
In that bull market, the beginners can't even normally use their gaining margin to open new trades.
🔥 WHAT WILL HAPPEN IN THE NEXT BULL MARKET?
I think that this growth will be the same as at the last bull market. Of course, it will be some surprises as at each bull market, but it will grow nonstop.
I make a huge update about this in the last idea. Check it if you want to know what to expect from BTC and the crypto market here👇
🚩Traders, what is your expectation about BTC bull market? Do you agree with me or have another argument? Write it in the comments!
💻Friends, press the "boost"🚀 button, write comments and share with your friends - it will be the best THANK YOU.
P.S. Personally, I open an entry if the price shows it according to my strategy.
Always do your analysis before making a trade.

How to identify the true orderblock? Advanced Orderblock.Hello traders. In this post we aim to explain you on how to identify the correct orderblock. Please pay careful attention to the annotations made on the chart.
Happy Trading
Team Lamda

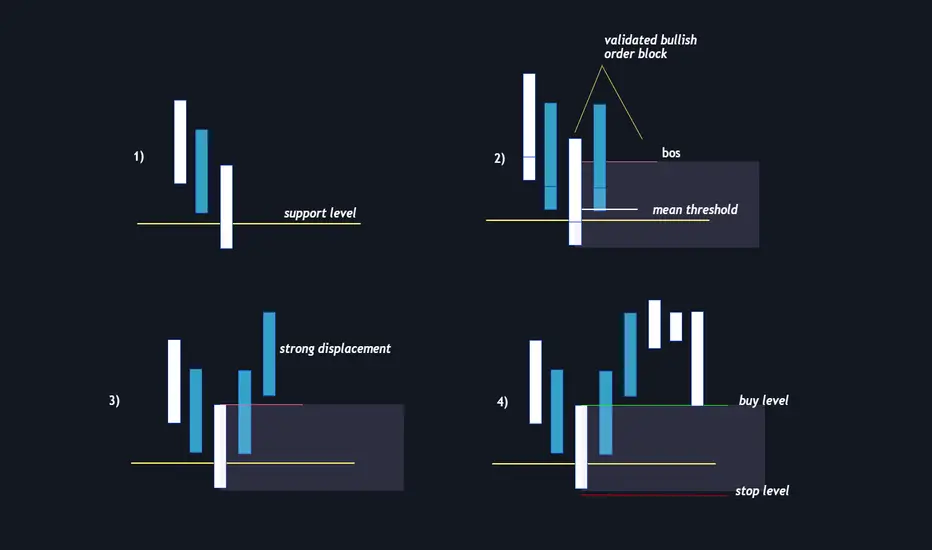
Order Block🔵 Definition
Bullish - consecutive down-close candles that have the most range between open-close and are near a support level.
the lowest candle is the strongest. Wait for the price to give and identify that larger orders are coming into the market there should be a strong reaction towards the opposite side once the price reaches an important level.
🟢 Validation
order block is validated when the high of the lowest down-close candle of the low or the low of the highest up-close candle is traded through by a more recently formed candle.
Ideally, the best bullish order block will not see the price trade below the mid-point (mean threshold) of the candle.
Use mainly bodies, not the wicks because it contains pure data as everyone uses different brokers and exchanges this can make wicks unreliable.
🟠Displacement
price may run away from the order block if it's valid after there is a strong reaction so you need to be patient for it to retrace its move and retest the order block. Displacement is evident in price action there is an institutional entity behind the move. Displacement may also leave behind another point of interest - FVG - Fair Value gap.
⚪ Entry and risk
when the price impulsively moves away from the order block, it may retrace after displacement which can offer a buying opportunity as the price returns to the open of the bearish order block candle
Target the buy stops above the latest high as your first TP
The low of the bullish order is a relatively safe stop-loss placement.
Order block is strongest it is the lowest candle that took out liquidity from previous lows.
Let me know your opinions
Good luck in trading
Dave FX Hunter ⚔
📊 Market Structure: BOS VS CHOCH📊What is market structure?
Market structure is the levels that are created by the price of any currency as it moves up and down.
Price never moves in a single direction for too long. It always takes a few steps in one direction, then moves a few steps back, then a few more steps, then a few steps back.
Over time, these steps form distinct structures in the market: zones of consolidation, zones of support, zones of resistance, and zones where price impulses up and down.
Market structures that form in the past are often respected in the future, and analyzing previous market structure can form a basis for a trading plan.
BoS carries on in the same direction it was initially heading in where as a CHoCH can be viewed as the Markets turning point
🔷BOS - Break of structure forms in the direction of the trend creating continuation patterns.
Break of recent Lower Low when bearish or break of recent Higher High when bullish.
🔶CHOCH - Change of character form at the end of a trend. For example, if we see an uptrend in the market, characterized by higher highs and higher lows,
this means that the overall trend remains bullish. However, when a new high is formed and then impulsively broken to the downside,
this could signal that the bullish trend might be coming to an end, and that a possible choch transition may be happening.
👤 @algobuddy
📅 Daily Ideas about market update, psychology & indicators
❤️ If you appreciate our work, please like, comment and follow ❤️

🔥THE BEST TIME TO BUY ALTCOINS: DOMINACE AND ALTSEASON🔥 Hi friends! All you know and like the time when altcoins make +50-100% or more profit just in 1-2 weeks. Most of the traders enjoy this time. Dominance is a key thing that helps us to identify such periods (altseasons) and buy alts in time.
📊 WHAT IS ALTSEASON AND WHY DOES IT HAPPEN?
Altseason is a time when most altcoins grow by 30% or more.
THE TWO MAIN REASONS OF ALTSEAON:
1. BTC capitalization outflow and its inflow in altcoins (dominance fall).
🚩 Dominance is the ratio between the total value of all Bitcoins to the total value of the crypto market ( Bitcoin + altcoins). Altcoins start ti griw when it falls.
Bitcoin currently has a $320 billion capitalization and for Bitcoin these $1-2B globally do not mean anything. As the altcoins have a lower capitalization, when $1-2 billion from Bitcoin flows into any altcoin, it can grow by 100% or more. With large outflows (10-20% of Bitcoin's capitalization), the growth of all altcoins (altseason) begins.
2. huge money inflow in altcoins during periods of "greed", when crypto market makes new ATH or BTC is at the last stage of bull market (parabolic growth). The BTC dominance falls in this case too.
All you know the periods when BTC make a new ATH and this is a most comfortable time to grow your deposit - everything is just exploding.
✅ As Bitcoin is still far from its highs, which is the second reason for the growth of altcoins, we should look for the first reason, which is the flow of money from BTC to altcoins now. Our main task is to buy good altcoins just before the altseason.
📊 WHEN WILL THE NEXT ALTSEASON START?
Friends, as you can see on the chart, the altseason begin when the BTC dominance falls. Now we should expect the next atseason when BTC reaches 50-54% of dominance.
✅ The altcoins start PUMPS during this dominance fall as was shown at 1 and 2 cases.
Friends, I will publish a list and trading setups of the best altcoins when that time comes. Let me know which altcoin I should pay attention to. Write it's ticker in the comments.
💻Friends, press the "boost"🚀 button, write comments and share with your friends - it will be the best THANK YOU.
P.S. Personally, I open an entry if the price shows it according to my strategy.
Always do your analysis before making a trade.

🔥THE WORST YEAR FOR CRYPTO: 2022 OVERVIEW AND 2023 FORECAST✅🔥Hi friends! Bitcoin fall from $41 500 to $15 500 by 42% this year. 2022 was an amazing year, especially if you are trading using downtrend strategies. But who will be the winner in 2023? Long or short traders? Read more in this idea!
📊
WHAT WERE THE MAIN REASON FOR BTC DUMP IN 2022?
1.
LUNA, UST, and Do Kwon are the first such major crash this year. The algorithmic stablecoin UST lost its peg to $ and pulled down the LUNA token, which it was backed by.
Terra LUNA had one of the largest amounts of Bitcoin. In total, they had about 81,000 BTC in their wallets, but this did not save them from the fall. LUNA was top-10 altcoin by capitalization but fall from $110 to $0.01.
BTC fell from $31 000 to $17 900 by 44%.
2. FTX, FTT and Sam Bankman-Fried. At that moment, it seems like BTC begin to recover and already reached $21 500 after the 4 month consolidation (accumulation) from June to November. CZ tweeted about FTT sell off just only opened eyes to the problem of the #2 exchange.
🚩 Bitcoin fell to $15 500 but actually, it`s not a huge dump, as was all the year before. This fact indicates that there are almost no sellers in the markets and recovery is highly possible.
📊 THIS HAPPENED FOR THE FIRST TIME IN THE BITCOIN HISTORY
The Q1 2022 started with a small fall, but after this, the series of negative events in the cryptocurrency market pushed the price of bitcoin lower and lower. Now we should say that this is the worst year ever.
✅ All 4 quarters (Q1, Q2, Q3, Q4) will close at loss FOR THE FIRST TIME IN BTC HISTORY.
📊 THE PREDICTIONS FOR BTC IN 2023
I name this year THE YEAR OF RECOVERY for the crypto market. BTC will reach $32k as a pullback to this year’s dump with a 95% probability. I think that the #1 crypto has a 70% probability test of $45k.
✅ But first, the price can update the lows and reach $10-12k. So if you are a trader , it will be a really good year because of its volatility.
If you are a long-term trader or investor , I would be in the market by 20-40% to not miss the possible growth. Another part of the deposit leaves for buying lower at $10-12k or after making new HH and HL at $21-22k.
It will be interesting to check the results in a year.
Friends, what is your target for BTC in 2023? Write your target at the comments. Please, don`t write $200-300k :)
💻Friends, press the "boost"🚀 button, write comments and share with your friends - it will be the best THANK YOU.
P.S. Personally, I open an entry if the price shows it according to my strategy.
Always do your analysis before making a trade.

btcusdtperpHello everyone, in this analysis I want to show you how to use the smart money analysis method, so stay with me.
This method is a combination of ict and S&D & rtm
The condition for entering the trade is breaking the limits in the higher time frame, such as monthly and weekly, and the second condition is the appearance of a candlestick pattern in the lower time frame.
All ranges are specified and named
If you have any questions, ask under this post so that I can answer to the best of my ability

3 Things To Do After You Lose A TradeWe have all been there. You analyze a trade setup. You know how much you're going to risk on a trade. You enter the trade just to come back to your chart and find you've been stopped out.
It's not fun. It sucks. You thought the setup would work because you followed you rules. The thing is, the market is the market.
In my early stages of trading I hated being stopped out. My reasoning was because. I had no idea how to make up for my loss.
I thought if I just plotted more lines and levels on my chart I could enter the trade again and make my money back.
The problem I kept running into was I had no idea why I lost the trade or how to handle my feelings. I also had no real plan on how to adjust to the price change.
I honestly thought my levels or trend lines didn't work. It was deeper than that.
What changed?
I had to change the way I viewed the market and my next steps to recover my loss. Not only that, I had to learn how to be "ok" with losing money.
I created a 3 Step Process that would increase my probability of winning my next trade. Because we are a trading family, I thought I'd share it with you.
Step 1: Access my previous trade
You hear this all the time, "I made a mistake thats why I lost the trade." The true question is did you really make a mistake or did you follow your trading rules?
When I follow my rules no mistakes are made. When I lose a trade that can mean 1 thing. The market reversed. This leads me to step 2.
Step 2: Change my bias
In the book The Unknown Market Wizards by Jack Schwager, I heard the most beautiful and profound statement by one of the wizard traders. He said, "I realized I have a right to change my mind about my trade at any time."
I can't tell you how that made me feel. I've been doing that all along, but this market wizard summed up my actions in just one sentence.
When I'm stopped out that means I have to change my mid about the direction of the trade. I made being stopped out so simple so I won't confuse the next action I should take. That leads me to step 3, update my chart and adapt to the new price movement.
Step 3: Update and Adapt
I have a no nonsense rule and that is to stop trading in 1 direction if I'm stopped out. Go opposite. I'm a true trend trader. I don't naturally trade against the trend. It gets me in trouble.
So at the first sign of trouble, I adapt.
See, USDCHF was in a downtrend.
I sold the trade at 0.92835( sell limit) and overnight I was stopped out. It happened so fast and just as fast as I was stopped out, I knew I had to become the buyer.
My Mental
In the recent past, being stopped out would have spooked me. Now, its making me want to come back to the charts to face my fear. I used to have a fear of success and failure. Now I have a hunger to want to succeed and learn.
Putting on trades is a bit more fun since I've began working with pending orders. They challenge me. Especially in situations when price reverses and I'm stopped out.
I pray you gained new insight and a key takeaway on what you can do next after you lose a trade.
Just remember, losing a trade doesn't make you a loser, it makes you a trader.
Comment down below what your takeaway was. I'd appreciate it if you could like the post. It helps boost my Trading view reputation. Much love,
Shaquan

Flawed concepts: the way they sell volume & market profilesImagine daily profiles put on each day on the chart, and let the words in purple provoke some fruitful doubts in your mind.
The presented and advertised way of using volume & market profiles is essentially a way of approximating the real levels. This way is very bad.
1) The most fundamental and very obvious flaw is that it disregards the sequence of events. You can take a chart, reshuffle bars in order, or lol, just invert it horizontally. and you'll end up with different charts that have the same profile. All good bro? It's time series lol, sequence does matter. That's why you can't use profiles and non-weighted stats unless you have a very specific goal;
2) 70% rule, normal distributions & standard deviations have nothing to do with aggregated tick data. As a process, it can all can be modeled as a morphing distribution, a constant fight between normal and uniform distributions, the double auction dynamic distribution. But yeah, ofc course you can't read it in a book, gotta think for yourself a lil aye? In normal distribution 70% make sense, in the uniform one it makes sense to consider 100% (the whole distribution) as the area of interest. So overall it's somewhere in between 70 and 100. Also, confirmed with my R&D, bots give the best performance when a price channel includes 80-90% of data (mostly 80), best metrics converge around this number;
The real way to use profiles is when you consciously need to disregard an order of events within a certain period and have some kind of summary of it. It's applicable when a certain period has some distinguishable significance: when levels are formed, positioned and cleared. There, you are not really interested in order of things within these events, rather in summaries of these events, there you're doing the right thing. Otherwise, POCs of 'every' period doesn't have equal significance. Summarizing volumes within a week/day/months etc, making a profile & taking 70% so you gonna get VAHs and VALs of it won't magically calculate you the real levels, only approximate em, but 4 real there are better and less computationally intensive ways of doing it, just get a box plot with 10th and 90th percentiles.
This video might be really mind opening for you, I really respect it & its creator.
If you wanna know how to find levels 4 real, check the linked ideas & use it with pleasure.

Microstructural phenomenons: pre-testOn the chart, Oct '94 is a pre-test of 92.26
I'm not sure it's a good example here, but it'll suffice to explain this easy concept.
Again, it's not the system's behavior principle, the reason of this microstructural phenomenon is all of us.
Forgot to mention before...
There's no such thing as, "A new wave started after "almost" hitting a level". NO. In 100% cases, a level should always be touched. because cheap/expansive is always 1 tick past the level, the main responsive activity will be concentrated after the level, never before.
However, some of us sometimes gets a lil heavy handed in scaling in/scaling out of the previously acquired position. That's why prices start to react (sometimes quite strong) in front of the level.
The main things to learn from here:
1) Pre-tests are not the systemic events, if you're responding at a level / a lil deeper past the level, nothing had changed for you at this points;
2) If you started to scale in before the level and got caught in a pre-test, just simply close your position with whatever revenue this pre-test offers a lil bit later and start scaling in again like nothing happened;
Caution: pre-tests are also a part of the recorded market activity as everything else, during which the things may change or may not change. Pre-tests should be taken out of the context and be processed as independent entities.

Microstructural phenomenons: option strikesThere's no such thing as round levels , instead:
1) You open the option chain of given vehicle;
2) You notice the step between the strikes that have significantly higher volume/OI than the other ones;
3) for example on ES dem would be xx50.00 and xx00.00;
Without further analytics of the option chain, the very general rule is that these levels usually stop & repel the sharp jumps in prices, and allow the average activity to pass through em with a little stuck around em.
Again the reason is microstructural, some of are hedging current & anticipated option positions on good prices. Usually market allows to do it right after economic releases.
About the example, if you have any platform that offers a liquidity heatmap, try to find that reversal on ES & correlated assets, that moment in time that I market with a circle, you might be surprised.

Microstructural phenomenons: re-positioning 4 real, levels can't be re-positioned, but there's a lil detail.
As explained in "Real levels: positioning and clearing", positioned levels can't switch direction, ie once a level was positioned as support it can't become a resistance, once a level was positioned as resistance it can't become a support. A positioned level can only be cleared with time, price or volume.
However, there are things that do exist and not based on the ways of the system behavior, but rather on some lil details how the sub-systems and the super-system work.
Aye aye, easy, a level can switch directing for a very specific and short period of time, but not due to the principles of how things work, rather by a microstructural reasons. The reason is all of us & common sense. When we scale in near a positioned level, but shortly after it becomes obvious with evidence that a level was consumed/cleared (ie there's no more level anymore), in most occasions there's no reason to take a loss right away, it makes sense to try scaling out at around break-even.
1879 was positioned as support in the end of march 2022, the same time 1788 was discovered as a back level of 1879.
Point 1: we enter @ ~ the level;
Point 2: the level gets definitely proved as a cleared one;
Point 3: we leave at break-even, concentrating the liquidity around 1879 (~ when we've entered);
Point 4: we see the result, a pop.
If we would've dropped much deeper than 1788 (technically said, if we would've contacted another deeper level), that phenomenon would've never occurred (there would've been no1 to scale out at breakeven).

🔥✅HOW TO GET 70% WIN RATE USING VOLUME PROFILE🔥 Hi friends! Today we will talk about a very important trading tool that can give you 70% win rate if you will know how to use it as a pro trader. This tool is a volume profile.
📊 WHAT IS THE VOLUME PROFILE?
The volume profile is a real traded volume. Unlike the usual vertical volumes that show the amount of volume traded over a certain amount of time, the horizontal volume shows the volume traded over a certain price range.
The volume profile has 2 components:
🔥 value area (yellow areas), which is the biggest resistance/support for the price. There can be several value areas, but the largest value areas called HVN or High Volume Nodes.
🔥 liquidity gap (white area) is the area where the least volume is traded. Usually, the price "cuts" through these areas very quickly.
📊 HOW TO USE THE VOLUME PROFILE?
I want to show you how it works. If we want to understand the next price movement, we should identify the biggest value areas. So you see the most significant liquidity (value) areas and wait when the price tests it:
1. if the price breaks the value area and tests it as support , you can enter a trade because bulls are strong and the price should go higher.
🚩 The clear trade example on how to use HVN (value area) as support (+20% of clear move).
2. if the price test it as resistance , this means that bears are stronger and bulls haven`t enough power to push the price higher.
🚩 The clear trade example on how to use HVN (value area) as resistance (+26% of clear move).
So the value areas or HVN are a stop on the way of price movement in one direction or another. The better you determine where the price will go after testing this HVN (value area), the more profitable you will be.
🚩 If you use this approach on lower timeframes, you can get more trades. This is ideal if you are an intraday or swing trader.
Try using horizontal volumes yourself, and in the following ideas, I will tell you how I and other advanced traders use them.
✅ So this approach has 50-70% win rate, but if you want to increase it, you need to use additional filters.
Personally, I use the DOM and Footprint to identify the whales' orders and buy crypto with the big guys. These indicators can easily add 25-35% to your win rate. I make a lot of video lessons and articles about them, so enjoy and make money.
💻Friends, press the "boost"🚀 button, write comments and share with your friends - it will be the best THANK YOU.
P.S. Personally, I open an entry if the price shows it according to my strategy.
Always do your analysis before making a trade.
