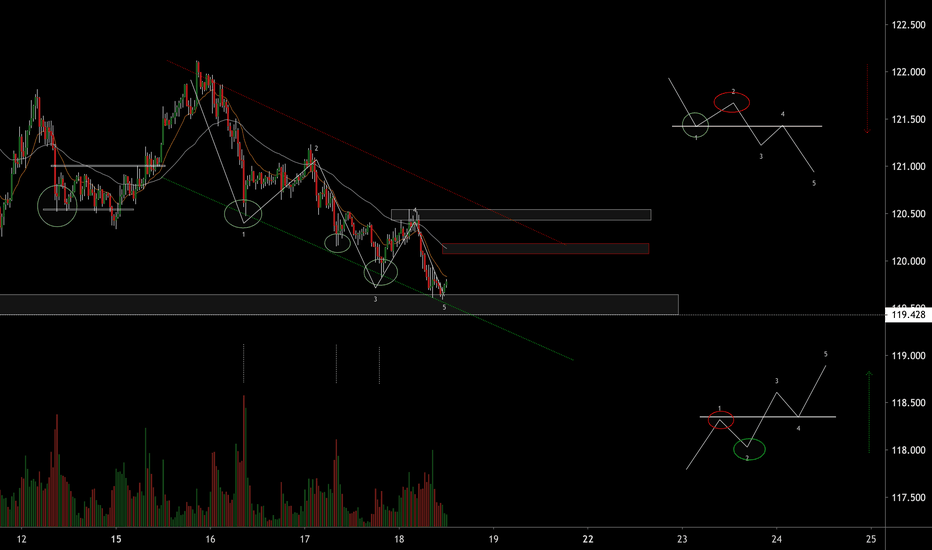
Supply and Demand
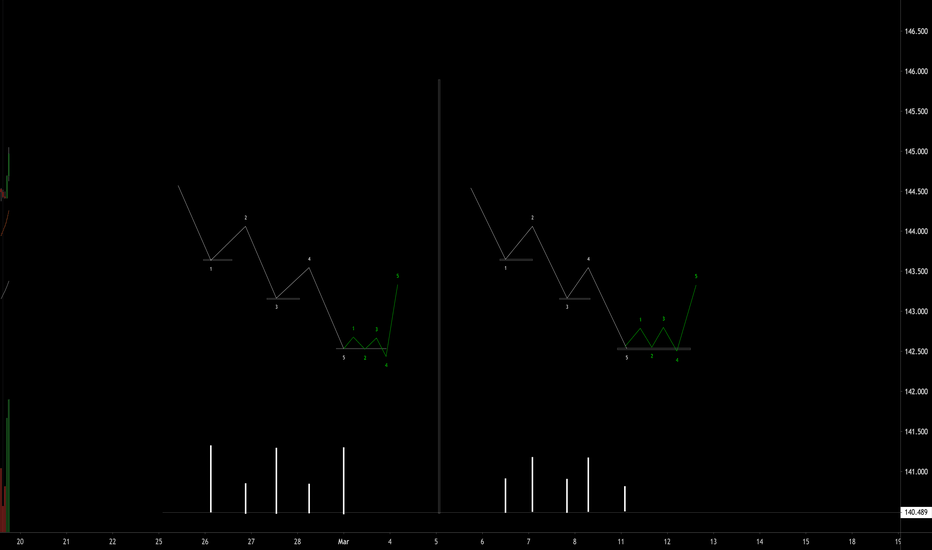
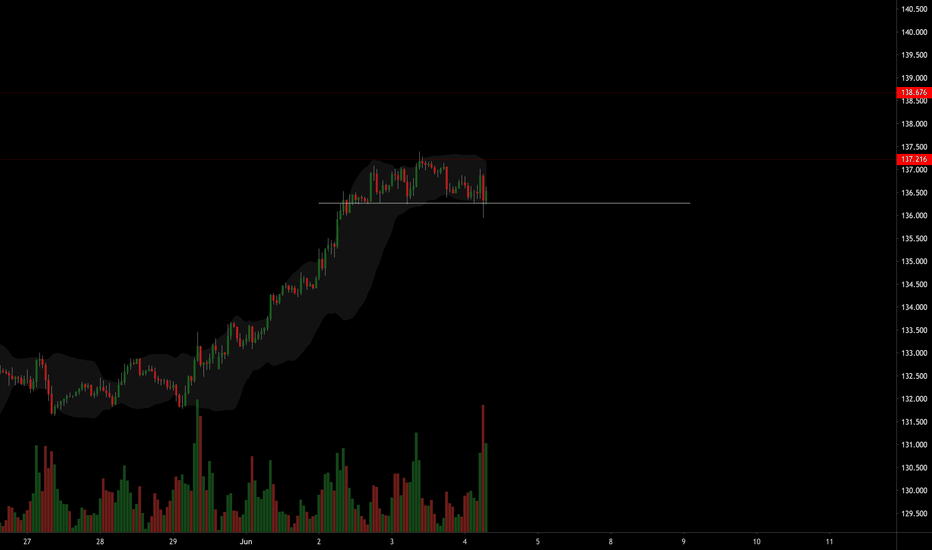
EURJPY Volume at initiation point of motive wave (ref)If you can identify a wave count developing, look at the associated volume at the point where the wave starts.
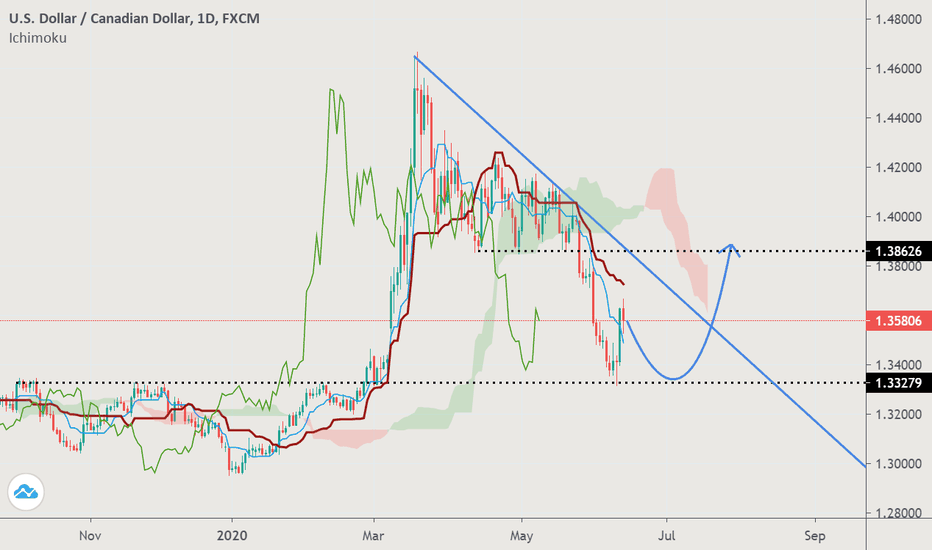
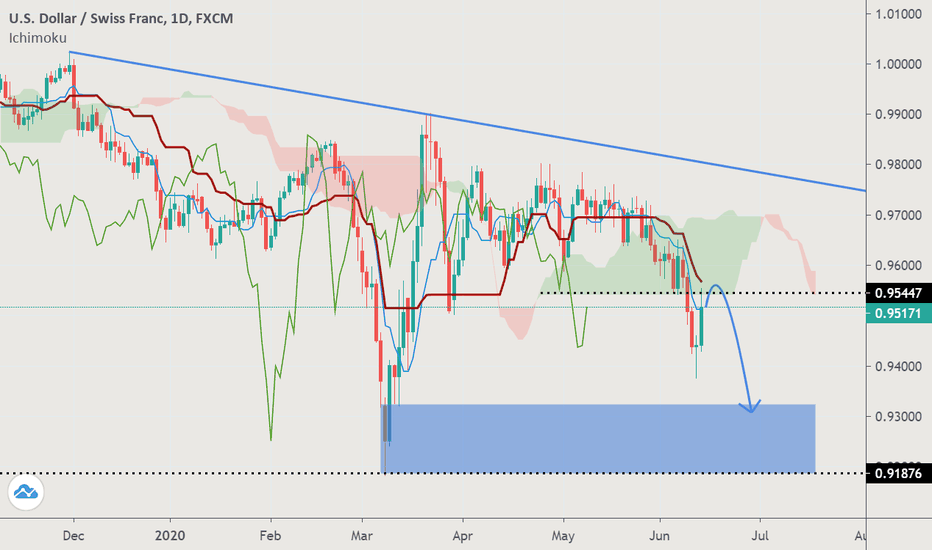
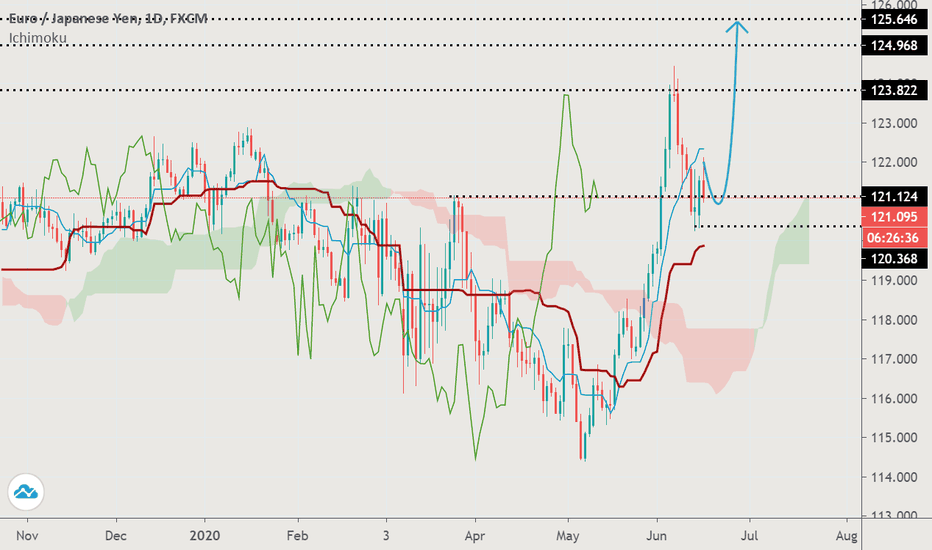
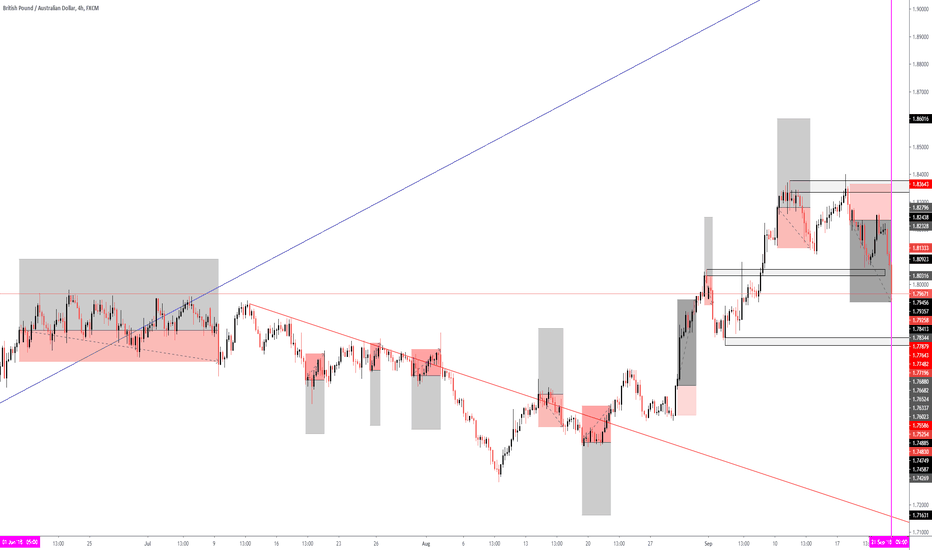
You can also try to make your projections using previous support/resistance or supply/demand zones. If you are always looking for a textbook 5 wave, it might be hard to find.
Linear regression tool and zig zag indicator may help in identifying these areas. Volume can help in projections (among other things).
Reference*
BTCUSD 4 hour RSI signalling RSI sensitivity at 7
Instead of 70/30, levels are set at 80/20.
Using RSI as an adjunct/signal tool. Note the volume anytime RSI breaks the 20 level. You can set an alert at 20/30. Whenever price breaks this level you will be alerted and there may be a potential long situation setting up.
RSI can convey divergences between price and volume.
Also can be used as a final confirmation. for example, you are about to enter long but notice RSI hovering around the 50 level: Middle of range, not ideal.
Takes patience but there are opportunities off of the 20 RSI if you understand volume.
practice*
