Ninja Talks EP 28: Don't fall for the sub!I often talk about awareness being the cornerstone to any success, wether it be financial, physical or mental - but how many actually do it?
For a whole week the western world was infatuated with a missing make-shift submarine lost at sea on its journey to explore the Titanic.
Is it beneficial to us?
Who decided that's what we should be all focusing on?
It's irrelevant news.
Yet the loose attention span of Bambi's throughout the world was so apparent to see, because when you don't refine your awareness daily - you give that power to someone else.
Many didn't turn it into content.
Many didn't see how they could profit from it.
But most importantly many didn't even consider that there attention was being manipulated in real time to focus on irrelevancy and negativity.
It doesn't empower or fill you with drive, so why do it?
Awareness of my surroundings is the "cheat code" I've been using for years and the results speak for themselves, I work for myself and by myself taking trades and pumping content from the comfort of my own phone no matter where I end up in the world, if I have an internet connection, I'm good to go!
How many of you can say the same?
Truly.
Not to diminish your current state, but how fluid are you in your life? When you desire to do something, can you? Or are you continually restricted by outside circumstances?
Just questions.
Keep your blades sharp Ninja!
Supply and Demand

Market Makers Buy And Sell ModelThe market Makers' Buy and Sell Model is a strategy that reveals the market maker algorithm model for price delivery.
Basically, there are 3 things market makers' algorithms do with price in every trading session, day, week, and month
Those 3 things are; Accumulation, Manipulation, and Distribution.
AMD:
A: Accumulation
M: Manipulation
D: Distribution
1. Accumulation: They accumulate liquidity through the delivery of a ranging market.
The purpose of delivering a ranging market is to induce both buyers and sellers to enter the market thinking that price will go in their direction.
How to Identify a Ranging Market: You know price is in a ranging market when you see obvious relative equal highs and lows price range.
In a ranging market, price swing points have relatively equal highs and lows, that is, the price is neither delivering a higher high nor a higher low.
2. Manipulation: After accumulating both buy and sell orders, they then manipulate the market to further induce another set of traders which are breakout traders.
But, that particular manipulation move is not their intended direction for the day. They only use it to gather liquidity, Which will then lead them to the next action which is to move and distribute prices in their real direction for the day.
Usually, when price breaks out of a ranging market, the break-out is a manipulation to further induce a new set of traders to enter the market, further proving liquidity for market makers' real intended direction.
3. Distribution: After manipulating the price to a particular direction different from their plan, they then distribute the price to their original intended direction.
e.g to buy, they will first sell the market and then buy at the discount price level.
You know a price distribution through clean candles that left imbalances behind and then break market structure away from the previous manipulation move structure high or low to form a new structure.
Example of Market Makers Buy and Sell Model as described on the chart.
AMD:
A: Accumulation
M: Manipulation
D: Distribution
Accumulation: Price range for some time, accumulating liquidity on both sides of long and shorts.
Manipulation: Price broke the high of the accumulation to take out Buyside liquidity and then create a new higher high and higher low. But it's a manipulation move.
Distribution: Price moves away from the FVG leading to a shift in market structure, plus a short pullback, follow by a massive move to the downside to take out sell-side liquidity below.
Entry: Your entry should be inside the FVG created by price before the shift in market structure, you can set a limit order inside the fvg and place your stop loss at the high of the swing high created prior to the fvg and shift in market structure.
The same thing applies to a bullish market.
Basically, Marker makers push prices higher so they can sell the market at a premium, while they sell the market to lower prices so they can buy that market at very discount prices
This strategy can be used in any time frame and all markets including forex, crypto, stocks, future etc.
Follow me for more updates.
Feel free to ask me any questions in the comment.

Fair Value Gap Strategy (FVG): GBPUSD 7.32x Reward TradeCheck out this 7.32RR trade I took today on GBPUSD.
OANDA:GBPUSD
Trade Process:
Daily is bullish with FVG serving as draw on liquidity.
1HR: Took out Sellside liquidity left with BuySide liquidity to take out.
15M: London Session open took out 15M sellside liquidity with high probability of taking out Buyside liquidity.
Entry: I used my fib to locate OTE at the FVG which is where i placed my buy limit.
Price retraced to pick my order and fly high to take out the buyide liquidity and the daily FVG.

Ninja Talks EP 27: NostalgiaIt seems like just yesterday I started my journey to becoming an elite level trader and because I'm feeling a little nostalgic, I'm going to share with you one major groundbreaking lesson that changed my life just 6 months in to my career.
So let me take you back to the good old days of Jan 2013.
Back then, like most, I googled "How to make money?" - naive me thought it would be easy, but old daddy fate had something else in mind for this grumpy Ninja and I regret none of it.
My "detailed" search lead me to forex factory where I rejoiced in the open fields of the community as a fresh faced Bambi ready to learn.
Luckily for me, I found a mentor within the first six months. This mentor gave me unending guidance that to this day I still hold dear to my trading heart. Now I don't want you to think that this is a love letter to my once good friend and mentor because it ain't, things ended badly and abruptly. And like most arguments, both parties are wrong.
With that being said, one line, that he always used to say rings in my ears whenever my attention or drive begins to dwindle.
He said, "Consistent practice breeds consistent results."
Now I don't care who you are, that's one helluva line.
Mainly because I understand it's depth the more experience I gain.
We can come at it from many different angles, but here's two;
1) Consistent application of a strategy leads to a deeper understanding of a strategy which leads to pulling success from said strategy.
Make sense?
2) We are not after a big pay day, we're after consistent pay days - big difference between the two and when you grasp the deepness of that statement, you become a pro my friend.
It doesn't necessarily matter if you are geek or chad, amateur or pro, Samurai legends or Ninja, what matters is the lesson you (1) Observe and (2) Allow to sink in.
This is how you "make it".
This is long term gratification.
Practice consistency.
In every waking moment and in all aspects of life and I swear to you right here and now, you will live a hugely fulfilling life.
Understand Ninja?
Good.
That's all for today's episode

Ninja Talks EP 26: Shocking Success Revelation of a Feline Earlier this morn, I was perched upright on my cozy outdoor chair in my garden enjoying a well earned Cuban. With the sun kissing my skin and the great release of energy I felt with every exhale of my cigar I was content, lost in thought, happy - still, but then to my surprise I was startled by a subtle movement off to my left on the bright green grass I cut days prior.
It was my Persian cat Leo, the feline was in hunt mode, completely oblivious to my onlooking observations, but it didn't matter he was zen.
Even though the sun was shining bright white there was a slight breeze that would brush the also bright white fur of Leo, rustle the trees and cascade noisy dried up leaves down the path - he was aware of it all, ears twitching and eyes wide, he missed nothing but, he was looking for a target and by golly he saw one down in the foot of a tree 6ft away from him.
A Robin red breast collecting dried plant matter to blanket its young back at the nest.
The Persian nustled down deep into the ground, making itself a flat fluffy invisible killing machine - as the Robin danced just outside of reach Leo didn't move, completely still, not even for an instant showing his intention.
After a quick back and fourth of daring bravery on one hand and simple cunning on the other the Robin flew off, to which Leo - not at all dejected or defeated - reset, raising his body higher, leaving hunt mode and entering back into listening mode.
This is an elite level trader personified.
Silent. Ready. Prepared.
When the trade is close (just like the Robin), but it does not qualify totally and completely to your strategy, you do not pounce, you wait.
Make sense?
You stop.
Reset.
And start the hunt again.
The hunt is what's enjoyable, not necessarily the prize.
Think about that the next time you "see the Robin" in your own trading.
Ninja out.
Follow for more Ninja Talks.

Ninja Talks EP 23: Useless ToolsWhen it comes to analyzing price charts, simplicity is often the key to success. Overloading your trading chart with numerous tools and indicators can lead to confusion and hinder your decision-making process. In this post, we will explore the benefits of removing unnecessary and useless tools from your chart, enabling you to focus on the most crucial aspects of your trading analysis.
The Power of Minimalism:
In trading, less is often more. By decluttering your chart and removing unnecessary tools, you create a clean and focused environment that allows you to concentrate on key price action and market trends. A minimalist approach helps you identify patterns and signals more effectively, reducing distractions and improving your overall trading performance.
Eliminating Redundant Indicators:
Take a critical look at the indicators on your chart and ask yourself: Do I really need all of them? Many traders tend to overload their charts with multiple indicators that often convey similar information. By removing redundant indicators, you simplify your analysis and avoid conflicting signals. Stick to a few key indicators that align with your trading strategy and provide meaningful insights.
Prioritize Price Action:
Price action is the foundation of technical analysis. Removing unnecessary tools allows you to focus primarily on price movements, support and resistance levels, and chart patterns. By honing your skills in interpreting price action, you gain a deeper understanding of market dynamics and can make more informed trading decisions.
Clean Up Chart Overlays:
Chart overlays, such as moving averages, Bollinger Bands, or Ichimoku clouds, can be helpful in certain situations. However, having too many overlays can obscure the underlying price action. Consider removing overlays that you rarely use or those that add little value to your trading analysis. Stick to the ones that truly contribute to your strategy and trading style.
Simplify Trendlines and Support/Resistance Levels:
Trendlines and support/resistance levels are powerful tools for identifying key price areas. However, an overcrowded chart can make it challenging to distinguish significant levels from minor ones. Remove unnecessary trendlines and cluttered support/resistance areas to focus on the most critical levels. This allows for clearer visualization and enhances your ability to identify high-probability trading opportunities.
Conclusion:
Streamlining your trading chart by removing unnecessary and useless tools is a crucial step towards improving your trading performance. Embrace minimalism and prioritize price action analysis to develop a deeper understanding of the market. By simplifying your chart, you can gain clarity, reduce distractions, and make more informed trading decisions. Remember, the goal is not to completely eliminate all tools but to remove those that don't contribute significantly to your trading strategy. Start decluttering your chart today and unlock the power of simplicity in your trading journey.

Ninja Talks EP 22: 500 Followers!First off thanks for 500 followers, seems people like my Ninja Talks, so I'll keep um coming.
In today's episode I want to talk about two types of anger traders go through in the market, one makes you win and one makes you lose.
* Anger Numero Uno
The first is pure rage, complete emotionality and it's what the majority of traders even seasoned pros know very well. In poker this would be called "tilting", in trading it's the same shiz it's just the catalyst appears different, they see cards we see candlesticks. Anyway back to the rage, quick story; many-o-moons ago I tilted and blew up my entire trading account (which was basically my entire net worth at the time), I screamed and rubbed my face so aggressively I dislocated my jaw! It's still not 100% aligned years later. This is the brutality of giving into the 1st anger, it takes no prisoners and will at any moment dash your emotional AND physical well being 1000mph at the wall until you learn to master it.
* Which brings me to the second Anger.
The second Anger, if verbalised, would sound something like "That's it! Let's fuc🤬ING go!", it's a "game on" mentality, not tilted but ready - you understand you're down, but your not giving up - you remain calm but awake.
I'll give you an example, back in the day I had an MMA fight after not training for two years. Completely out of shape I took the fight on one week's notice lost 15lbs and jumped in there underweight, depleted, injured and weirdly stupidly confident. Round one begins and I'm tired after just 1 minute, the "gentlemen" across from me realising this proceeds to plod forward and tee off on my baldy head and skinny legs, but then something happened - my mind snapped out of it and basically said "Enough! Let's fu🤬ING go!" - I walked forward angry but calm saw his incoming kick grabbed it mid air, diverted it to my right and threw a rear high kick slapping the "gentleman's" temple "CRACKKKK!!!" and down he went, the fight was over just like that.
Here's the thing...
Understanding the difference between these two angers are a defining factor between winning and losing in the financial markets, yet very few learn from their outputs and instead point the finger outwardly at others, don't be that guy and instead learn to channel anger into determinative action.
Make sense Ninja?
Channeling rage (especially as a man) is one of our most potent potentialities, but it must be intentful and purposeful and preferably positive if we want to capture it's true essence.
Meditate on this Ninja.
I'll see you in the next ep!
Follow for more.

✨ P2P INDi [PRO] ✨ TUTORIAL ✨1. Go to the 1D time frame
2. Open chart drop down menu and select Point and Figure*
*Point & Figure below the 1D time frame is ONLY available to TradingView members that are subscribed to the Pro plan and above
3. Click on the SETTINGS wheel on the P2P INDi
4. Locate the DEFAULTS drop-down menu and select RESET SETTINGS
5. Click the INPUT tab
5. PIVOT PRICES
(a) Identify price(s) nearest the Pivot High (PH) and the Pivot Low (PL)
(b) Place those coordinates in the corresponding input box
(c) Click OK (at the bottom right)
6. On the Tool Panel (to the left), identify Magnet Mode and turn it on (weak or strong)
7. PIVOT PLACEMENT
(a) Drag the Pivot High line of P2P INDi and snap it on the corresponding X
(b) Do the same for the Pivot Low line and snap it on the corresponding O
8. ANNOTATING TREND
(a) Identify the trend shown on the Heads Up Display (top right-hand corner)
(b) If the DOWNTREND (red) is displayed, remove all three Buy Order TPs
(c) If the UPTREND (green) is displayed, remove all three Sell Order TPs
9. SET YOUR POSITIONS
(a) Place Buy and/or Sell Orders at 2%-3% or less of your Net Asset Value (NAV)
(b) If shaving, take 25% profit at the first two Take Profit (TP) prices.
(c) Stop Losses should be equal to or beyond the PH and PL lines
(d) If stop loss is greater than your risk tolerance:
— lower your position size or
— tighten your stop loss by bringing it closer to your entry
DISCLAIMER: Please notice that we do not provide financial advice — our website, indicators, strategies, signals, and mentorship courses are all intended only to provide a community of support to anyone interested in improving their trading skills. Fx'tive HNW $olutions, Inc. is a California corporation that publishes products and services for developing trading indicators and strategies on demand, renting and selling proprietary indicators and systems, training, and coaching exclusively intended for Daily₿read Subscribers ONLY.
1. INTELLECTUAL PROPERTY
The proprietary indicators, strategies, and content developed by the T.E.A.M. (FRIDAY, P2P INDi, P2P INDi, TEMASHA, The Library, Specialty Lesson, and other utility scripts or educational information), the object of intellectual property rights are and remain the exclusive property of Fx'tive HNW $olutions, Inc., at the exclusion of images and videos and texts free of rights or provided by Fx'tive HNW $olutions, Inc. or external legal or physical person. No assignment of intellectual property rights is carried out through these Terms and Conditions. Any total or partial reproduction, modification, or use of these properties for any reason whatsoever is strictly prohibited without the express written authorization of Fx'tive HNW $olutions, Inc.
2. RESPONSIBILITIES
You declare to know the principles and risks of the financial markets. Therefore, you swear that you know the financial risks involved in trading. In this sense, the directors, employees, stakeholders, and partners of Fx'tive HNW $olutions, Inc. can not be held responsible for errors, omissions, inappropriate investments, technical problems, events beyond our control, and, more generally, financial losses that you may realize, or results obtained in the practice of trading resulting from the services or products it markets.
3. RISK WARNING
Trading involves a high level of financial risk and may not be appropriate because you may experience losses greater than your deposit. In addition, leverage can be against you. Do not trade with capital that you can not afford to lose. You must know and understand all the risks associated with the market and trading. We can not be held responsible for any loss you incur.

Ninja Talks EP 20: The Book of Five RingsAs a martial arts enthusiast I found myself reading (again) my favourite book of all time, "The Book of Five Rings" by Miyamoto Musashi.
TLDR;
A 16th Century Samurai who had 64 duels to the death, never lost and wrote down all his techniques, thoughts and insights shortly before he died atop Mount Iwato.
Yeah I know, crazy, but true.
Anyway, I found myself reading this book again and I got to the chapter on Footwork where Miyamoto states something super important that relates to trading massively and something that will 100% help you in your finance career.
He said, "Tred strongly on your heels and allow leeway in your toes."
Essentially this is how I saw it as a trader.
The heel is the first principles of trading - aka the core fundamental rules you must follow to build your trading career.
The Toes are redundant techniques, noise, other peoples opinions, fake news and basically anything that isn't fixed, but constantly changing instead.
Here's how I see it, as traders we need to "Tred strongly on our First principles" and not get lost in frivolous escapades to find the perfect strategy - it doesn't exist, nor does it need to - because first principles are the building blocks of a successful career, not temporary dopamine Toes the majority of traders chase each day.
The first principles?
+ Psychology before, during and after a trade.
+ Win Rate
+ Risk
+ Reward
+ Entry/Exit technique(s)
+ Intuition (gained from experience, screen time and age)
+ Money Management and Compounding Tactics
+ Awareness (The core core)
Does this make sense Ninjas?
Operating from first principles allows you to focus on what's real and lasting, not things that are illusory and temporary.
That's all for this episode!
If you like this then consider giving a follow for more Ninja Talks.
Keep your blades sharp!
Nick

Master Pattern Trading Strategy | Smart Money Concepts💰10000LADYSUSDT | LONG TRADE
#1 - H8 FLAT BACK BULLISH HEIKIN ASHI ( At the Sweet Spot )
MONTHLY / DAILY / H12 / H8 / H4 BULLISH - UPTREND - Long bias
#2 - Jumped onto the LTF M5 CHART and entered my LONG when price was below the value line in combination with the TDI shark fin entry.
If price is confirmed on a bullish uptrend on the Higher time frame, then we mark out master pattern on our entry charts, and look to take counter trend entries, when price is below the value line for long entries.
These are the best entries to catch the wave of the trend with the lowest drawdown.
#3 - You can exit your trades at value lines or liquidity lines.
Contraction boxes are formed when price squeezes and forms a simultaneous lower high and higher low, this shows that the supply and demand is equalizing.
When price breaks out the box this forms the expansion phase, which is shows incoming volatility is entering back into the market.
When price enters into the expansion phase we can look for trade the range of the 2nd phase and let it carry us into the trend when it moved into the 3rd phase of the market.

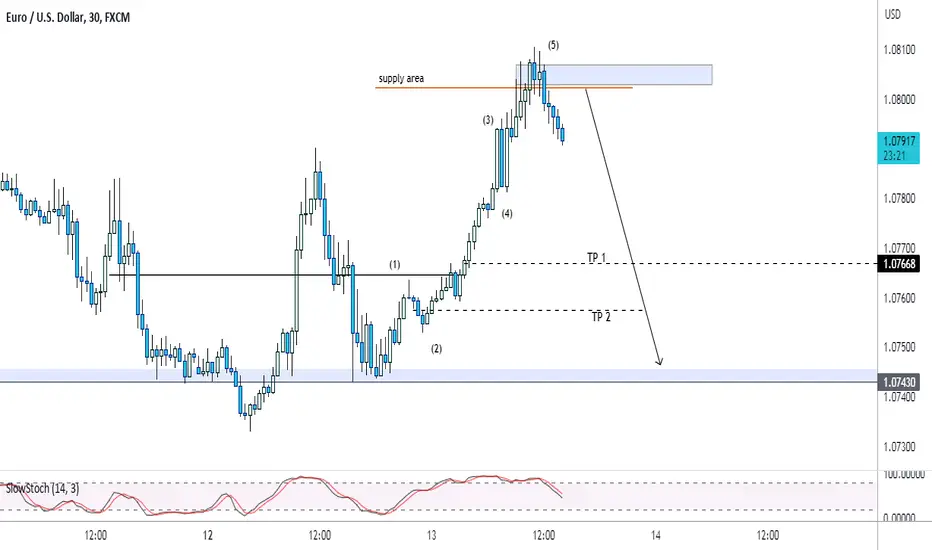
SND VS SMC ViewpointHi
Traders approach the market in various ways, each with a unique perspective dependent on their own viewpoint. Among the many strategies, each has its strengths and drawbacks. Some strategies, like the three drives or dragon pattern trading, are not as widely mentioned or popular.
However, one strategy worth mentioning is the smart money concept strategy. This strategy believes that the market is not driven by news, but rather by institutions and market makers. It aims to explain why reversals occur and how these reversals can benefit market makers or institutions at the expense of retail traders. The strategy is based on the idea that protecting one's stop loss and capitalizing on the moves made by market makers or institutions can result in significant gains for retail traders.
The smart money concept strategy emphasizes capital protection since it is rooted in fear. However, this fear can also work against retail traders. Market makers and institutions can exploit the smart money concept strategy to their advantage. Consequently, the smart money concept strategy is best suited for strategically placing a stop loss rather than trading the market for profit.
Just as the supply and demand approach may not accurately predict momentum breakouts, the smart money concept strategy may not effectively capture strong momentum. Acknowledging that no single strategy is foolproof does not mean that one should ignore the drawbacks of a strategy and become indifferent. In the case of the smart money concept strategy, it is most effective when used for stop loss placement rather than profit targeting.
Here is an example above how SMC and SND may view the market for entry and potential targets. Keep in mind this is just an illustration.
As you can see, the SMC aims to protect the stop-loss for higher profits, while SND is more interested in confirming a momentum zone and then reacting.

Ninja Talks EP 17: OJ Simpson-itusFunniest thing always happens in a bear market;
You get influencer guru wannabe gigachads acting like they're OJ Simpsons lawyer trying to argue a case they know is wrong.
If the glove fits, right?
When the ships sinking peeps turn into three people;
(1) They admit they were wrong, reassess and act accordingly (2) They deny their lying eyes and continue to nuke their Trading account (3) They secretly close their positions, but tell the world they're still open, until it eventually proves to be unpopular in which case they are already safe from any disasters.
That last one is particularly offensive, it's like the elite of the world going into underground bunkers secretly before meteors strike the earth.
Cowardly.
But It's hard to hold people accountable, nor do I care to really do so - the only thing I can do (and you too by proxy) is to not be (2) and (3) - makes you less of a superhero when you are wrong, humans are more relatable anyway.
+ Your audience will appreciate you serving them rather than your own selfish self interests.
Just some food for thought.
Admitting when you were wrong, allows a bonding experience greater than any other.
When was the last time I was wrong?
Well...
I picked the exact top on Tesla, Bitcoin and the stock market, but I didn't think Bitcoin would crack 60k, I had it stopping sooner - but I was wrong - luckily I didn't bet on it or tell anyone else to bet on it, but the fact remains...
...own your loss like a champion and people will respect you.
Or just deny reality, like the guy who says "I'm not crying, my eyes are hot!".
It's up to you Ninja.
Decide what type of financial speculator you want to be.
That's all for this ep, give a like and comment for the algo.
Nick

Ninja Talks EP 16: Rain > Bird > WormTrue story:
Yesterday I was having a cigar perched under an umbrella in the rain - not ideal, but peaceful nonetheless. And out pops a family of birds to feast on the worms that rise to the surface in need of some high quality H2O - little did I know, this would become one of my favourite trading metaphors of all time!
The Rain = Despair/Panic
The Birds = Conscious Investors
The Worms = Unconscious Investors
Look at it like this, when there is despair in the markets and most Bambi traders are caught offside - they panic - they lose hope, and despair grips their fragile little psyche like a 1 year old baby gripping a blueberry for the first time.
They begin to pop to the surface and "show their hands" - which is completely unconscious emotional behaviour not rooted in reality, experience or indeed even their very own strategy.
They're ripe to be plucked from the market.
That's where the Bird (conscious Investor) comes in - after patiently waiting for hours, days, weeks or even months, the conscious investor enters as the worm exits their positions (either manually or automatically by way of stop loss).
The bird claims the prize...
...and the worm never learns.
This cycle is as old as the markets themselves and is just a constant reminder that, as Warren Buffet once said;
"The stock market is a device for transferring money from the impatient to the patient."
From the unconscious to the conscious.
From the worm to the bird.
From the amateur to the pro.
This is trading.
The most patient trader who can abstain from emotional and physiological urges gets to observe more data from the market, thus giving him a higher level of certainty to act on said data - and when it's time to act, fear is nonexistent in his mind.
Understand?
See you in the next episode Ninjas!

Learn THE BEST Breakout Trading Strategy
Hey traders,
Breakout trading is one of the most popular trading strategies.
Being quite simple in theory, it remains quite complex and complicated in practice.
In this post, we will discuss 7 steps every breakout trader must follow.
💬And just in brief about a breakout trading itself:
this method aims to spot a key level (it might be horizontal support/resistance or a trend line) and then to trade its occasional breakout, assuming that it will trigger an impulsive move.
1️⃣No surprise, the first task of a breakout trader is the identification of key levels. Preferably, these levels should be spotted on weekly/daily time frames.
Here on US100, I executed structure analysis and identified key levels.
2️⃣Once key levels are spotted, a breakout trader should patiently wait for the test of one of those. His goal is to wait for a breakout.
In that step, many traders fail. The problem is that in order to confirm the breakout, one should have strict & reliable rules to follow. The rules that describe a confirmed breakout.
*I apply the following rule: the breakout of a level will be considered to be confirmed once the candle closes above/below the structure on the highest time frame where the structure is recognizable.
In the picture above, we see a confirmed key level breakout.
3️⃣Once the breakout is confirmed, the next step is to wait for a retest of a broken level. Why retest? Simply because a retest gives a better risk to reward ratio for the trade. And even though there is no guarantee that the price will retest the broken level and because of that some trading opportunities will be missed, in the long run, retest trading produces higher gains.
Following our example, the price has retested the broken level.
4️⃣Opening a trade on a retest, one should know the exact target levels. The levels where the profits will be taken. Again, newbies traders make a lot of mistakes on that step. Remember that your targets must be realistic, they must be based on closest strong structure levels, not on your desired returns.
5️⃣Also, a breakout trader should set a stop loss. And again, a stop-loss level must be safe, it must be set at least below/above a previous minor structure to protect you from stop-hunting.
Stop-loss reflects the point where the trader becomes wrong in his predictions and where the trading setup becomes invalid.
In our example, the safest stop loss will be below a local low. Take profit - next key resistance.
6️⃣Once the trading position is opened and stop-loss & take-profit are set, one should patiently wait. There is no guarantee that the price will start falling/growing sharply after the breakout. The market may start coiling for quite a long period of time before it starts acting.
Breakout trader must be patient, not allowing his emotions to intervene.
Returning to our example, after some time, the market easily reached the TP level and went much higher.
7️⃣Lastly, one should remember that his exit points are stop-loss/take-profit levels. Stop-loss adjustment in case of a position drawdown, preliminary profit-taking, and target extension are your worst enemies. Be disciplined, don't be greedy, and keep your emotions in check.
Here is the example of a breakout trade that I took following the strategy:
I spotted a confirmed breakout of a key resistance. The price formed a high momentum bullish candle and closed above the structure.
Long position was opened on a retest.
Target was based on the closest horizontal resistance.
Stop loss was placed below the closest horizontal support.
The market quickly reached the target.
Of course, this 7-steps trading plan is not sufficient enough for profitable breakout trading. There are so many nuances on each step of the plan to consider.
However, let this plan be your initial guideline: learn & follow that and with time, keep elaborating its rules until you become a consistently profitable trader.
Are you a breakout trader?
Let me know, traders, what do you want to learn in the next educational post?

Ninja Talks EP 13: Monk ModeA Bambi's biggest trading obstacle in 2023 will be over trading in a bear market, especially the crypto kiddies looking for their next pump.
This is why you have to restrain from whoring yourself out to the market in the hopes of making a quick buck.
We call this, monk mode.
Not the whoring, the opposite.
Monk mode is abstinence from indulgence and has been the theme of a couple of our past episodes - and for good reason, it's what 99% of tiktok traders these days suffer from, so as a public servant and your local connoisseur of fine trade ideas I give you the following guidance.
Create a fatal funnel of filtration.
Filter trades through a strict process.
Example;
Potential
Potential high quality
Triggered high quality
Triggered+ confirmation on lower timeframe high quality
You can use tradingviews watchlists and flag function to get the job down easy.
This process will ensure you (1) Take only A+ setups (2) Remove all unnecessary trade setups (3) Maintain a higher win rate (4) Improve confidence and reduce anxiety and most importantly (5) Eradicate over trading.
Does this make sense what I'm saying?
Tldr version;
Create a very strict filtration system to ensure you don't chase weak trades and only profit from A+ setups.
Hope this helps.
Follow me here and on Twitter for more.
See you in the next episode Ninjas!
Nick

Ninja Talks EP 10: Snollygoster Definition;
"A rude and unscrupulous person".
Many-o-moons ago I used to believe trading was a team sport (I know, how naive of me) but that's because I joined some supply and demand community where we all traded the same strategy.
These days I'm more of a Snollygoster.
I can't help it.
When I see other traders, I see them as competition - even those I teach!
You see the thing is, it helps my trading when I understand that when I win, someone else loses.
Why?
Because it's true.
There's always "someone" on the other side of our trades wether we like to think about it or not.
We've been conditioned to think the market has a "mind of its own", but it really doesn't - it's just a sum of its participants, which for the most part are individuals.
Indivuals who are all looking to out smart and win against other traders.
It's not a game.
Bruce Lee on fighting;
"Fighting should be like a small play, but played seriously."
Same goes for trading.
Keep your emotions, mind, analysis etc light and playful, but always understand that this is serious.
When you look at the market as another human you'll understand how to "outsmart " it (for lack of a better word).
Imagine you're up against yourself, how would you analyze the charts?
Find YOUR stop losses and key levels - then see how you can take advantage.
This is 5D chess trading at its finest and the quickest most lucrative way to become a gigachad trader in 2023 and beyond.
Understand?
Follow for the next episode of Ninja Talks.
Nick

Ninja Talks EP 9: Despair and HopeDespair and Hope, two sides of the same coin and the two emotions that rule your decision making.
In my 10+ years of trading experience, I'm not sure it's even possible to not feel or be aware of them in some way - what I'm saying is, I don't know if you can get rid of them entirely from your trading.
It may just be a constant (and natural) part of being a trader.
These days I use the intuition, awareness and knowledge about these two emotions to make the bulk of my money.
Techniques are autopilot at this point, same goes for money management, but psychology - hope - despair? They seem to be a daily "battle".
I put "battle" in quotes because, yes it's back and fourth but it doesn't need to be adversarial, do'ya know what I mean?
Too many Bambi traders run from despair and seek hope, but I use them differently - I use them as sensors of when to time an entry and exit perfectly - kinda like parking sensors on modern day cars, they're there to warn you - it's not good or bad, it's just warning you.
Hope this helps, follow for more Ninja Talks.
Nick

Entry Plan After BreakoutHello traders. Having a trading plan is very important and you should always have a plan before you enter a trade. Here I explained 4 types of possible entries when breakout occurs.
You can see here example of a consolidation between support and resistance zones. Strong breakout occurs, and what to do now? Should we sell immediately after breakout? Maybe, but its usually very risky. Especially if you use narrow stop loss. So it is much better choice to wait for one of these 4 possible outcomes.
First and the best choice is to wait for a retest of a broken support. Maybe some nice candlestick pattern formation or pattern like double top.
Sometimes full retest will not occur, but its possible to see wick rejection. This is second option and it can be very useful in a volatile markets.
If a pullback is strong and price breaks previous support again, we can start asking questions is this a fake-out? It is hard to tell depending on a situation, but anyway, it is time to change our plan. What do to now?
Now we have third option, which is to wait for a retest of previously broken support and then look to enter a trade. So price returned to our consolidation zone, and now we wait for a retest.
Sometimes pullback will be very strong and go all the way through our consolation zone and break previous resistance (or support). In this case we can look to enter once the price retests this key zone/level.
This is the plan that I try to follow. You can adjust it, or change it as you wish, but the point is to have one (Entry Plan).
Have a great day!

Trading Groups And Why They MatterHi there,
When it comes to trading groups, there are both potential benefits and considerations to keep in mind. Joining a trading group can be a valuable opportunity for traders seeking fresh perspectives and innovative ideas to enhance their understanding of the market.
Benefits of trading groups include exposure to diverse concepts and techniques that can broaden your trading horizons. They can serve as a platform for exchanging insights and learning from experienced traders, helping you stay updated with market trends.
However, it's important to approach trading groups with some caution and conduct thorough research before joining. Here are a few factors to consider:
1. Groupthink: Being part of a group can sometimes lead to conformity and biased decision-making. It's important to maintain an independent mindset and critically evaluate the ideas and opinions shared within the group.
2. Risk management: Trading groups may have different risk tolerances compared to individual traders. Assess the level of risk associated with the group's strategies and ensure it aligns with your own risk appetite.
3. Financial considerations: Some trading groups may have membership fees, subscription costs, or commissions on recommended trades. Understand the financial implications of joining a group and ensure it fits within your budget.
4. Personal trading style: Evaluate whether the trading group's strategies and recommendations align with your own trading style and objectives. Maintaining control over your decisions is crucial for long-term success.
5. Transparency and accountability: Look for trading groups that prioritize transparency and accountability. Members should be held responsible for their actions and decisions, fostering a trustworthy and supportive environment.
While trading groups can provide valuable insights, remember that your own knowledge and skills are paramount. Dedicate time to educate yourself, practice patience, and develop your own trading strategies. Striking a balance between learning from others and nurturing your individual approach will empower you to make informed decisions and thrive in the dynamic world of trading.
How to Use the Supply and Demand Deluxe Indicator
Welcome, fellow traders, to this exciting tutorial where we dive deep into the world of supply and demand analysis using the powerful Supply and Demand Deluxe indicator that I launched this morning. Prepare yourself for an enjoyable learning experience as we unravel the mysteries of supply and demand levels across various timeframes. So, grab your favorite trading beverage, sit back, and let's embark on this adventure together!
Section 1: Understanding Supply and Demand Analysis:
Before we delve into the specifics of the Supply and Demand Deluxe indicator, let's understand the importance of supply and demand analysis in trading. Supply represents the availability of shares or contracts for sale, while demand represents the number of buyers interested in purchasing those shares or contracts. By analyzing the interaction between supply and demand, traders can identify potential turning points, support and resistance levels, and areas of high buying or selling interest. This knowledge forms the foundation of effective trading strategies, and the Supply and Demand Deluxe indicator is here to assist us in this journey.
Section 2: Introducing the Supply and Demand Deluxe Indicator:
The Supply and Demand Deluxe indicator is a powerful tool designed specifically for TradingView. Its primary goal is to identify supply and demand levels on various timeframes, including weekly, daily, and hourly. With visual plots and customization options, this indicator empowers traders to make well-informed decisions based on the principles of supply and demand. It caters to traders of all styles and timeframes, from day traders to long-term investors.
Section 3: Getting Started: Installing and Adding the Indicator to Your Chart:
To begin using the Supply and Demand Deluxe indicator, install it on your TradingView platform. Visit the TradingView website, navigate to the indicators section, and search for "Supply and Demand Deluxe (Stock Justice)." Click on the indicator to access its details and add it to your chart. The indicator will be added and ready to unlock its potential.
Section 4: Exploring the Key Components and Functionalities:
Let's explore the key components and functionalities of the Supply and Demand Deluxe indicator, which help us identify and interpret supply and demand levels effectively.
4.1 Daily and Weekly Pivots:
Daily and weekly pivots provide essential reference points. The indicator allows you to plot the previous week's high and low, yesterday's high and low, and the midpoint of yesterday's range. Visualizing these pivots helps gauge potential areas of interest and determine price behavior.
4.2 Weekly Supply and Demand Levels:
Weekly supply and demand levels are critical for understanding the broader market context. With the Supply and Demand Deluxe indicator, you can plot these levels, customize the number of levels displayed, choose line colors and styles, and decide whether to extend the lines. Enabling the "Show Price" option enhances your analysis.
4.3 Daily Supply and Demand Levels:
Similar to the weekly levels, daily supply and demand levels provide valuable insights into intraday price dynamics. Customize the number of levels displayed, choose line colors and styles, and determine line extensions. Enabling the "Show Price" option visualizes corresponding prices.
4.4 Hourly Supply and Demand Levels:
Intraday traders will appreciate the Hourly Supply and Demand Levels feature. The indicator automatically identifies these levels based on the highest and lowest values of the past 10 bars. Customize the number of levels displayed, choose line colors and styles, and even show prices associated with these levels.
4.5 ATR Expected Moves:
The ATR Expected Moves feature calculates expected price moves based on the Average True Range (ATR). Customize the lookback length and multipliers. Extend lines, choose colors and line styles, and display prices. Incorporating ATR Expected Moves helps set realistic profit targets and manage risk effectively.
4.6 Futures Levels:
For futures traders, the indicator provides specific levels for the Midnight Open, London Open, Asian Open, and the 8:30am EST level. These levels act as potential reference points, aiding in identifying intraday opportunities and aligning trades with global market dynamics.
Section 5: Customizing the Indicator to Fit Your Trading Style:
The Supply and Demand Deluxe indicator offers customization options to align with your trading style and preferences.
5.1 Adjusting Input Parameters:
Fine-tune the indicator by adjusting parameters such as the number of levels plotted, lookback length, multipliers for ATR calculations, and more. Experiment with different settings to better suit your trading strategy.
5.2 Customizing Visual Elements:
Customize line colors, styles, and extension options to enhance aesthetics and readability. Choose colors, line styles, and decide whether to extend lines to the left, right, or both. This level of customization ensures a visually pleasing trading experience.
Section 6: Practical Applications and Trading Strategies:
In this section, we explore practical applications and trading strategies using the Supply and Demand Deluxe indicator.
6.1 Identifying Key Supply and Demand Levels:
The indicator helps identify key supply and demand levels across different timeframes. Analyzing these levels in conjunction with other technical analysis tools can identify high-probability trade setups.
6.2 Using Pivots for Reference Points:
Pivots, both daily and weekly, serve as crucial reference points. Consider price reactions around these pivots and consider them in conjunction with supply and demand levels to gain valuable insights into market dynamics.
6.3 Incorporating ATR Expected Moves in Risk Management:
Use the ATR Expected Moves feature for risk management. Set realistic profit targets and define appropriate stop-loss levels based on expected price moves. This statistical framework helps adjust position sizing and manage risk effectively.
Section 7: Tips and Tricks for Maximizing the Indicator's Potential:
To enhance your trading experience with the Supply and Demand Deluxe indicator, consider these tips and tricks:
7.1 Leveraging Different Timeframes:
Analyze supply and demand dynamics across different timeframes. Use higher timeframes for overall market context and lower timeframes for precise entries and exits. Combining multiple timeframes improves analysis accuracy.
7.2 Combining Multiple Timeframes:
Combine the Supply and Demand Deluxe indicator with other technical analysis tools such as moving averages, oscillators, or chart patterns. This synergy provides confirmation signals and increases the probability of successful trades.
Section 8: Conclusion:
Congratulations on completing this comprehensive tutorial on the Supply and Demand Deluxe indicator! We've covered the fundamental concepts, explored features and functionalities, and discussed practical applications and trading strategies. Experiment with different settings, customize visual elements, and integrate the indicator into your trading plan. As you gain experience, you'll be well-equipped to make informed trading decisions. Keep exploring, stay disciplined, and may the markets bring you success!

A BASIC ENTRYThis right here is my favorite type of entry where you can basically see a nice bottom and re-test from the pullback before so in my eyes coming back down to this price too fill in the gaps is a MUST PAY ATTENTION type of trade... too me this is a continuation of price action. NOW! don't just get to your desired price and throw a market order in just because it's there? Wait for some big volume to come through, wait for the next pullback... Getting too the price is one thing... but knowing what to do next is the ball game.
I mean if I can get the price too come down far enough that i can set my SL behind a bunch of big 4HR, 1D bottoms and scale down to a lower TF too catch a clean leveraged trade. That's a strategy in itself... To add a focus on discipline, mindset, psychology, family, friends, work! an all-round lifestyle as a SOLDIER! you come to realize that trading is such a very small part of the game. Nail life first... then that simple strategy might just work.

📈 Fibonacci Power in Uptrends📍 What Are Fibonacci Retracement Levels?
Fibonacci retracement levels—stemming from the Fibonacci sequence—are horizontal lines that indicate where support and resistance are likely to occur.
Each level is associated with a percentage. The percentage is how much of a prior move the price has retraced. The Fibonacci retracement levels are 23.6%, 38.2%, 61.8%, and 78.6%. While not officially a Fibonacci ratio, 50% is also used.
The indicator is useful because it can be drawn between any two significant price points, such as a high and a low. The indicator will then create the levels between those two points.
📈 To effectively trade Fibonacci retracements during an uptrend and strategically enter the market during pullbacks, follow these steps:
🔷Identify the uptrend: Determine the presence of a clear upward price movement.
🔷Apply Fibonacci tool: Utilize the Fibonacci retracement tool to identify potential retracement levels within the uptrend.
🔷Focus on pullbacks: Wait for the price to experience a pullback or retracement within the uptrend.
🔷Assess Fibonacci levels: Analyze the price's interaction with key Fibonacci levels, such as the 61.8% or 65% zone, to identify potential support or resistance areas.
🔷Higher highs confirmation: Look for the formation of higher highs after the price touches a Fibonacci level, indicating a continuation of the uptrend.
🔷Entry opportunity: Consider entering the market after a pullback when the price resumes its upward movement, using appropriate risk management strategies.
By combining the power of Fibonacci retracements, recognizing pullbacks in uptrends, and waiting for higher highs, traders can position themselves to capitalize on the potential profit opportunities offered by the market.
👤 @QuantVue
📅 Daily Ideas about market update, psychology & indicators
❤️ If you appreciate our work, please like, comment and follow ❤️

The Secrets of Making Four Figures Through Trading. The secrets of making four figures through trading.
In this Trading view Post, we will explore the key strategies and considerations that can significantly enhance your swing trading results. As a forex coach specializing in this trading style, I'm excited to share valuable insights and empower you to achieve your financial goals.
Small Accounts are Out, Prop Firms are In
Problem : Insufficient Earnings with Small Accounts
Solution : If you aspire to make four figures, it is essential to trade with five figures. Turning $100 into $10,000 or $500 into $100,000 is much quicker and more feasible when you have a larger capital base. With a prop firm, you can afford to trade less frequently and prioritize quality over quantity, eliminating the struggle often associated with small account trading.
Implement a Proper Risk Management Strategy
Trade with Skill, Not Luck
To safeguard your capital and increase profitability, it is crucial to limit your risk on each trade to no more than 1%. This approach allows you to rely on your trading skills rather than luck. Remember, success in trading is a result of consistent and disciplined decision-making.
Consistency in Risk Allocation
Maintain a consistent 1% risk level as your account grows. As your balance increases, the amount of money you risk will grow proportionally. For example, if you start with a $100,000 account, you would risk $1,000 (1% of $100,000). As your account balance reaches $101,000, your risk would be $1,010 (1% of $101,000), and so on. Consistency in risk allocation ensures that your percentage risk remains the same while adapting to account growth and drawdown phases.
Leveraging Position Sizing Based on Account Size
Your position size, or lot size, plays a critical role in determining how much you value each pip movement. It is essential to find the right position size to prevent excessive drawdown or losses that can jeopardize your trading account. Position sizing calculations consider your account balance, percentage risk, and stop-loss levels.
For instance, if your stop loss is 30 pips and you have a $10,000 account, your position size would be $100 (1% risk) divided by 30 pips, resulting in $3.33 per pip. Your lot size will be 0.33 per pip . By maintaining consistent risk management practices, you can aim for profitable trades while preserving capital.
Focus on Higher Reward-to-Risk Opportunities
Problem: Losing Trades Depleting Capital
To sustain long-term profitability, it is essential to prioritize trades with a higher reward-to-risk (RR) ratio. Winning trades compensate for losing trades and help you overcome drawdown phases. Avoid subpar trades that you force or that fall below your minimum RR requirements.
Strategies to Achieve Higher RR:
Multiple Timeframe Analysis: Shorten Stop Loss
Analyze multiple timeframes to identify strong trade ideas. Once you've determined a suitable trade on a higher timeframe, drop down to lower timeframes to tighten your stop loss. This approach allows you to manage risk effectively and maximize your RR ratio.
Utilize Higher Timeframes or Tools: Extend Take Profit
When dropping down to lower timeframes, refrain from shrinking your take profit target. Instead, utilize higher timeframes or tools like Fibonacci to extend your take profit level. By setting reasonable profit targets, you increase the potential for achieving higher RR trades.
Main Talking Point 3: Quality Trades and 4-Figure Trade Planning
Problem: Inconsistent Trading Results
Solution: Trading with a focus on quality trades offers numerous benefits. By targeting high-quality opportunities and planning trades effectively, you can profit during trending markets, reduce mistakes, and avoid the need to chase after four-figure profits.
Commitment to Make 4 Figures & Stay Under Drawdown Limits
Plan Weekly and Allocate Resources
Plan your trades every Sunday to determine the potential profit or loss for each trade. Identify high-quality opportunities and allocate 1% of your capital to each trade. Assess if each opportunity meets your minimum RR requirements and if it brings you closer to achieving four-figure profits.
Example: $10,000 Account
Suppose you risk $100 on Trade 1 and make $333 (3.33% return), followed by risking $103.33 on Trade 2 to make $516.65 (5.16% return). After two trades, you have earned $849.65, representing an 8.49% increase in your account balance. Continuously monitor and adjust your trades to maintain profitability.
Is this possible? Yes!
Is this easy? No!
Why? Because you'll have to get out your own way and head to make this possible.
While achieving consistent four-figure profits through trading requires dedication and skill, implementing the strategies discussed in this post can significantly enhance your chances of success. By trading with a prop firm, implementing proper risk management strategies, focusing on higher RR opportunities, and prioritizing quality trades, you can navigate the dynamic world of trading with confidence and boost your financial growth. Remember, trading success comes from discipline, continuous learning, and a well-defined trading plan.
Best of luck on your journey to four-figure profits!
Shaquan
Hey! If you found this post valuable like the post and let me know below what was your takeaway❤️
