Supply and Demand

KCE - reverse position just in timeGood traders will stopped out the position.
Best one will reverse it.
I can’t remember who said this ,but I did remembered it from the book called The Market Wizard by Jack.
I was holding a very large position of KCE in the morning because it was the last Big-Cap stocks in SET that still had a strong big-buyers. But these kind of stock tend to do a very aggressive moves through time. Holding these kind of stocks need a closer attention. Today is one of those days. The stock opened with yesterday’s high. But due to the very bad market condition, I prepare my stop loss at the very tight 24.00. It did fall. I sold it by the way and sold it all at 23.7. I did accept the loss due to my big position. But after it fall down to 23.4 with a very large momentum, I began to short it ( using DW ). Putting by using DW is very risky so I bought it with a very small volume and increased it by the way with profits. I sold half of it at the market closed. It was a right call. Today I only suffered some small losses.


BGRIM dilemma momentThe moment here is very frustrating. Good trade usually turns out to be a good trade immediately.
Selling the unwanted stock also needed art. Selling here is considered as a very bad spot. I will give the stock another day for a trend reversal.

BTCUSD (M's amd W's) I like to visualize that supply comes from above and that demand comes from below.. yes, a simple concept.
A bullish market is bullish because of a lack of supply. A bearish market is a bearish market because of lack of demand. Tom Williams discusses this concept in greater depth in his text "master the markets" which you can get for free. If you are curious as to why markets do what they do that book can really change the way you look at this. Actually, I think you are doing yourself a disservice by not reading that book.
The only way the market can move through a support or a resistance area is if the volume is low. The market is always looking for the "path of least resistance" (another concept covered in master the markets. In order for the market to determine this it has to test.
There is a bit more to it (health of the trend, news, pre-determined value areas) but for now:
If there is a lack of supply at resistance (with strength in the background) the market will be free to mark-up into the next value area.
If there is a lack of demand at support (ith weakness in the background) the market will be free to mark-down into the next value area.
You must be able to interpret volume... which is kinda easy to do with a little practice!
Good luck!
Practice**

Bitcoin : sweet spotHello all, here we start the chart work on bitcoin again. On this technical analysis, I will cover the movement of the bitcoin on smaller degree, we use the 4 hours time frame to analyse this movement for bitcoin. Let's get start!
Just like what I've wrote on the title of this analysis, I call the blue areas 'sweet spot'. Just like what you've seen on the chart, since the January 10th, the price has consistently bounced of this blue regions as well. This blue region is the previous broken resistance that become a support in the upcoming moves. However, if you use this break out strategy, since in the beginning of the January, you'll get a tremendous amount of profit.
And in the last period of price action, the price has already tested the previous broken resistance that becomes a support as well and it bounced! will this be another sign to forms an upward movement? if yes, the next target will be on the white zone which I've anticipated on my previous post.

Gold Price Will be $2000| Silver Price Will Be $20 end of 2020I just want to inform to all traders out there that the price of XAUUSD Gold will be touch $2000 and the price of silver will be up to $20 by the end of 2020.
If looking into the history of the gold, long before the price reach $1000, many traders will not expect the price will be going to hit $1583 today.
Year 2000 = Price $277
(10 years later)
Year 2011= Price $1921
Drop year
Oct 2012 - Dec 2015 = Price $1046.46
Demand increase
Year 2016 - Feb 2020 = Price 1583
End year 2020 = 2000?
WHY? If looking into the mining and production to produce gold bar has been drop recently. Comparing to the crisis now that want gold to be a safe heaven asset.
Fiat currencies that you have in your pocket will decrease its value. If you trade forex, just the all of the currency. Are the going up? The answer is NO.
All currencies is dropping.
Tips for you guys for long term:-
1. Currencies- Sell for long term for position trader
2. Gold and silver - Buy for long term position trader
3. Commodities - Buy for long term position trader
What ever supply will be finish and could not cope the demand, go for long trade
What ever supply that losing its value per time, go for sell trade
You will not losing money if you hold your trading as per my tips (just make sure your account balance is high enough to run the price movement and put a low lot)
By Zezu Zaza

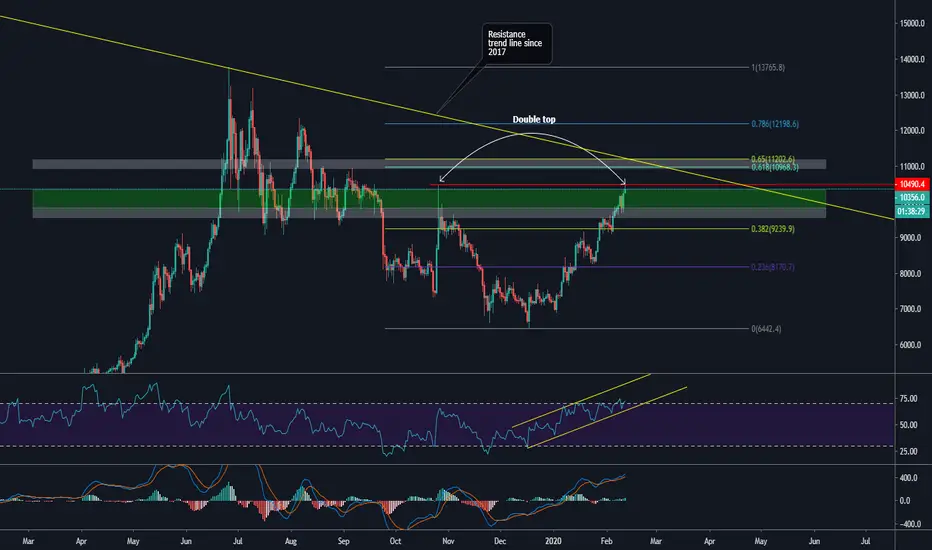
Bitcoin update : Crucial levels and where to head nextHello all, it's been a very bullish pressure for bitcoin and current crypto market and therefore, In this technical analysis I will cover about bitcoin based on the daily time frame. Let's get it started.
Bitcoin is currently trending at around the green region which I've acknowledged before as a liquidation zone of current movement. But, with latest movement to the upside, this liquidation zone could means nothing if the price continue its bullish momentum to the upside. And therefore, we must anticipate the next potential resistance for bitcoin to head of.
First minor level which I want to anticipate is at current region which is the red line and area around the $10500 region as a double top region comparing to previous swing high. I make this as the minor support because at the previous action of bitcoin which around October 26th, 2019. The price was heavily rejected when it touched this area. Will it forms the same price action as this past historical action? We don't know it yet.
The second crucial level that I want to cover is the resistance around $10900 - $11200 region. It will be very ignorant for me to not anticipate this area of resistance because it has the alignment with a lot of factors of current price formation. It's moving align with the golden pocket, heavy price action and the most important thing is the resistance trend line that has been established since 2017.
The RSI is forming a higher high and higher low consistently since the bottom of November 23rd, 2019 . And it's now the first time that it enters the overbought region since 2019.
This is going to be a very important period for bitcoin and just to be honest with you that at current degree and current level, I really don't feel comfortable if the price pushes to the higher level of price again. There are a lot of reasons that make this market very manipulative.
USDJPY "no-supply" and "push-through AR" examples using BBRefer to VSA for more detailed explanation of "no-supply"/ "no-demand" and "push-through AR/AS".
Using Bollinger bands can be very useful for setting alerts. I like to know when price is testing any of the 3 points on the BB (lower, higher, median).
Here, the 15 minute used for targeting the above signals.
Practice*
PM me any questions on TA or refer to the listed resources below.
Sources of education:
Richard Wyckoff
Tom Williams Volume spread analysis VSA/ Master the Markets
Pete Faders VSA*
Wyckoff SMI
Read the ticker dot com
Wyckoff analytics
Dee Nixon
BTC trading challenge price action/volume techniques
Good luck

USDCHFWyckoff acumulación. Lección a aprender; ver la imagen grande en el mercado. Buscaba ventas en temporalidades más pequeñas cuando en realidad el proceso de acumulación estaba completándose. Ahora a esperar el retroceso para comprar y terminar el ciclo

Market OpportunityI see a possible capture of traders whom open short positions in that resistence and then blow their SL and the price go down to the fresh demand zone. The demand zone confluence with a Daily and Weekly timeframes and i´ll be waiting a reaction near 1.65000


Bitcoin Space Launch - a basic EMA pictorial (Bull Run to 9k)Use snapshot link below if the text and objects are overlapping. Sorry, I'm still learning how to publish content. Tips and suggestions welcome!
What is this?
Quickly learn some basics on EMAs (Exponential Moving Averages). Right.. the E does NOT stand for "Emotional"... However, if your are trading too often without making gains, then you may need to learn about those too! Also, don't get upset with me if BTC crashes tomorrow...
Which reminds me to inform you that... I am not a professional, but I do invest responsibly and believe that you should too! Please do you own research! (DYOR)
If you dig this pictorial or the full history chart of BTCUSD, then please give a Like! Also, I believe you can "make it yours" for future reference by click on the share button and selecting "Make it yours".
Thanks and enjoy your trades!

EURUSD 30 JAN 2020 2200hrsLesson learned (again)..
Don't overlook the daily and larger times frames for key S/R areas. Definitely higher priority areas of volume information. Its very important to know where you are in relation to these area. Because your mind can entice you to buy right into a key resistance or sell right into a key support, this is very dangerous .
Any time price goes against you, it would be a good idea to make a mental note of where you were )price wise) in relation to key S/R areas. Maybe even take a look at the most recent news announcement. Basically the same if you do find yourself in a good trade.
In this example, price is in very close proximity to a key daily support area. Its in a down trend.
How strong is this trend, was there any notable accumulation/positioning? Is it in an accumulation phase and if so where is it within the trading range?
I imagine anyone that went after it short near that support is now hoping the downtrend continues. But can we confirm that it will? Or will it make another fake attempt to lure chasers and trigger stop losses creating a massive amount of volume that is enough to force a mark-up?.. really killing the ones holding short, moving stop-losses higher/still hoping.
Practice*

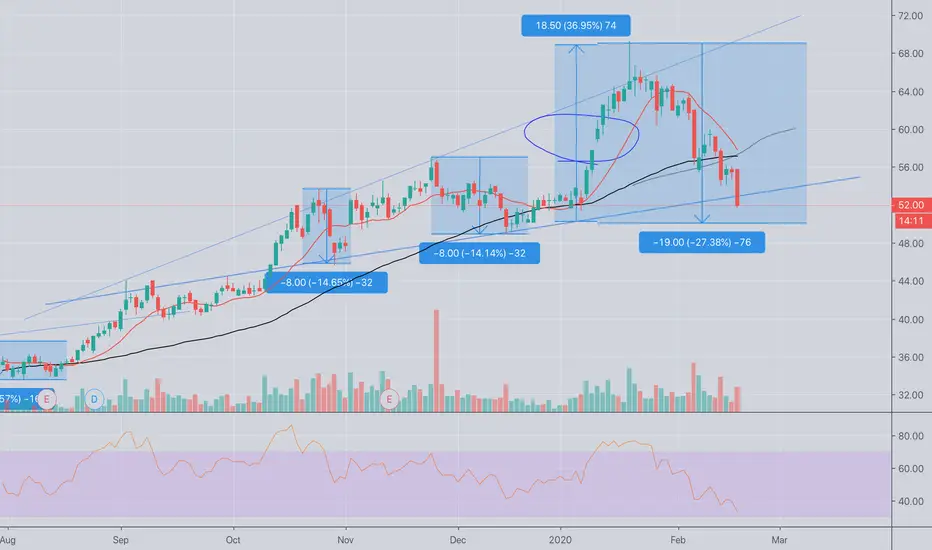
[Eric's Trading System] The Vertical Resistance AreaIntroduction:
The Vertical Resistance Area can help us identify the entry opportunity when we make short trade. It is formed by at least three candlesticks:
1. bullish candlestick or bearish candlestick
2. bullish candlestick or bearish candlestick
3. bearish candlestick , the close price must lower than the low price of the second candlestick , meanwhile, there is a significant increase in volume , this is the most important requirement.
The third candlesticks help us identify whether there formed a vertical resistance area .
How to draw the vertical resistance area
1. the top should be the highest price of the second candlestick
2. the bottom should be the entity bottom of the second candlestick
You can adjust the resistance area flexibly.
Three Steps to Trade
1. Identify
2. Wait for the price raise back
3. Find a reversal signal in small time periods, such as inside-bar, pin-bar
Q&A
Q1. If the third candlestick close price higher than the high price of the second candlestick , but the volume didn't increase, should we identify it as the vertical support area?
A1. We can also look at it as the resistance area , but it is not as strong as we think, you should focus on the reaction when the price back the area
Q2. Can the trend always reverse at the resistance area?
A2. Of cause not, but it can help up improve our breakeven, we can trade with a lower stop loss.
Q3. Can the price always raise back?
A3. Not for sure, if we miss the opportunity, find the next
Hi, I'm Eric , a cryptocurrency trade enthusiast, focus on harmonic trading, I am going to share my trade though which will help me review and improve my trade system I think.
If you like my thought, please give me a like. Thanks

USDJPY Trading range labeling game (28 JAN 2020)/practice*Never received any formal Wyckoff training. Have been trying to put it together so if this is not 100% accurate, bear with me... its practice.
Bing Wyckoff accumulation schematic and there you will receive a plethora of Wyckoff accumulation and distribution schematics. In my opinion, understanding what this is must be central to your trading style.
Wyckoff developed the blueprint in the 1930's and has stood the test of time. Even with the automation and the speed/access to the markets by the layperson, the principles of supply and demand have remained the same.
Sources of education:
Richard Wyckoff
Tom Williams Volume spread analysis VSA/ Master the Markets
Pete Faders VSA*
Read the ticker dot com
Wyckoff analytics
Dee Nixon
BTC trading challenge price action/volume techniques

USD/ZAR Are the Bulls Warming Up for a Run? This tutorial is for demonstration and education purposes. For full study as we go along please join my $19 subscription channel where we day trade based on price action at www.celestefrederick.com
Price action trading is like reading a book. As price plays out we take note of what is occurring and can draw conclusions along the way based on price action at key zones in the market.
A few points to note in favor of bull run:
1. The past few weeks have seen more bullish momentum with pullbacks.
2. Price has breached the 200 MA on the daily timeframe. Price could very well attempt to maintain a footing above the 200 MA.
3. We see price is at a key level in the market. See how price likes the zone where we currently are by looking left.
4. Bearish momentum over the past day could very well be a re-test after a break of this key level as demonstrated with my notes. Price could then continue up after the re-test.
5. Keeping fundamentals in mind, with the economic outlook of South Africa and the impact of the Coronavirus in China, the outlook could negatively impact the South African economy. China is a key investor of the South African economy. Economic consequences of the virus spill over to South Africa.
We still can't count the bears totally out.
However, price action tells the story..Will price breach the current zone where it is sitting and pullback? Price action will tell.
My study group is catching pips on this pair daily based on price actions in the market daily. Would love to have you join us!
Please visit my website at www.celestefrederick.com to see my subscription packages and also other free resources. Please also refer to other trade ideas on USD/ZAR which help support this study. Links to a few are below.
Happy Studying and Trading!

EURUSD ACCUMULATION SCHEMATIC #2EURUSD WYCKOFF ACCUMULATION SCHEMATIC #2
-Here is the link to the image example this was based off from
school.stockcharts.com


A crucial level for bitcoin.Hello fellas, here I give you another detail analysis about bitcoin based on daily time frame which is very important. So, let's get it started.
Bitcoin has shown us a very decent amount of gain in the last 2 days of trading. The price is now touching the crucial area if we zoom out to the daily time frame. This area however is a heavy resistance for bitcoin, it has the confluence of the upper line of the channel and simply the red dynamic line which is the 200 MA on daily. But, there are things that still becoming my concern which is based on the historical performance, when the price tested the upper line of the channel, it always ended up with a wick that I consider this as a bull trap. That's why, I will look the price to breaks out of the white region which is the previous broken support that is now become resistance as well to enter my long position and targeting the $10000 region for mid term set up.
The MACD is now ticking up to the upside and try to claim back the positive are of the histogram. The RSI has not shown any sign of divergence as a reversal pattern yet.
I will expect a high volatility later in this condition. I will wait patiently until the price breaks out of the white resistance zone to enter a huge long position.

Bitcoin : A good day to start the weekHello fellas, welcome back to my technical analysis about bitcoin. My apologize to not very active lately due to some other eve that we have to took care in last week. But, the most important thing is that we're back now and I promise you that this update will be very interesting and very detail. The clue is that this week is gonna be awesome!
First, let's see the close of this week's candle which is for me looks bullish and indicate a bullish movement for intra day level. the wick toward the down side is showing how the bulls is having a good work to defend the territory of $8400 as a support in short term.
Second, I see a very awesome graph on MACD indicator. On the histogram, it has ticked up to the positive side and the moving average is having a good golden crossover to the upside.
Third, on the price action, I still see a probability of the price to test again the blue region as the previous broken support that is now become resistance. And from here, I will look for higher time frame bias which show you 2 kinds of perspective. The first one is the bullish perspective (white) and the second one is the bearish perspective (yellow).
$9680 level will be a good area to watch in mid term. Hoping the price will touch this area soon.
