Supply and Demand
Late Cycle... or New Cycle? When will it end!Its worth considering what market cycles can tell us about when this run will end. I won't (can't) explain the logic behind cycles, but they appear in every aspect of nature, which includes human behaviour. Seasonality is a well known example.
Using the Dow Jones as a barometer, its clear that there were 7 years between the 2002 and 2009 lows. We can't predict exact business cycle lengths, but it would seem from recent history that the next could have ended somewhere between 20015 to 2016. Because this did not appear to happen, investors now worry that a correction is overdue.
But what if the cycle low did happen? The market did not in fact move for nearly two years - from January 2015 to the elections in 2016. If true then the next mid-cycle, marking a peak, is towards the end of 2018. Interestingly this coincides with US mid-term elections, and in Europe the exit of the UK from the EU. 2018 could also mark the turning point for 'Quantitative Tightening' and monetary policy.
Momentum certainly is driving prices higher for now; reflecting easy financial conditions, low unemployment, and reasonable growth.
Behaviourally, a bull market end when 'bears' throw in the towel, and euphoria reigns. For any market, it creates a simple demand/supply imbalance. This cannot be said of the current state, and so we may look to 2018 for the final phase.
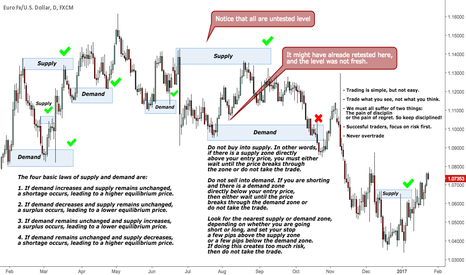
The Power Of "FRESH" Supply & Demand ZonesDetermining the strength of the fresh zones.
Every time the trend changes direction, it is because of a change in the balance of supply and demand, but to use this to our advantage we need to know the likelihood of that imbalance being there the next time price returns to that zone. Supply and demand zones are similar to support and resistance lines in that supply zones provide resistance and demand zones provide support. When price breaks through a supply zone it becomes a demand zone, and when price breaks through a demand zone it becomes a supply zone—the same way a resistance line turns into support when broken and a support line turns into resistance.
The similarities end there, though. A support or resistance line requires at least two points separated by time to be drawn, where a supply or demand zone can be plotted from one candle. Most traders will tell you that you should have three points for a support or resistance line to be drawn. Traders are also taught that the more times price bounces off of a support or resistance line, the stronger that line is. The opposite is actually true.
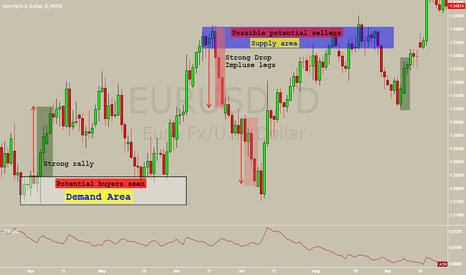
How to draw Supply and Demand zone. ( EDUCATIONAL)1) We have to find the strong impulse move ( At least three impulse move, I like the big bars). Lets say a rally or a drop.
2) Right underneath we have to find a consolidation area where we will mark the zones from the body to the wicks.
3) Drawing the zones is an art, so make sure you have a good look at them, Ignore the wicks at the top if you are buying and ignore the wicks in the lower side if you are selling. Refine the zone and you can trade it with 1:1 RR. Stops below or above the zone + few ticks.
4) Divergence works pretty well in these kind of zones with engulfing patterns and pinbars.
5) Harmonic trading can be used here, most probably when the ratios fall inside the zone, could a very very good potential trade.


