Supply and Demand
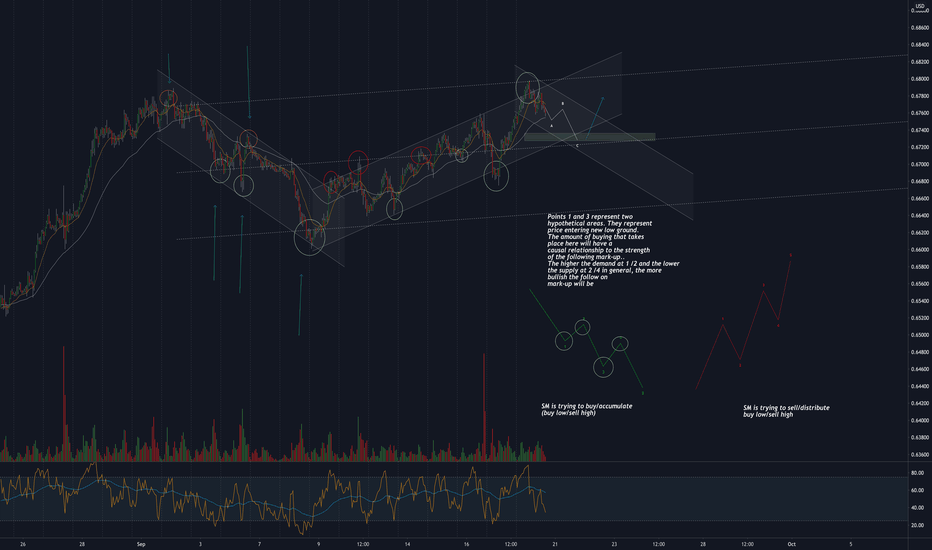
Trend analysis/Building the cause in a mark-down (reference)As part of a thorough trend analysis you can use the 1 hour to determine the condition of the current trend and how it will determine the condition of the following Mark-up or mark-down phase.
(In order to draw anobjective channel i suggest activating the linear regression indicator)
As a visual aid/reference imagine the upper line of the channel as your supply line and the lower line of the channel as your demand line.
Imagine the buyers at the bottom and the sellers at the top.
With each tap off of the demand line, how did the volume change, how large was the presence of buyers?
Same with the supply line
With each tap off of the supply line , how did the volume change, how large was the presence of sellers?
Roughy estimate what side of the equation is higher.. the buyers or the sellers?
RSI is another story . Just know that is the edges that should be of concern with RSI, not the center.
Risk:Reward - Utilize the lower time frame charts!DISCLAIMER: Trading Forex involves risk and you may lose more money than you started with! These posts are not to be taken as trade recommendations or financial advice and I offer NO guarantee that any of these ideas will result in profit. Also, trade ideas may change, depending on ever-changing market conditions. You are trading at your own risk and past performance is NOT indicative of future results. Please, know how much you are willing to risk on EVERY trade that you take and be SMART!
Simplify your trading. Always measure your risk and be okay with being wrong ; ) Wait patiently and get the price that you want. Use the market. Don't let the market use you.
GBPAUD - Full Analysis BreakdownWelcome traders to a free analysis breakdown.
Today I am highlighting possible trades on GBPAUD, if you any questions on the pair let me know in the comment section below.
I will be looking to take a trade on the pair if our trading rules are met over the next few days.
I would suggest keeping this pair in your watchlist to see if your own rules are met. If you take a trade from the analysis in the video leave a comment in the section below.
If you enjoyed the free analysis break down please like and follow the channel, this will support the creation of more free education.
Once the pair has met one of valid rules for entry I will be sharing the trade with the Alpha community.
Feel free to comment below a topic you would like me to cover in the up and coming videos.
Trade Safe
Alpha Trading Group.
Analysis: Using the McGinley, Hull and Renkos together!DISCLAIMER: Trading Forex involves risk and you may lose more money than you started with! These posts are not to be taken as trade recommendations or financial advice and I offer NO guarantee that any of these ideas will result in profit. Also, trade ideas may change, depending on ever-changing market conditions. You are trading at your own risk and past performance is NOT indicative of future results. Please, know how much you are willing to risk on EVERY trade that you take and be SMART!
Simplify your trading. Always measure your risk and be okay with being wrong ; ) Wait patiently and get the price that you want. Use the market. Don't let the market use you.
GBPUSD Identifying fake break outs/bear traps using BB/BB%An oscillator is an oscillator. There are some variations.. I don't think any of them are better or worse. An indicators effectiveness is only as good as the operator using it. Point is, this applies to RSI, MFI, Stoch/stoch RSI. You just have to know what things mean when they get there... and its not hard.
Skipping other factors and focusing on the spring/fake out here.
breaking this down in 2 ways:
1- Bollinger band.
if you look carefully at where the candle breaks the demand/support line make note of the volume and wether of not it was stopping volume (refer to master the markets/wyckoff analytics for in depth explanation or stopping action)
look at the double bottom fake break out on the formation furthest left: support was formed on high volume - price rises to test resistance where the volume dissipated- then as price returns to test that support, it fakes a move to the downside (bear trap). Schematic provided.
price leaves the trading range and begins marking up.. if price leave the tr you dont want to chase but want to wait for an additionl pullback.
Break-test-continuation schematic provided.
example furthest right is a repeat. Re-accumulation/support established.. break of support on the re-test.. FAKE OUT
2- BB% (oscillator).
if looking for a long entry and waiting for the fake out bear trap.. you will generally see it appear in 2 places (ON THE 1 HOUR)
either a break of the median line with stopping volume
or
a break of the "oversold" level of your oscillator
Area of confluence high lit.
The entire process reverses in a downtrend scenario (upthrust/fake break out).
More interesting things to look for with an oscillator will follow.
GBPUSD Bollinger band/BB% (tips/tricks)Here the color scheme was changed to represent our favorite two things in trading: supply/demand.
If you are new to trading or supply/demand methods, You can maybe employ BB's (or any other channels).
Red/supply line: use as reminder not to buy into weakness.
Green/Demand line: use as a reminder not to sell into strength.
More important.. think of the green line as the "accumulation" or demand side
Red as the "distribution" or supply side.
Look at where all the action is. Look at were the candles were before any subsequent impulse. Where do they generally begin from?
taking a look at the BB and BB% do any moves really begin near the median? .. generally no.
this is what is meant buy fishing from the edges and not from the center.
Using the BB% (RSI/MFI will be similar) .. look at the same thing. Look at the extremes or edges and the volume.
When price breaks the demand line, is the volume high? is there active accumulation going on?
- IF the volume is high with each break of the demand line, they are buying and likely looking for a clear mark up path, which can take days.
When price breaks the supply line, is there an increase in volume pushing the price back into range?
-IF the volume is high with each break of the supply line, they are selling and likely looking for a lack of demand which allows for a clear path to mark don... this can also take a few days.
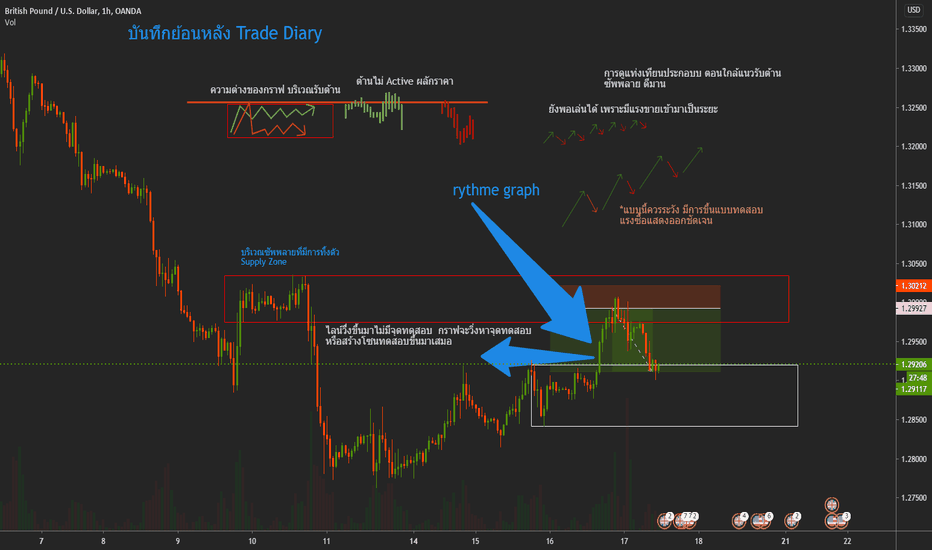
Biggest takeaway from this is the principle of not buying or selling when price is in the middle of a range. When price is in the middle of a trading range or consolidation (some of you know it as consolidation, just another way of saying trading range) the market is IN BALANCE.. there is equilibrium between supply and demand at that moment.
Price will "consolidate" for either a mark-down or a mark-up. When price is behaving in this manner it means that it has not decided which way to go and is waiting for an imbalance... if more supply accumulated then demand... price will fall..if there was more demand than supply.. then price will break to the up side.
PM if confused!
Avoid buying into weakness/supply/resistance
Avoid selling into strength/demand/support
Avoid entry when price is in middle of a range (phase B)
And
Don’t let them win
EURJPY - Using indicators to make a sound decision on directionDISCLAIMER: Trading Forex involves risk and you may lose more money than you started with! These posts are not to be taken as trade recommendations or financial advice and I offer NO guarantee that any of these ideas will result in profit. Also, trade ideas may change, depending on ever-changing market conditions. You are trading at your own risk and past performance is NOT indicative of future results. Please, know how much you are willing to risk on EVERY trade that you take and be SMART!
Simplify your trading. Always measure your risk and be okay with being wrong ; ) Wait patiently and get the price that you want. Use the market. Don't let the market use you.
EURUSD What to look for when price is drawn to low pressure/refYou may have to zoom into the areas here to see the detail.
I tried to point it out on the chart. It's not difficult to see.
TA is an exercise in logic. There are principles and there are techniques.
If you understand the principles then it almost doesn't matter what tools you use. However there are tools that will facilitate in enhancing your ability to see the principles at play. They can go hand in hand. If you only now how to use indicators (or think you do) but you dont understand the reason why the market moves the way it does, you are going to eventually run into issues because you are expecting your indicator to do something but it does not and you may not be able to articulate why and you should be able to.
VOLUME is essential if you want to track the movements of institutions.. AKA SM.
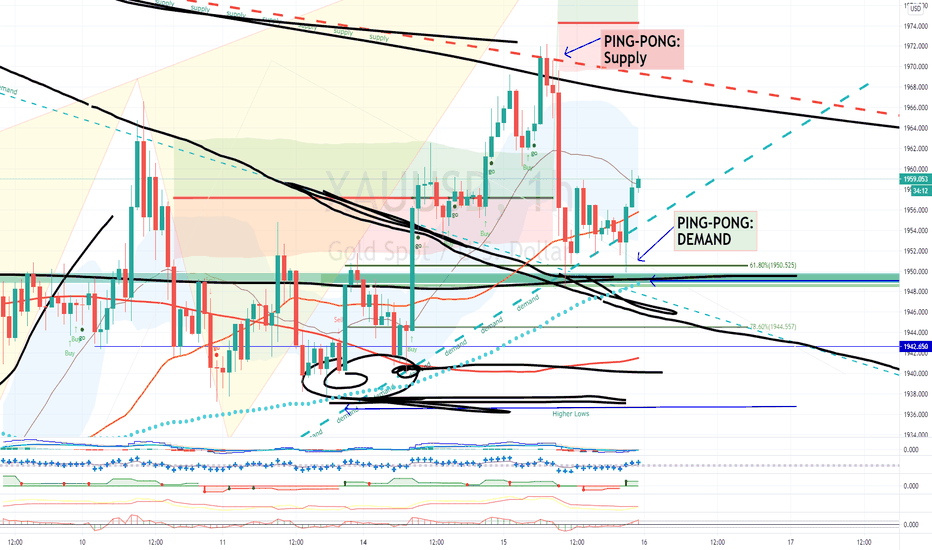
Price will generally be drawn to the path of least resistance(low pressure). Make a note of these areas.. draw a box/line. Wait for price to get drawn to this area when the market begins to open...
As price is drawn to that low pressure zone for a test or re-test.. watch the volume... watch the pressure.
The example here was fairly clean and is self explanatory
Learn volume.. add it to your current game.. start being aware of it and start using it. HUGE disadvantage if you choose not to (IMO)!
I am retired so have had some time on my hands with all thats going on. I really enjoy the problem solving exercise that TA is.
I almost max out my allowable posts every day... I deliberately put the date and time. You can see the after action for yourself.
Volume works.
Sources of education:
Richard Wyckoff
Tom Williams Volume spread analysis VSA/ Master the Markets
Pete Faders VSA*
Read the ticker dot com
Wyckoff analytics
Dee Nixon
Good luck
Avoid buying into weakness/supply/resistance
Avoid selling into strength/demand/support
Avoid entry when price is in middle of a rage (phase B)


