EURCAD/Wstop hunt entry, wait for a break of the support and reach demand zone.
Entry 1.41500
R: 9.64
Supply and Demand


Bitcoin : Long term, Logarithmic and $1000Hello all, here we go again with the bitcoin's analysis. Here I provide you the long term projection of the bitcoin.
First of all, before you start to read this analysis, I want you to know that I'm one of the bitcoin's enthusiast which is very loyal with bitcoin. I personally believe in bitcoin's prospect in the future. And the last thing is that this analysis is just 1 of some potential scenario to occur in the next future and not a FUD at all.
So, here I use the Logarithmic view on weekly chart and using the BITSTAMP market price because it provides a longer historical data comparing to the other exchanges. There are 2 support trend line that has held the price of the bitcoin which are yellow and green. For the yellow trend line, we can see that it had been broken down on October 2018 and the 2019 bull run is just an action of retest toward this previous support trend line that is now become resistance. And for the green trend line, we can see that it still holds the price of bitcoin from further drop, this trend line has already held the price of bitcoin since August 2015, this is a 4.5 years trend line!
This January 2020 bulls market could only be the relief rally because the price has already touched the green support. When the price touch the 4.5 years trend line, it has to respect this area as well before breaking it down. And if we see the price breaks down of this green support trend line, I will targeting the $3000 as the double bottom and $1000 simply if the support can't hold.
The action on the yellow trend line is clear that the price has already broken it down, retested it as the broken support that became resistance and the price got rejected. Simply, if we use the break out strategy as our benchmark, current cycle could be the 3rd phase of break out strategy which is very bearish!
Please once again takes note that this is only the worst scenario for bitcoin and personally, I don't like this scenario to occur. So, don't make this as the only path that is available because there are still a lot of bullish scenario too.

USD/ZAR Price Action Study - Read Contents - Do Not PresumeThis study is for demonstration and educational purposes, and study of this will start with the related idea which is linked below. As you recall, I suggested to long term buyers to beware. A few points I would like to make:
1. We are still in a bearish trend, until price breaches the trendline as noted in this tutorial. The bullish price action we have seen thus far could be very well corrective, and not a reversal of the trend.
2. Price is currently sitting at a key level in the market, at the 61.8% fib level from the latest swing points.
3. Price action will tell us if we will see more action to the upside or downside. Watch price action at the key zones as noted, and use other confluences for your entry.
Given this, do not presume on the market but we must study price action as it relates to the zones as noted. For more in depth study on this and how to determine zones and key levels I invite you to join my new subscription service.
I am now offering a subscription service for concentrated study of this and other pairs. Please visit www.celestefrederick.com to subscribe to this service for less than $10 per week.
My subscription service will include access to:
Group Chat, where we will discuss charts, education, and fundamentals
Exclusive Webinars
Trade Ideas with Entry and Exit Suggestions
I am also having a free charting webinar on this Saturday, January 18, 2020 at 11:00 am. Visit www.celestefrederick.com to register.
You can also follow me on Instagram and Facebook.

Daily perspective : trend continuationHello fellas, here I give you another perspective of bitcoin in the daily time frame. In the last few days, the price of the bitcoin is moving so slow and we see decrease in volatility unfortunately. So, I hope after the weekly candle closes in the next few hours, we will see the volatility coming back again.
First of all, I want to give you the explanation of the divergence between the price and the oscillator indicator. There are 2 basic types of divergence if we compare the price with the oscillator indicator. The first divergence is the regular divergence which will indicate the reversal opportunity. And the second one is the hidden divergence which will indicates the trend continuation. And in this analysis, I will give a highlight on the 2nd type of divergence.
From the chart, we can notice a very important price action behavior if we compare it with the oscillator indicator. And the oscillator indicator that I'm using is RSI. we can see that since the August 6th, the price has showed us a lower high structure although at current rate, I'm not so sure if the price has already topped yet. And on the RSI, we can see that it forms a higher high structure since the August 6th, 2019. However, with this current structure, there is a possibility of bearish trend to continue if we get a confirmation of lower high comparing with the top of October 26th.
This hidden divergence perspective will be invalidated if we see the price breaks out of the white resistance zone.

USDCAD long setup example as i was practicing =, this formation appeared. I thought there were a few things that stood out that were worthy of sharing. Always refer to Tom Willams VSA and Wyckoff for formal explanation and resource (never pay, resources are freely available)...
background was an uptrend. Objective is to find entry signals that align with the trend on the back of SM.
You should be able to clearly see a "fall through the ice" situations here. (break of support). Upon the break of support, price finds very high volume (demand) which created a violent rejection back above the broken support. Very typical VSA SOS. The spring action is circled in red. Notice again the rapid rejection right back into the TR on high volume. The spring also happened to be a 50% fib retracement (green box). This is a potential entry area.
Break-test-continuatioin pattern after the spring (2nd potential entry area) . Slight volume expansion on test (maybe called an LPS) circled in blue. The LPS converges with the 14/50 ema ad previous resistance turned support.
The trend line would have been drawn in hindsight but the 50% fib retrace could have been plotted. However, you do see the convergence after the fact.
set-up took about 2 session to begin playing out.
There are a few more variables that could be talked about here, but I am sticking to the highlights. Again, please refer to VSA and Wyckoff for more detailed training and entry techniques.
practice*
“Patience is key to success not speed. Time is a cunning speculators best friend if he uses it right”
Jesse Livermore
Sources of education:
Tom Williams Volume spread analysis VSA/ Master the Markets
Richard Wyckoff
Pete Faders VSA*
Read the ticker dot com
Dee Nixon
BTC trading challenge price action/volume techniques
Good luck


My favorite Volume Profile setup EXPLAINEDMy favorite Volume Profile setup EXPLAINED on recent trade on EUR/USD

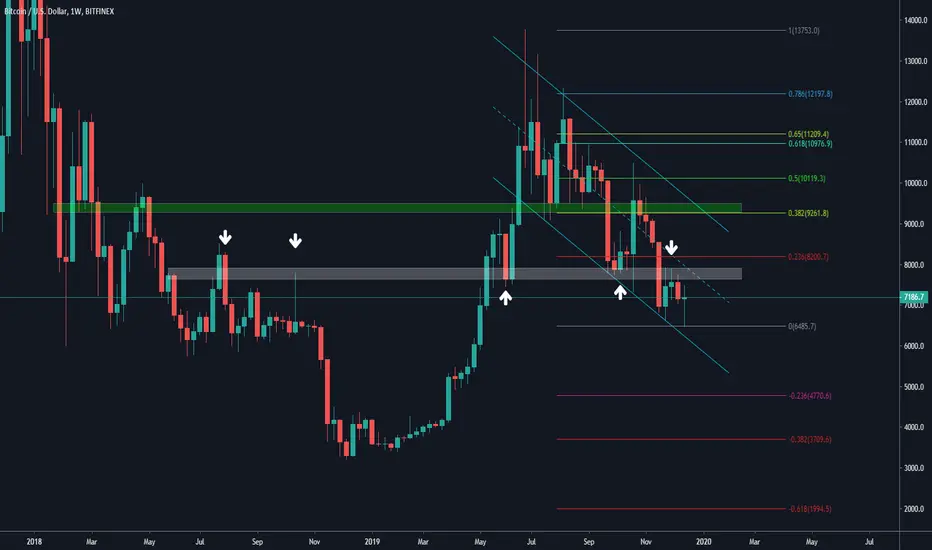
Bitcoin Update : Elliot wave count, Invalidate previous analysisHello fellas, welcome back to the Sunday night update about bitcoin. Today is the January 5th, 2020 and this is going to be an awesome update for bitcoin for mid term use of trading set up. Here we go.
I have to admit that my previous perspective which said that the B wave has already confirmed could be invalidated when the price breaks the green region around the $7500 region. From my newest perspective and EW count that is very updated, we can see that there is a possibility for bitcoin to form an ABC structure which the B was bottomed at around the golden pocket region which coincides with the previous broken resistance that was become a support as well.
The 3-3-5 structure for the potential ABC corrective wave of the whole bearish structure could be in play with the potential target minimum at 1.1 fib extention around $8000 - $8100 region which once again coincides with the 38.2 fib retracement from bearish impulse wave of higher degree (gray region).
Break out of the green region will be another long entry or you can adjust the long entry when the price touches the yellow region as a pull back that I expect to occur in near future.
What can I say, mid term could be bullish, but for long term we're still under a huge pressure of bearish structure. And what my position for now? a big 0!


USDZAR Key Zone Study - With Video Analysis - Read WithinWe had a great time this past Friday studying USD/ZAR and key zones/levels pertaining to this pair.. To Watch the replay of ForexNChill visit the YouTube video at www.youtube.com
This idea is being posted as an educational post, following the study from the ForexNChill, where I share how I study this pair. A few things to note as we study:
1. Note price has rejected key levels in the market with a few failed attempts to rally to higher prices.
2. Price has fallen beneath the 200 MA on the daily timeframe; given so, we are open for further movement to the downside as a possibility.
3. The short term 9 EMA and 50 EMAs have crossed to the downside. This could mean that we will see lower prices.
5. The 50 EMA has crossed beneath the 200 MA which could signal a death cross, with further movement to the downside.
Given this, my inclination is that we have a bit more room to the downside to go; we could see a pullback or a retracement before seeing a continuation of price further down. HOWEVER, It is also not out of the question that we will see a strong bounce around key levels as noted and movement towards the upside. Watching price action at the key zones as noted is key to analysis. There are a few possible scenarios that could happen. Hence the various directions noted. However, again, my overall inclination is that unless we see a notable reversal or strong bullish momentum building, I think we have more room to the downside to go.
For now, study, watch and observe price action around these key levels. As price approaches these levels study candlestick analysis. Time will tell and the market will tell us in time what it wants to do. Never presume on the market, but allow price action to show you along the way.
To see the study on this pair and how to use market structure and price action to study this pair visit www.youtube.com
To receive personal mentorship or join the educational platform to which I belong visit www.celestefrederick.com
Visit the Contact Me page on my website and type in FREE RESOURCES to get free resources to help you learn how to study price action.
Always use proper risk management and use your confluences before entering.

Bitcoin liquidity runIf we are going to close daily above $7300 then we can expect run on liquidity up to $8000 (liquidity of shorters who put their stops above daily highs, it will cause pressure for close their shorts and lots of shorters will be also liquidated which will push price higher).
It can also be possible, that on December 18th we had bottom in Bitcoin and can see a potential bullish scenario in Q1 2020.
But firstly, let's see how Bitcoin will close daily and react on the main daily resistance at $8000 and $8400
The very nice video on this topic has been created by exchange FTX where CEO, Sam, explains how poorly handled liquidations trigger a domino effect that leads to large price spikes and clawbacks.
www.youtube.com

MAJOR TOOL YOU MUST HAVE IN YOUR TRADING TOOL BOX!COINBASE:BTCUSD
SUPPORT AND RESISTANCE COVERED! It is so important that you understand support and resistance. It may seem so basic but this alone can make you consistent profits. Understanding where the market may pivot is an edge you simply can not afford to not have in your technical plan.
If you have any questions or comments, leave them down below and i will get back to you! want a topic covered? let me know in the comments.

Major Downtrend:Bearish MarketAUDNZD ,a major downtrend ,both H4,D1,WI,
Price is between S and D zones forming a descending triangle and a potential continuation if demand zone is broken
Monitoring.
WARNING AM A NEWBIE FOLLOW AT YOUR OWN RISK.

BTC : Is the bottom in? (Multiple time frame analysis)Hello fellas, welcome to another detailed technical analysis update about bitcoin. Once again, yesterday we saw a huge bullish momentum that make the price surged to the area of confluence which is around $7500 - $7600 region. This was surprising me because just to be honest with you. I never expect that way. But, it's alright as long as our position has stopped in profit of course. Now, the main question is whether it's the reversal pattern or is it just a relief rally with a manipulation in it? Let's see here!
First analysis will be on the weekly based analysis which could show us more confirmation on what the major trend is. And from this time frame, I can give you the 2 important things that can be very important to be our benchmark for key levels.
The first highlighted thing is the down trend channel that however is still respected by the price, This channel Has held the price since June 2019, it's the 6 months channel! and of course, we must as a trader respect it and it will be very ignorant to me to say that this isn't important.
The 2nd highlighted region will be the white zone. Looking at this region, it was becoming a support which has broken already and clearly it's now become a huge resistance and what more interesting is this region is having an alignment with the median line of the channel. And mostly, the price will be rejected when it tries to retest this region again.
A lot of people will think that this current down trend channel that holds the price is the pattern of bear flag. But, even if we're trading at bear flag, the key point will be when the price break the upper line of the channel to confirm this bear flag.
That's why I will choose to be realistic and wait until the price breaks the green region which is still far from our level right now to confirm the bullish bias..
EU : Shadow support and potential level to watchHello fellas, Here it is the short term view of current movement of EURUSD and today's potential movement for EURUSD .
Today, we can expect the price to test this 2 regions which are the yellow support trend line and the blue region as a shadown support which have the confluence with the previous yellow line.
Yellow line is simply the support trend line that has held the price since November 29th, 2019 and breaking down of this yellow line will lead the price to further fall around the white support trend line as the S1.
Look at my long term bias on my previous analysis in related idea

EU levels to watch this weekHere it is I present to all of you about the EU chart and potential levels to be tested in this week. I want to give several highlighted things in this chart.
First, Looking at the green resistance trend line, this is the resistance trend line which has driven the price since september 2018. This is however become the massive trend line and on daily chart, this resistance trend line is having an alignment with the 200 MA. So, currently the price has now showing the rejection toward this resistance trend line and this action is just showing us that the price still respect current resistance area.
Second, Looking at the price actually has formed the higher low structure and looks like the higher high structure will be formed in the near future. This is a pretty good pattern combination for now. After the price breaks out of the green zone, we'll see a rally toward the upside and long position for swing could be activated.
This weeks we will see a little retracement toward the 1st support zone or maximum to the 2nd support zone. But, my main bias is still testing the green resistance trend line.

DOUBLE BOTTOM PATTERN, How to trade it...DOUBLE BOTTOM
It is a reversal pattern and it forms in a Downtrend
It consists of a lower low followed by a point that is unable to make a lower low, after that price will start
making higher lows instead of lower lows.
This is a sign that the down move is over and price has the potential to reverse to the upside.
HOW TO TRADE IT:
This pattern usually occurs after price form a descending channel, we wait for a breakout of the descending trendline as well as the resistance level that will become future support and then we wait for a bullish corrective structure such as ''Flag/Wedge/Triangle'' to buy on a breakout.
*Thankyou for reading*

Coinbook Strategy using EOM (1 Hour)Buy the code and trading idea details behind this strategy at coinbook.com
We will backtest your trading idea for free: coinbook.com
We build custom trading bots. Please reach out to implement this idea at support@coinbook.zendesk.com.

Coinbook Strategy using EOMBuy the code and trading idea details behind this strategy at coinbook.com
We will backtest your trading idea for free: coinbook.com
We build custom trading bots. Please reach out to implement this idea at support@coinbook.zendesk.com.

Coinbook Strategy using EOMBuy the code and trading idea details behind this strategy at coinbook.com
We will backtest your trading idea for free: coinbook.com
We build custom trading bots. Please reach out to implement this idea at support@coinbook.zendesk.com.

EURUSD: FORWARDTESTING Supply and DemandThis trade is for my own personal record. Idea obtained from forexmentor:
www.forexmentoronline.com
Theory is that after 4-10 days, when price revisits a a loosing retail trader's position, they would be inclinded to close the trade. creating some liquidity for institutions. Just going to monitor the white area and see what happens.
