Clear DayTrading strategy video. The "Inside Bar"🔉Sound on!🔉
📣Make sure to watch fullscreen!📣
Thank you as always for watching my videos. I hope that you learned something very educational! Please feel free to like, share, and comment on this post. Remember only risk what you are willing to lose. Trading is very risky but it can change your life!
Trend Analysis

Understanding the ICT Venom ModelIn this video I break down the ICT Venom Model as recently described by the man himself on his YouTube channel. I am sure he has more details on the model he has not released, but I basically attempt to give my two cents on NQ and the model itself.
I hope you find the video useful in your endeavours regarding learning ICT concepts as well as trading in general.
- R2F Trading

Using Fibonacci/Measured Moves To Understand Price TargetThis video is really an answer to a question from a subscriber.
Can the SPY/QQQ move downward to touch COVID levels (pre-COVID High or COVID Low).
The answer is YES, it could move down far enough to touch the pre-COVID highs or COVID lows, but that would represent a very big BREAKDOWN of Fibonacci/ElliotWave price structure.
In other words, a breakdown of that magnitude would mean the markets have moved into a decidedly BEARISH trend and have broken the opportunity to potentially move substantially higher in 2025-2026 and beyond (at least for a while).
Price structure if very important to understand.
Measured moves happen all the time. They are part of Fibonacci Price Theory, Elliot Wave, and many of my proprietary price patterns.
Think of Measured Moves like waves on a beach. There are bigger waves, middle waves, smaller waves, and minute waves. They are all waves. But their size, magnitude, strength vary.
That is kind of what we are trying to measure using Fibonacci and Measured Move structures.
Watch this video. Tell me if you can see how these Measured Moves work and how to apply Fibonacci structure to them.
This is really the BASICS of price structure.
Get Some.
#trading #research #investing #tradingalgos #tradingsignals #cycles #fibonacci #elliotwave #modelingsystems #stocks #bitcoin #btcusd #cryptos #spy #gold #nq #investing #trading #spytrading #spymarket #tradingmarket #stockmarket #silver

The Power of Technical Indicators: ETH 4H Chart Breakdown📈 In this analysis, I demonstrate how a combination of key technical indicators can provide high-probability trade setups. By using Auto Fibonacci Gauge, Quantum Moving Average, Momentum Charge Theory, and Smart Money Concept, we can decode market movements with precision.
🔹 Auto Fibonacci Gauge: The Perfect Retracement
The Auto Fib Gauge shows a textbook retracement, respecting key levels like 23.6% & 61.8%.
These levels act as potential reversal zones where price reacts based on trader sentiment.
🔹 Quantum Moving Average & Momentum Charge Theory: Trend Confirmation
The Quantum Moving Average aligns perfectly with the momentum shift, confirming trend direction.
The Momentum Charge Theory further validates entry & exit signals, showing confluence with the Fib levels.
🔹 Smart Money Concept: Tracking Institutional Moves
The SMC method helps identify where large institutional orders (aka smart money) are likely placed.
Key structure points like BOS (Break of Structure) & CHoCH (Change of Character) signal potential trend shifts.
📊 Why is this important?
Combining these indicators enhances probability of successful trades.
Understanding retracements, momentum, and institutional order flows helps traders avoid weak setups and trade with confidence.
🚀 What’s your take? Do you use similar confluences in your trading? Let me know in the comments!

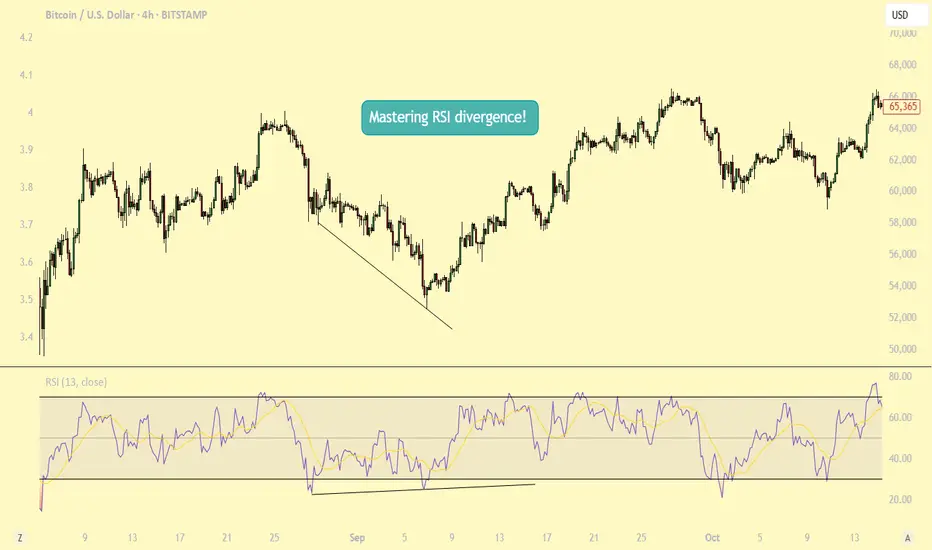
Mastering RSI Divergence: A Complete Guide to Trend ReversalsWhat Are Divergences?
In this guide, we will explore the concept of divergence and how it can be effectively utilized alongside the Relative Strength Index (RSI), one of the most popular momentum indicators in technical analysis. Divergence occurs when the price of an asset moves in the opposite direction of an indicator, such as the RSI. Understanding RSI divergence can be a powerful tool for identifying potential trend reversals or continuations. In this guide, we'll delve into the various types of divergence that can occur with the RSI and how to incorporate them into your trading strategy.
Types of Divergences?
There are three primary types of divergence: bullish, bearish, and hidden divergence. Each signals a distinct market condition and potential outcome, and understanding these nuances is key to using divergence effectively in your trading.
1. Bullish Divergence Bullish divergence happens when the price of an asset makes a lower low, while the RSI forms a higher low. This indicates that although the price is declining, momentum is weakening. The failure of the RSI to confirm the new low in price suggests that selling pressure is diminishing, potentially signaling that a reversal to the upside could occur. Essentially, the market is losing its downward momentum, setting the stage for a potential bullish move.
2. Bearish Divergence Bearish divergence occurs when the price forms a higher high, but the RSI forms a lower high. This indicates that although the price is rising, momentum is weakening. It suggests that the uptrend may be losing steam, signaling that a potential reversal to the downside could be on the horizon. As the price continues higher, but the RSI fails to confirm the new highs, it may indicate that the market is becoming overextended and ready for a correction.
3. Hidden Divergence Hidden divergence differs from regular divergence in that it signals a continuation of the existing trend, rather than a reversal. It typically occurs during pullbacks or retracements in a strong trend. Hidden divergence can appear in both uptrends and downtrends, providing traders with an indication that the prevailing trend is likely to continue after the short-term retracement is over. This type of divergence serves as a confirmation of trend strength and helps traders stay in profitable positions during market pullbacks.
Why Are RSI Divergences a Powerful Tool?
RSI divergence is a powerful tool in trading because it offers early insights into potential trend reversals or shifts in momentum before these changes are fully reflected in price movements. By recognizing divergence, traders can anticipate shifts in market sentiment and make timely decisions. One of the main reasons RSI divergence is so effective is that it serves as an early warning system. It signals when the momentum behind a price trend, whether up or down, is starting to weaken.
For example, in a strong uptrend, if prices continue to make new highs, but the RSI fails to reach new highs, this could signal that the buying momentum is losing strength, even though the price is still rising. This divergence indicates that a reversal or pullback might be imminent, allowing traders to exit their positions or prepare for a potential shift in market direction. Understanding this early warning can provide traders with an edge, helping them avoid being caught in the late stages of a trend and positioning themselves ahead of a change.
How to Trade RSI Divergences?
When the price makes a higher high but the RSI fails to confirm with a higher high, this is known as bearish divergence. While this situation suggests weakening momentum, it doesn’t necessarily mean a correction is imminent. The price may continue to rise for some time, and eventually, the RSI could catch up and make a higher high in line with the price action. Essentially, the market could remain in an uptrend, and the RSI could still align with the price over time.
This highlights the importance of not jumping to conclusions solely based on RSI divergence. Divergence can act as a useful warning, but it should not be relied upon as a definitive signal of a trend reversal. To increase the reliability of the signal, traders should wait for additional confirmation, such as a candlestick pattern indicating a potential trend reversal. Candlestick patterns like engulfing patterns, doji candles, or shooting stars at key support or resistance levels can provide stronger evidence that the trend may be about to change.
Therefore, it’s wise to wait for a more comprehensive confirmation from price action before making a move, rather than acting on divergence alone. Combining RSI divergence with other technical tools, such as candlestick patterns or chart patterns, can help increase the accuracy of your trade decisions.
Conclusion:
Divergence is a powerful tool that provides valuable insights into potential trend reversals or continuations. By understanding the different types of divergence and knowing how to identify them, traders can make more informed decisions. However, divergence should always be used in conjunction with other technical analysis tools to enhance the accuracy of your strategy. With practice, patience, and proper risk management, divergence trading can become a profitable strategy for identifying key market turning points. Whether you are seeking trend reversals or confirming ongoing trends, RSI divergence can be an essential component of your trading toolkit.
Thanks for your support.
- Make sure to follow me so you don't miss out on the next analysis!
- Drop a like and leave a comment!
PL Dot Shapes (Detailed Summary)This idea shall focus on the behavior and structure of PL Dot Shapes, which are crucial in identifying market trends, congestion phases, and potential reversals. Let's deep dive on how to interpret PL Dot formations and recognize patterns that signal market movements.
1. Understanding PL Dot Behavior
- Trend:
PL Dots form a straight line, indicating a clear market direction. A trend stops when the market enters congestion.
- Congestion:
PL Dots move horizontally or “snake” sideways, signaling indecision or balance between buyers and sellers.
- Higher Time Period (HTP) Influence:
PL Dots from the HTP influence those in the Lower Time Period (LTP). Inconsistencies between them may indicate no clear pattern.
- Dot Distance:
Refers to the vertical price difference between consecutive PL Dots.
- Increasing Dot Distance: Indicates trend continuation or strength.
- Decreasing Dot Distance: Suggests trend exhaustion or potential reversal.
2. Key PL Dot Patterns
✅ Yes Pattern (Energy Termination Pattern)
Indicates the end of a trend and potential reversal. This pattern is characterized by signs of exhaustion:
1. PL Dot Pullback: PL Dot moves off the main trend channel, and the angle starts sloping down.
2. Decreasing Dot Distance: Dots get closer together, signaling waning momentum.
3. Exhaustion Signs: The dot pulls within range, with closes moving towards the PL Dot, causing congestion entrance.
4. Block Occurrence: Price likely returns to the area of 2-3 dots back.
5. Crest Formation: A PL Dot crest forms, indicating a potential market top.
6. Directional Shift: Dot directions begin turning downward.
7. Challenges: Be alert to price challenging PL Dot crests and valleys.
---
❌ No Pattern (Non-Termination Pattern)
Indicates that the trend is likely to continue without exhaustion:
1. Similar early behavior to the Yes Pattern but lacks signs of exhaustion.
2. No Significant Pullback: PL Dot may pull within range, but no congestion entrance signs appear (bullish).
3. Price Holds: Prices do not return to the 2-3 dots back area.
4. Weak Crests: No strong crest formation, or it's shallow.
5. Stable Direction: Dot direction struggles to turn down.
6. No Challenges: No challenges to PL Dot crests or valleys, confirming trend strength.
---
3. Trend Pattern (Trend Continuation Pattern)
Describes the start or continuation of a trend, especially in the LTP:
1. Dot Opening: PL Dot opens up, with increasing distance between dots, signaling strong momentum.
2. No Exhaustion: Continuation without signs of exhaustion.
3. Energy Refresh: If price reaches the area of 2-3 dots back, expect high energy on any PL Dot refresh.
4. Dots Out of Range: PL Dots move outside the prior bar’s range, confirming a strong trend.
5. Strong Challenges: Challenges to crests only add momentum to the trend.
6. Stable Direction: Dot direction maintains strength with minimal reversals.
---
4. PL Dot Shapes in Congestion
When the market is in congestion, expect the following:
1. Sideways Dots: PL Dots snake sideways, indicating market indecision.
2. Support/Resistance Holding: The 6-1 lines hold both sides of the congestion area.
3. Congestion Exit Signs: Look for signs indicating the market is ready to break out of congestion.
---
Key Takeaways:
- Trend Continuation: Increasing dot distance and out-of-range dots suggest a strong trend.
- Trend Exhaustion (Yes Pattern): Decreasing dot distance, dot pullbacks, and crest formation signal potential reversals.
- No Pattern: Indicates no exhaustion, suggesting the trend will continue.
- Congestion Behavior: PL Dots snake sideways with key support/resistance levels holding firm.
Understanding these patterns helps traders anticipate market behavior, identify trend reversals early, and manage trades effectively.

FXAN & Heikin Ashi TradeOANDA:AUDCHF
In this video, I’ll be sharing my analysis of AUDCHF, using FXAN's proprietary algo indicators with my unique Heikin Ashi strategy. I’ll walk you through the reasoning behind my trade setup and highlight key areas where I’m anticipating potential opportunities.
I’m always happy to receive any feedback.
Like, share and comment! ❤️
Thank you for watching my videos! 🙏

Roto PumpStage Analysis is a technical analysis method developed by Stan Weinstein, which categorizes a stock's lifecycle into four distinct phases

stage analysis of KEIStage Analysis is a technical analysis method developed by Stan Weinstein, which categorizes a stock's lifecycle into four distinct phases

Triangle Chart Patterns: How to Identify and Trade ThemTriangle Chart Patterns: How to Identify and Trade Them
Triangle chart patterns are essential tools in technical analysis, helping traders identify potential trend continuations. These formations build as the price consolidates between converging trendlines, signalling an upcoming move in the market. In this article, we’ll explore the three types of triangle patterns—symmetrical, ascending, and descending—and how traders use them to analyse price movements.
What Are Triangle Chart Patterns?
Triangle chart patterns are a common tool used to understand price movements in the market. These patterns form when the price of an asset moves within two converging trendlines, creating a triangle shape on a chart. The lines represent support and resistance levels, and as they get closer together, it signals a potential breakout in one direction.
Symmetrical, ascending, and descending are three types of triangle patterns. Each of these patterns reflects a different market sentiment, with symmetrical triangles showing indecision, ascending triangles suggesting a bullish bias, and descending triangles hinting at bearish momentum. These formations are useful because they help traders spot potential breakouts, where the price might move sharply up or down after a period of consolidation.
It’s important to note that triangles and wedge patterns are similar but not the same. Both patterns involve converging trendlines, but wedges tend to slope upward or downward. Triangles, on the other hand, either feature one horizontal trendline and a sloping trendline or two sloping trendlines at roughly the same angle.
Below, we’ll cover the three triangle types. If you’d like to follow along, head over to FXOpen and TradingView to get started with real-time charts.
Symmetrical Triangle
The symmetrical triangle is a popular chart pattern that shows up when the price of an asset starts consolidating within a tighter range. Unlike other triangle patterns, it doesn’t lean heavily in either direction—bullish or bearish—making it a neutral signal. It forms when buyers and sellers are in a bit of a standoff, with no clear trend in sight. However, this period of indecision often leads to a significant move once the price breaks out of the pattern.
What Does It Look Like?
- Two converging trendlines;
- One sloping down from the highs (resistance);
- One sloping up from the lows (support);
- The price oscillates between these two lines, forming lower highs and higher lows;
- The formation narrows as the lines get closer together, creating a point of breakout.
What Does It Indicate?
A symmetrical triangle pattern indicates a period of indecision in the market. Buyers and sellers are evenly matched, causing the price to move within a narrowing range. As it gets smaller, the pressure builds, and the price is likely to break out either up or down. Since the formation is neutral, the breakout could occur in either direction, and traders wait for this moment to see where the market is heading.
How Do Traders Use It?
Traders typically watch for a breakout from the symmetrical triangle to signal the next significant price movement. They often look for an increase in trading volume alongside the breakout, as this can confirm the strength of the move. In most cases, it’s used as a signal for potential price continuation. However, some traders see it as a reversal indicator, depending on what the preceding trend looks like.
Ascending Triangle
An ascending triangle is a bullish triangle pattern that’s often looked for when analysing potential price breakouts. It usually forms during an uptrend but may also appear in a downtrend. It suggests that buyers are becoming more aggressive, while sellers are struggling to push the price lower, creating a situation where the market might break upwards.
What Does It Look Like?
- A horizontal resistance line at the top (price struggles to break above this level);
A rising trendline at the bottom, connecting higher lows (buyers are stepping in earlier each time);
- The price moves between these two lines, creating a triangle shape;
- The formation narrows over time, putting pressure on the resistance level.
What Does It Indicate?
An ascending triangle pattern signals that buyers are gaining control. While the price keeps hitting a ceiling (resistance), the higher lows show that the market’s buying pressure is increasing. This often leads to a breakout above the resistance level, where the price can make a significant upward move. Traders usually see this formation as a sign that the market is primed for a continuation of the current uptrend. However, sometimes it can appear in a downtrend and signal a trend reversal.
How Do Traders Use It?
Traders typically use the ascending triangle to spot potential breakouts above the resistance level. When the price finally moves and closes above this line, it’s seen as confirmation that the upward trend is continuing. Many also pay close attention to the trading volume during this breakout—rising volume can confirm that the breakout is genuine.
In some cases, the price may break through the resistance quickly, while in others, it could take time before the upward move happens. There may also be false breakouts before the true bullish move occurs, with the price typically closing below resistance.
Descending Triangle
A descending triangle is a bearish chart pattern that signals potential downward movement in the market. It typically forms during a downtrend but can also appear in an uptrend. It shows that sellers are becoming more dominant, while buyers are struggling to push the price higher, which could lead to a breakdown below a key support level.
What Does It Look Like?
- A horizontal support line at the bottom (price struggles to break below this level);
- A descending trendline at the top, connecting lower highs (sellers are pushing the price down);
- The price moves between these two lines, creating a triangle shape;
- The formation narrows over time, with the pressure building on the support level.
What Does It Indicate?
A descending triangle chart pattern suggests that sellers are in control. While the price holds at the support level, the series of lower highs shows that selling pressure is increasing. This often leads to a breakdown below the support line, where the price might experience a sharp decline. Traders see the formation as a bearish signal, indicating that the market could continue its downward trend.
How Do Traders Use It?
Traders typically use the descending triangle to identify potential breakdowns below the support level. When the price falls and closes below this line, it’s considered confirmation that the sellers have taken over and that further downside movement could follow.
Similar to other triangle patterns, it’s common to watch for a rise in trading volume during the breakdown, as it can confirm the strength of the move. It’s also possible to see false breakouts below the support level when the price closes back inside the pattern almost immediately.
How Traders Use Triangle Patterns in Technical Analysis
These patterns are just one piece of the puzzle in technical analysis, but they can offer us valuable insights when used correctly.
Triangle Pattern Trading: Entry, Stop-Loss, and Profit Targets
Entry Points
Traders typically wait for a confirmed breakout from the triangle formation’s boundaries before entering a trade. For ascending triangles, this means watching for the price to break above the upper trendline (resistance), while for descending triangles, they look for a breakdown below the lower trendline (support). In a symmetrical triangle, the breakout may be in either direction, usually informed by the broader market trend.
The entry is often confirmed by a closing candle above or below these key levels to reduce the risk of false breakouts.
Stop-Loss Placement
Stop-loss orders are crucial here. For ascending triangles, stop losses might be placed just below the last swing low, while for descending triangles, they might be set just above the recent swing high. In the case of symmetrical triangles, traders often place the stop-loss just outside the formation’s apex.
Profit Targets
To set profit targets, traders typically use the triangle's height (the distance between the highest and lowest points). This height is then projected from the breakout point, offering a realistic target for the trade. For example, if a triangle stock pattern’s height is $10 and the breakout occurs at $50, the target would be $60 for a bullish move.
Combining with Market Context
Triangles may become more reliable when considered in the context of the broader market environment. Traders don’t just look at the pattern in isolation—they analyse the prevailing trend, market sentiment, and even macroeconomic factors to gauge whether a breakout aligns with the larger market movement. For instance, an ascending formation in a strong uptrend adds confidence to the idea of a bullish breakout.
Using Other Indicators for Confirmation
While triangles provide a useful framework, they’re usually combined with other technical indicators for confirmation. Traders often align triangles with volumes, moving averages, or momentum indicators to assess whether the breakout has strong support behind it. For instance, a breakout confirmed by high volume or a moving average crossover might add confluence to the trade.
Limitations and Considerations of Triangle Patterns
Triangles are useful tools in technical analysis, but they come with limitations and important considerations. While they can signal potential breakouts, it’s essential to approach them cautiously.
- False Breakouts: Triangles often experience false breakouts, where the price briefly moves beyond the trendline but quickly reverses. This may trap traders in unfavourable positions.
- Subjectivity: These formations are open to interpretation. Different people may draw trendlines slightly differently, leading to varying conclusions about where the breakout occurs.
- Need for Confirmation: Relying solely on patterns can be risky. They may work better when combined with other indicators, such as volume or moving averages, to confirm the trend direction.
- Market Conditions: In volatile or news-driven markets, chart patterns may not behave as expected, reducing their reliability. They may provide false signals or lose significance in these situations.
The Bottom Line
Triangle chart patterns are popular tools among those looking to analyse market movements and potential breakouts. Whether it’s a symmetrical, ascending, or descending triangle, these patterns provide valuable insights into price consolidation and future trends. While no pattern guarantees a winning trade, combining triangles with other indicators may improve market analysis.
Ready to apply your knowledge? Open an FXOpen account to explore chart patterns in more than 700 live markets and take advantage of our low-cost, high-speed trading environment backed by advanced trading platforms.
FAQ
What Is a Triangle Chart Pattern?
A triangle chart is a pattern in technical analysis that forms when the price of an asset moves between converging trendlines, creating a triangle shape on a price chart. They typically signal a period of consolidation before a strong potential breakout in price.
What Are the Patterns of Triangles?
There are three main types of triangles in chart patterns: symmetrical, ascending, and descending. Symmetrical triangles indicate indecision in the market while ascending triangles are often bullish, and descending triangles tend to be bearish.
How to Trade a Triangle?
Traders typically wait for a confirmed breakout from the triangle’s trendlines. According to theory, entry points are based on a breakout above resistance or below support, with stop-loss orders placed just outside the triangle. Profit targets are often set based on the height (the distance between the highest and lowest points) of the pattern.
What Is the Triangle Pattern Strategy?
The triangle pattern strategy involves waiting for a breakout and using the formation’s height to set profit targets. It’s combined with tools like volume, moving averages, and momentum indicators to confirm the move and avoid false breakouts.
Is the Triangle Pattern Bullish or Bearish?
They can be both bullish and bearish. Ascending triangles are generally seen before a bullish movement, descending triangles are bearish, and symmetrical triangles can be either.
This article represents the opinion of the Companies operating under the FXOpen brand only. It is not to be construed as an offer, solicitation, or recommendation with respect to products and services provided by the Companies operating under the FXOpen brand, nor is it to be considered financial advice.

EDUCATION: The $5 Drop: How Trump’s Tariffs Sent Oil TumblingOil markets don’t move in a vacuum. Politics, trade wars, and global economic shifts all play a role in price action. Case in point: the recent $5 drop in oil prices following Trump’s latest tariff announcement.
What Happened?
Markets reacted swiftly to Trump’s renewed push for tariffs, targeting key trading partners. The result? A ripple effect that sent oil prices tumbling as traders anticipated lower global demand. The logic is simple—higher tariffs slow trade, slowing trade weakens economies, and weaker economies use less oil.
Why It Matters to Traders
For traders, this kind of volatility is both an opportunity and a risk. Sharp price drops like this shake out weak hands while rewarding those who position themselves with clear strategies. If you trade crude oil, understanding the macro picture—beyond just supply and demand—can make or break your positions.
The Next Move
Is this just a knee-jerk reaction, or the start of a larger trend? Smart traders are watching key levels, tracking institutional order flow, and looking for confirmation before making their next move.
How do you react when headlines move the market? Do you panic, or do you position yourself with a plan? Drop a comment and let’s talk strategy.

Trump's Tariff Wars : What To Expect And How To Trade Them.I promised all of you I would create a Trump's Tariff Wars video and try to relate that is happening through the global economy into a rational explanation of HOW and WHY you need to be keenly away of the opportunities presented by the new Trump administration.
Like Trump or not. I don't care.
He is going to try to enact policies and efforts to move in a direction to support the US consumer, worker, business, and economy.
He made that very clear while campaigning and while running for office (again).
This video looks at the "free and fair" global tariffs imposed on US manufacturers and exports by global nations over the past 3+ decades.
For more than 30+ years, global nations have imposed extreme tariffs on US goods/exports in order to try to protect and grow their economies. The purpose of these tariffs on US good was to protect THEIR workers/population, to protect THEIR business/economy, to protect THEIR manufacturing/products.
Yes, the tariffs they imposed on US goods was directly responsible for THEIR economic growth over the past 30-50+ years and helped them build new manufacturing, distribution, consumer engagement, banking, wealth, and more.
The entire purpose of their tariffs on US goods was to create an unfair advantage for their population to BUILD, MANUFACTURE, and BUY locally made products - avoiding US products as much as possible.
As I suggested, that is why Apple, and many other US manufacturers moved to Asia and overseas. They could not compete in the US with China charging 67% tariffs on US goods. So they had to move to China to manufacture products because importing Chinese-made products into the US was cheaper than importing US-made products into China.
Get it?
The current foreign Tariffs create an incredibly unfair global marketplace/economy - and that has to STOP (or at least be re-negotiated so it is more fair for everyone).
And I believe THAT is why Trump is raising tariffs on foreign nations.
Ultimately, this will likely be resolved as I suggest in this video (unless many foreign nations continue to raise tariff levels trying to combat US tariffs).
If other foreign nation simply say, "I won't stand for this, I'm raising my tariff levels to combat the new US tariffs", then we end up where we started - a grossly unfair global marketplace.
This is the 21st century, not the 18th century.
Step up to the table and realize we are not in the 1850s or 1950s any longer.
We are in 2025. Many global economies are competing at levels nearly equal to the US economy in terms of population, GDP, manufacturing, and more.
It's time to create a FREE and FAIR global economy, not some tariff-driven false economy on the backs of the US consumers. That has to end.
Get some.
#trading #research #investing #tradingalgos #tradingsignals #cycles #fibonacci #elliotwave #modelingsystems #stocks #bitcoin #btcusd #cryptos #spy #gold #nq #investing #trading #spytrading #spymarket #tradingmarket #stockmarket #silver

$100, $1,000, $100,000 — When Numbers Become Turning PointsHey! Have you ever wondered why 100 feels... special? 🤔
Round numbers are like hidden magnets in the market. 100. 500. 1,000. They feel complete. They stand out. They grab our attention and make us pause. In financial markets, these are the levels where price often slows down, stalls, or makes a surprising turn.
I’ll admit, once I confused the market with real life. I hoped a round number would cause a reversal in any situation. Like when I stepped on the scale and saw a clean 100 staring back at me, a level often known as strong resistance. I waited for a bounce, a sudden reversal... but nothing. The market reacts. My body? Not so much. 🤷♂️
The market reacts. But why? What makes these numbers so powerful? The answer lies in our minds, in market dynamics, and in our human tendency to crave simplicity.
-------------------------------------
Psychology: Why our brain loves round numbers
The human mind is designed to create structure. Round numbers are like lighthouses in the chaos — simple, memorable, and logical. If someone asks how much your sofa cost, you’re more likely to say "a grand" than "963.40 dollars." That’s normal. It’s your brain seeking clarity with minimal effort.
In financial markets, round numbers become key reference points. Traders, investors, even algorithms gravitate toward them. If enough people believe 100 is important, they start acting around that level — buying, selling, waiting. That belief becomes reality, whether it's rational or not. We anchor decisions to familiar numbers because they feel safe, clean, and "right."
Walmart (WMT) and the $100 mark
Round numbers also carry emotional weight. 100 feels like a milestone, a finish line. It’s not just a number, it’s both an ending and a beginning.
-------------------------------------
Round numbers in the market: Resistance and support
Round number as a resistance
Imagine a stock climbing steadily: 85, 92, 98... and then it hits 100. Suddenly, it stalls. Why? Investors who bought earlier see 100 as a "perfect" profit point. "A hundred bucks. Time to sell." Many pre-set sell orders are already waiting. Most people don’t place orders at $96.73. They aim for 100. A strong and symbolic.
At the same time, speculators and short sellers may step in, viewing 100 as too high. This creates pressure, slowing the rally or pushing the price back down.
If a stock begins its journey at, say, $35, the next key round levels for me are: 50, 100, 150, 200, 500, 1,000, 2,000, 5,000, 10,000…
Slide from my training materials
These levels have proven themselves again and again — often causing sideways movement or corrections. When I recently reviewed the entire S&P 500 list, for example $200 showed up consistently as a resistance point.
It’s pure psychology. Round numbers feel "high" — and it's often the perfect moment to lock in profits and reallocate capital. Bitcoin at $100,000. Netflix at $1,000. Tesla at $500. Walmart at $100. Palantir at $100. These are just a few recent examples.
Round number support: A lifeline for buyers
The same logic works in reverse. When price falls through 130, 115, 105... and lands near 100, buyers often step in. "100 looks like a good entry," they say. It feels like solid ground after a drop. We love comeback stories. Phoenix moments. Underdogs rising. Buy orders stack up and the price drop pauses.
Some examples:
Meta Platforms (META)
Amazon.com (AMZN) — $100 acted as resistance for years, then became support after a breakout
Tesla (TSLA)
-------------------------------------
Why round numbers work for both buyers and sellers
Buyers and the illusion of a bargain
If a stock falls from 137 to 110 and approaches 100, buyers feel like it’s hit bottom. Psychologically, 100 feels cheap and safe. Even if the company’s fundamentals haven’t changed, 100 just "feels right." It’s like seeing a price tag of $9.99 — our brain rounds it down and feels like we got an epic deal.
Sellers and the "perfect" exit
When a stock rises from 180 to 195 and nears 200, many sellers place orders right at 200. "That’s a nice round number, I’ll exit there." There’s emotional satisfaction. The gain feels cleaner, more meaningful, when it ends on a round note.
To be fair, I always suggest not waiting for an exact level like 200. If your stock moved through 145 > 165 > 185, don’t expect perfection. Leave room. A $190 target zone makes more sense. Often, greed kills profit before it can be realized. Don’t squeeze the lemon dry.
Example: My Tesla analysis on TradingView with a $500 target — TESLA: Money On Your Screen 2.0 | Lock in Fully…
Before & After: As you see there, the zone is important, not the exact number.
-------------------------------------
Round numbers in breakout trades
When price reaches a round number, the market often enters a kind of standoff. Buyers and sellers hesitate. The price moves sideways, say between 90 and 110. Psychologically, it’s a zone of indecision. The number is too important to ignore, but the direction isn’t clear until news or momentum pushes it.
When the direction is up and the market breaks above a key level, round numbers work brilliantly for breakout trades or strength-based entries.
Slide from my training materials
People are willing to pay more once they see the price break through a familiar barrier. FOMO kicks in. Those who sold earlier feel regret and jump back in. And just like that, momentum builds again — until the next round-number milestone.
Berkshire Hathaway (BRK.B) — every round number so far has caused mild corrections or sideways action. I’d think $500 won’t be any different.
-------------------------------------
Conclusion: Simplicity rules the market
Round numbers aren’t magic. They work because we, the people, make the market. We love simplicity, patterns, and emotional anchors. These price levels are where the market breathes, pauses, thinks, and decides. When you learn to recognize them, you gain an edge — not because the numbers do something, but because crowds do.
A round number alone is never a reason to act.
If a stock drops to 100, it doesn’t mean it’s time to buy. No single number works in isolation. You need a strategy — a set of supporting criteria that together increase the odds. Round numbers are powerful psychological levels, but the real advantage appears when they align with structure and signals.
Keep round numbers on your radar. They’re the market’s psychological mirror, and just like us, the market loves beautiful numbers.
If this article made you see price behavior differently, or gave you something to think about, feel free to share it.
🙌 So, that's it! A brief overview and hopefully, you found this informative. If this article made you see price behavior differently, or gave you something to think about, feel free to share it & leave a comment with your thoughts!
Before you leave - Like & Boost if you find this useful! 🚀
Trade smart,
Vaido

Understanding MACD In TradingThe Moving Average Convergence Divergence (MACD) is a trend-following momentum indicator that measures the relationship between two moving averages of an asset’s price. Developed by Gerald Appel in the late 1970s, MACD is designed to provide insights into both trend strength and momentum.
Unlike simple moving averages, which merely smooth price data over a specific period, MACD goes a step further by identifying when short-term momentum is shifting in relation to the long-term trend. This makes it a valuable tool for traders looking to enter or exit positions at optimal points.
1. Why is MACD important in trading?
Trend Confirmation: Identifies whether an asset is in an uptrend or downtrend.
Momentum Strength: Measures how strong a price movement is.
Reversal Signals: Detects potential changes in trend direction.
Entry and Exit Points: Helps traders determine when to buy and sell.
2. MACD Components
The MACD Line: Identifies whether an asset is in an uptrend or downtrend.
This line is derived by subtracting the 26-period Exponential Moving Average (EMA) from the 12-period EMA.
When the MACD Line is positive, it indicates bullish momentum; when negative, it suggests bearish momentum.
The Signal Line: Measures how strong a price movement is.
A 9-period EMA of the MACD Line.
It smooths out MACD fluctuations, making it easier to identify crossovers.
The Histogram: Detects potential changes in trend direction.
The difference between the MACD Line and the Signal Line.
A positive histogram suggests increasing bullish momentum, while a negative histogram suggests growing bearish momentum.
3. MACD Formula
The Moving Average Convergence Divergence (MACD) is one of the most widely used technical indicators in trading. It helps traders identify trends, momentum shifts, and potential buy or sell opportunities by analyzing the relationship between two moving averages.
By calculating the difference between a short-term and long-term exponential moving average (EMA), MACD provides insight into market direction and strength.
//@version=6
indicator("MACD Indicator", overlay=false)
// MACD parameters
shortLength = 12
longLength = 26
signalLength = 9
// Calculate MACD
macdLine = ta.ema(close, shortLength) - ta.ema(close, longLength)
signalLine = ta.ema(macdLine, signalLength)
histogram = macdLine - signalLine
// Plot MACD components
plot(macdLine, color=color.blue, title="MACD Line")
plot(signalLine, color=color.red, title="Signal Line")
plot(histogram, color=color.green, style=plot.style_columns, title="Histogram")
Explanation:
Short EMA (12-period) and Long EMA (26-period) are calculated.
The MACD Line is the difference between these EMAs.
A Signal Line (9-period EMA of MACD Line) is calculated.
The Histogram represents the difference between the MACD Line and the Signal Line.
4. Interpreting MACD signals
MACD Crossovers
A crossover occurs when the MACD Line and Signal Line intersect:
Bullish Crossover: When the MACD Line crosses above the Signal Line, it signals a potential uptrend and a buying opportunity.
Bearish Crossover: When the MACD Line crosses below the Signal Line, it suggests a potential downtrend and a selling opportunity.
MACD Divergences
Divergences occur when MACD moves in the opposite direction of the price, signaling a potential reversal:
Bullish Divergence: If price makes lower lows, but MACD makes higher lows, it suggests weakening downward momentum and a possible bullish reversal.
Bearish Divergence: If price makes higher highs, but MACD makes lower highs, it signals weakening upward momentum and a potential bearish reversal.
Histogram Interpretation
The MACD histogram visually represents momentum shifts:
When bars are increasing in height, momentum is strengthening.
When bars shrink, it suggests momentum is weakening.
Zero Line Crossings
The MACD crossing the zero line indicates momentum shifts:
MACD crossing above zero → Bullish trend initiation.
MACD crossing below zero → Bearish trend initiation.
5. Trend & Momentum Analysis
Traders use MACD to confirm trends and analyze market momentum:
If MACD Line is above the Signal Line, an uptrend is in place.
If MACD Line is below the Signal Line, a downtrend is dominant.
A widening histogram confirms strong momentum in the trend’s direction.
A narrowing histogram warns of potential trend weakening.
MACD works best in trending markets and should be used cautiously in sideways markets.
6. MACD Based Trading Strategies
Entry Strategies
Buy when MACD Line crosses above the Signal Line in an uptrend.
Sell when MACD Line crosses below the Signal Line in a downtrend.
Exit Strategies
Exit long trades when a bearish crossover occurs.
Close short positions when a bullish crossover occurs.
Position Management
If the histogram is expanding, traders can hold positions.
If the histogram is contracting, it may signal weakening momentum.
7. Limitations of MACD
While MACD is a powerful tool, traders must consider:
It lags behind price movements (since it is based on moving averages).
It can generate false signals in choppy markets.
Customization is required to suit different trading styles.
8. Optimization
Optimizing MACD for Different Market Conditions
Day Traders & Scalpers: Use faster settings like (5, 13, 6) for quick signals.
Swing Traders: Stick with the default (12, 26, 9) setting for balanced signals.
Long-Term Investors: Use slower settings like (24, 52, 18) for a broader market perspective.
9. Key Takeaways
MACD is a momentum and trend-following indicator that helps traders identify market direction, strength, and potential reversals.
Since MACD is a lagging indicator, it may generate false signals, especially in sideways markets.
Combining MACD with RSI, moving averages, and volume indicators improves accuracy and reduces risk.
MACD should be used alongside risk management strategies and other confirmation tools for best results.
MACD remains one of the most effective technical indicators, widely used across different markets. It helps traders identify trends, confirm momentum, and optimize trade entries and exits. However, it should always be used with additional tools to minimize false signals.
Stay sharp, stay ahead, and let’s make those moves. Until next time, happy trading!

The Power of a Trading System with the Right Mental State
📅 April 3, 2025
Over the years, I’ve learned that discipline in trading isn’t just about having a system — it’s about being in the right state of mind to follow that system. 🧘♂️📈
You can have the cleanest rules, the best strategy, and solid backtests … but if your mindset is off, none of it matters. That’s when hesitation creeps in. Or worse — revenge trades, FOMO, or doubt.
So I started focusing on one thing: my internal state before and during a trade. 🧭
🔄 How I Manage My Mindset
✅ 1. Pre-Trade Check-In
Before I trade, I ask:
How do I feel right now?
If I’m not grounded, I don’t trade. Simple. I’ve learned the hard way that it’s not worth it.
🔥 2. Anchoring a Disciplined State
I recall moments where I executed perfectly — calm, focused, in control. I mentally step into that version of myself before every session.
🧩 3. Staying Congruent
During a trade, I pay attention to my behavior. If I notice myself drifting from my plan — I pause, breathe, and realign.
🎯 Why This Works
A trading system gives structure.
But structure means nothing without mental discipline.
By mastering my emotional state, I stopped sabotaging my own edge.
No more reacting from fear. No more chasing. Just clean, committed execution. 🧘♂️✅
💬 Final Thought
Consistency doesn’t come from the market — it comes from me.
So now, before I look at the chart, I check in with myself first.
Because when my state is right, my trading flows. ⚖️✨
If this resonates, drop your thoughts below — let’s grow together.

What Is an ABCD Pattern, and How Can You Use It in Trading?What Is an ABCD Pattern, and How Can You Use It in Trading?
Are you looking to improve your trading strategy and technical analysis skills? The ABCD trading pattern may be just what you need. This tool may help you identify potential market reversals and decide when to enter a trade. Keep reading to learn more about the ABCD pattern and how to apply it to your trading strategy.
What Is an ABCD Pattern?
The ABCD pattern is one of the basic harmonic patterns. It gives traders an idea of where the market might reverse. Therefore, when combined with other forms of technical analysis, it may be a great addition to your trading arsenal.
The ABCD pattern comprises two legs, AB and CD, and one retracement, BC, with D as an entry point. More specifically, an ABCD can be identified by:
- AB Leg: A trend starts at A and makes a high or low at B.
- BC Retracement: The price retraces from B to C.
- CD Leg: The trend continues from C to D.
- D Entry Point: Once another high or low forms and traders enter at D.
These price movements create the “zig-zag” or “lightning bolt” shapes.
In fact, ABCD patterns are present across every market and every timeframe. The up-down movements in financial assets represent opportunities to identify and trade ABCD patterns.
Why Use the ABCD Pattern in Your Trading Strategy?
Before we move on to identifying and trading the ABCD pattern, it’s worth explaining why you might want to consider using it. Here are a few reasons traders favour the ABCD pattern:
- It’s one of the harmonic patterns suitable for traders of all experience levels.
- It’s versatile and works for stocks, commodities, and cryptocurrencies*, not just forex trading.
- Traders use ABCD patterns to make informed decisions about potential turning points in the market.
- It can form the basis of a working trading strategy if used correctly alongside other forms of technical analysis.
- It provides quite an effective risk/reward ratio if reversals are caught.
How Traders Identify an ABCD Trading Pattern
The first step in finding ABCDs is to look for that classic zig-zag shape. Once you’ve found one, it’s time to apply Fibonacci ratios to confirm the pattern. If you’re struggling, you can consider using pre-made ABCD pattern indicators or scanners to help your eyes get used to spotting them.
The ABCD pattern requires that the BC leg is between a 38.2% to 78.6% retracement of AB, ideally between 61.8% and 78.6%. This means that if you put a Fibonacci retracement tool at A and B, C should be between 0.382 and 0.786.
The second CD leg should be a 127.2% to 161.8% extension of the BC retracement. For extra confirmation, consider specifying that AB is equal to the same length as CD.
While it can be tempting to start trading based on these conditions, you’ll find that, in practice, identifying point D can be trickier than it seems. That’s why traders typically use Fibonacci ratios, key levels, candlestick patterns, and higher timeframe convergence to confirm their entries, which we will touch on shortly.
ABCD Pattern Examples
Now that we understand how to identify the ABCD pattern, we can start applying it to real price action.
Note that the ratios won’t always be perfect, so allowing for slight variability above or below the defined ratios is acceptable.
Bullish ABCD Pattern
For a bullish formation, the following must be present:
- The AB leg should be between the high A and low B.
- The BC bullish retracement should be between the low B and high C, which is below the high A.
- The CD leg should be between the high C and low D.
- BC is a 38.2% to 78.6% retracement of AB, preferably between 61.8% and 78.6%.
- CD is a 127.2% to 161.8% extension of BC.
Additionally, you may look for AB to be an identical or similar length to CD.
Entry: Traders set a buy order at D.
Stop Loss: The theory suggests traders place a stop below a nearby support level or use a set number of pips.
Take profit: Traders place take-profit orders at the 38.2%, 50%, or 61.8% retracement of CD or hold for higher prices if they believe there’s the potential for further bullishness.
Bearish ABCD Pattern
The bearish ABCD chart pattern is essentially the same, just with the reversed highs and lows. As such:
- The AB leg should be between the low A and high B.
- The BC bullish retracement should be between the high B and low C.
- The CD leg should be between the low C and high D.
- BC is a 38.2% to 78.6% retracement of AB, preferably between 61.8% and 78.6%.
- CD is a 127.2% to 161.8% extension of BC.
You can choose to apply the same AB = CD rules in a bearish ABCD pattern if desired.
Entry: Traders typically place a sell order at D.
Stop Loss: A stop may be placed above a nearby resistance level or at a set number of pips.
Take profit: Traders often take profits at the 38.2%, 50%, or 61.8% retracement of CD or hold for lower prices if there’s a bearish trend on a higher timeframe.
ABCD Pattern Strategy
A momentum-based ABCD trading strategy can help traders confirm potential reversals by incorporating indicators like the RSI (Relative Strength Index). This approach often adds an extra layer of confluence.
Entry
- Traders may wait for point D to form and for the RSI to indicate overbought or oversold conditions, typically above 80 or below 20.
- Additional confirmation can be sought if there is a divergence between price and RSI, signalling weakening momentum.
- Once the RSI crosses back into normal territory, it can suggest a reversal, providing an opportunity to enter the market.
Stop Loss
- A stop loss is often placed slightly above or below point D, depending on whether the formation is bearish or bullish, respectively. This helps potentially manage risk in case the reversal doesn’t hold.
Take Profit
- Traders can consider taking profits at Fibonacci retracement levels of leg CD, such as 38.2%, 50%, or 61.8%.
- Another common target is point C, but traders may also hold the position for longer if further price movement is anticipated.
Looking for Additional Confluence
Given that trading the ABCDs usually relies on setting orders at specific reversal points, consider looking for extra confirmation to filter potential losing trades. Below, you’ll find three factors of confluence you can use to confirm your entries.
Key Levels
If your analysis shows that D is projected to be in an area of significant support or resistance, there’s a greater chance that the level will hold and the price will reverse in the way you expect.
ABCD Timeframe Convergence
One technique to potentially enhance the reliability of ABCD chart patterns is to check for multiple timeframes. When you identify the formation on a lower timeframe—say, the 5-minute chart—you can then look to a higher timeframe chart, such as the 30-minute or 1-hour chart to see the overall trend.
If the pattern converges with the longer-term trend, it strengthens the analysis and increases the likelihood of an effective trade.
Candlestick Patterns
Some traders look for particular candlestick patterns to appear. The hammer and shooting star patterns are commonly used by ABCD traders for extra confirmation, as are tweezer tops/bottoms and engulfing candles. You could choose to wait for one of these candlesticks to form before entering with a market order.
Common Mistakes to Avoid When Identifying an ABCD Chart Pattern
Of course, ABCD patterns aren’t a silver bullet when it comes to effective trading. There are several common mistakes made by inexperienced traders when trading these types of patterns, such as:
- Confusing the ABCD with other harmonic patterns, like the Gartley or three-drive pattern.
- Trading every potential ABCD formation they see. It’s preferable to be selective with entries and look for confirmation.
- Not being patient. ABCDs on higher timeframes can take days, even weeks, to play out.
Experienced traders wait for the pattern to develop before making a trading decision.
- Ignoring key levels. Instead, you could allow them to guide your trades and look for the ABCD pattern in these areas.
The Bottom Line
The ABCD pattern is a versatile tool that can enhance a trader’s ability to identify potential market reversals and refine their overall strategy. When combined with other forms of technical analysis, such as momentum indicators, an ABCD trading strategy can be an invaluable addition to your trading arsenal.
For traders looking to apply the ABCD pattern in forex, stock, commodity, and crypto* markets, consider opening an FXOpen account and take advantage of low-cost, high-speed trading across more than 600 assets. Good luck!
FAQ
What Is an ABCD Trading Pattern?
The ABCD trading pattern is a simple harmonic pattern used by traders to identify potential market reversals. It consists of three price movements: the AB leg, BC retracement, and CD leg, with point D marking a potential entry for a reversal trade. It helps identify changes in trend direction.
How Can You Use the ABCD Pattern in Trading?
Traders identify the ABCD pattern by finding the characteristic zig-zag shape and using Fibonacci ratios to confirm it. Entry points are typically placed at point D, with stop losses and profit targets based on the formation’s structure. Confluence with other technical analysis tools improves its reliability.
Is the ABCD Pattern Bearish or Bullish?
The ABCD pattern can be either bearish or bullish. A bullish ABCD indicates a potential upward reversal, while a bearish ABCD suggests a downward reversal. The structure remains the same, but the highs and lows are reversed.
What Is the ABCD Strategy?
The ABCD strategy revolves around identifying trend reversals using the formation and confirming entry points through tools like Fibonacci retracements or momentum indicators like the RSI for added accuracy.
*At FXOpen UK, Cryptocurrency CFDs are only available for trading by those clients categorised as Professional clients under FCA Rules. They are not available for trading by Retail clients.
This article represents the opinion of the Companies operating under the FXOpen brand only. It is not to be construed as an offer, solicitation, or recommendation with respect to products and services provided by the Companies operating under the FXOpen brand, nor is it to be considered financial advice.

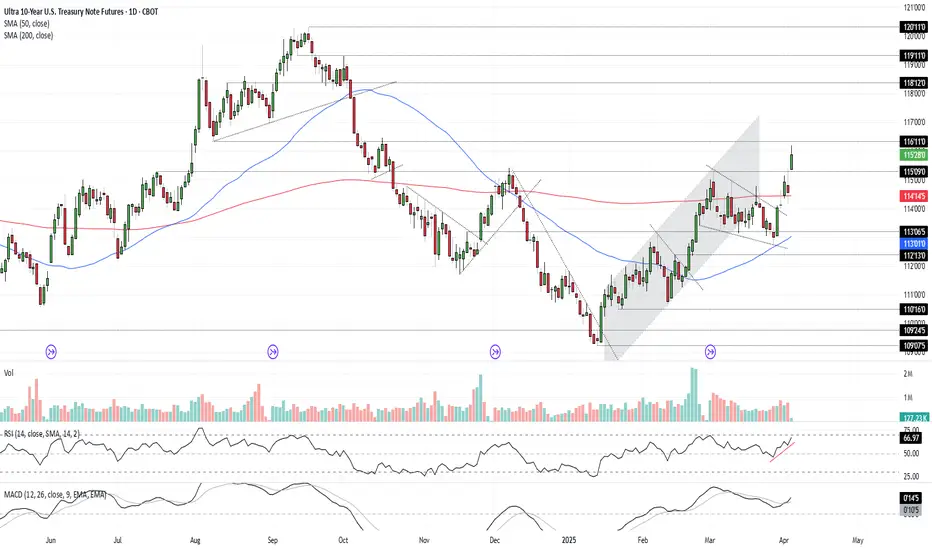
Bonds Don’t Lie: The Signal is ClearU.S. 10-year Treasuries are a crucial cog in the global financial machine, serving as a benchmark borrowing rate, a tool for asset valuation, and a gauge of the longer-term outlook for U.S. economic growth and inflation.
As such, I keep a close eye on 10-year note futures, as they can offer clues on directional risks for bond prices and yields. The price action over the past few days has sent a clear and obvious signal as to where the risks lie: prices higher, yields lower.
Futures had been grinding lower within a falling wedge for several weeks but broke higher last Friday on decent volumes following soft U.S. household spending data. It has since extended bullish the move, reclaiming the 200-day moving average before surging above key resistance at 115’09’0 after Trump’s reciprocal tariff announcement on Wednesday.
RSI (14) is trending higher but isn’t yet overbought, while MACD has crossed the signal line above 0, confirming the bullish momentum signal. That favours further upside, putting resistance at 116’11’0 and 118’12’0 on the immediate radar. For those who prefer it expressed in yield terms, that’s around 4% and 3.8% respectively.
Good luck!
DS
Calibrating Trading Indicators for Different MarketsCalibrating Trading Indicators for Different Markets: A Beginner's Guide
(Simple Steps to Adjust RSI , MACD , and Other Tools for Better Results)
Key Idea : Just like you'd tune a guitar differently for rock vs. classical music, trading tools like RSI or MACD need adjustments depending on what you're trading (stocks, crypto, forex) and how it moves. This guide shows you how to tweak these tools using price swings (pivot points) to make them work better for your specific asset.
---
Why "One Size Fits All" Doesn't Work
Most traders use default settings for indicators (like RSI's 14-day period). But these defaults were created for "average " markets. Real markets aren't average!
Example:
- Crypto ( CME:BTC1! ) : Super volatile → Needs faster, more sensitive indicators.
- Blue-Chip Stocks ( NASDAQ:AAPL ) : Less wild swings → Needs slower, smoother indicators.
If you use the same RSI settings for both, you'll get bad signals. Calibration fixes this.
---
The Pivot Point Method for Calibration
One effective approach to calibration is measuring the natural rhythm of price swings between high and low points. Here's how to do it step by step:
Step 1: Find Pivot Points on Your Chart
Pivot points are like "price turning points." Use TradingView's ZigZag indicator (or draw them manually) to spot these swings.
How to Add ZigZag on TradingView :
1. Open your chart.
2. Click "Indicators" → Search " ZigZag " → Select it.
3. Adjust settings (defaults work fine for starters).
The ZigZag will draw lines between significant highs (peaks) and lows (valleys).
---
Step 2: Measure the "Rhythm" of the Market
Count the bars (candles) between pivot points to find the market's natural cycle.
Example :
- If Bitcoin swings from peak to peak every 14 bars on average, its "cycle" is 14 bars.
- If Apple does this every 16 bars, its cycle is 16 bars.
In the picture above, we used the Williams Fractal to identify pivots.
Formula for Indicator Settings :
- RSI Period = Half the average cycle → If cycle = 16 bars → RSI = 8 days.
- MACD Settings : Fast EMA = ¼ cycle, Slow EMA = ½ cycle → Cycle = 16 → Fast EMA = 4, Slow EMA = 8
---
Step 3: Test Your Calibrated Indicators
Backtest on TradingView :
1. Add your indicator (e.g., RSI) with the new settings.
2. Use the Strategy Tester (click "Add to Chart" → " RSI Strategy ") to see if signals improve.
Look For :
- Fewer false signals (e.g., RSI saying "oversold" too early).
- Clearer trends (MACD crossovers matching price moves).
---
Calibrating Popular Indicators (Simple Rules)
1. RSI (Relative Strength Index)
- Default : 14 days.
- Calibrated : Half the average cycle length.
- Example : Cycle = 16 bars → RSI = 8 days.
Why It Works : Shorter RSI reacts faster to volatile markets (like crypto).
2. MACD
- Default : 12, 26, 9.
- Calibrated :
- Fast EMA = ¼ of cycle.
- Slow EMA = ½ of cycle.
- Signal Line = ⅙ of cycle.
- Example : Cycle = 20 → Fast = 5, Slow = 10, Signal = 3.
Why It Works : Matches the asset's natural momentum shifts.
3. Williams %R
- Default : 14 days.
- Calibrated : Same as RSI (half the cycle).
---
How to Avoid Common Mistakes
Mistake 1 : Overfitting (Making It Too Perfect for the Past)
- Problem : If you calibrate too precisely to old data, it might fail in the future.
- Fix : Test on 2 types of data:
1. Training Data : First 70% of your chart (to calibrate).
2. Testing Data : Last 30% (to check if it still works).
Mistake 2 : Ignoring Market Changes
- Problem : What works today might not work next month.
- Fix : Recheck your settings every 3 months or after big news (e.g., Fed rate hikes).
---
Free Tools to Help (No Coding Needed)
1. TradingView's "Auto-Detect Cycle" Scripts
Search for indicators like "Cycle", "RSI Adaptive" or " Rainbow Adaptive RSI " in TradingView's public library. These automatically calculate cycle lengths (Not tested).
2. Adaptive MACD/RSI Indicators
Try pre-built adaptive indicators like:
- Adaptive MACD : Adjusts itself based on volatility.
- Dynamic Pivot : Uses pivots to set stop-loss and take-profit levels.
---
Building a Simple Pivot Calibration System
Basic ZigZag Calibrator Method :
1. Add ZigZag to your chart.
2. Manually count the bars between 5 recent swings.
3. Calculate the average → Divide by 2 → Use that number for your RSI/MACD.
Example :
- Swings: 12, 14, 16, 10, 8 bars → Average = 12.
- Calibrated RSI = 6 days.
---
Why This Works (Without the Math)
Markets move in waves. By matching your indicator's speed to the wave length, you "surf" the trend instead of fighting it. Research shows adaptive methods like this beat default settings.
The Science Behind It
When you calibrate to an instrument's natural rhythm:
- Oscillators (RSI, %R) catch extremes at the right time
- Trend indicators (MACD) signal changes faster
- Volatility bands (Bollinger Bands) expand and contract appropriately
---
A Step Further: Multi-Timeframe Calibration
For even better results, calibrate across timeframes:
1. Calculate cycles on daily charts for swing trading
2. Calculate cycles on 4-hour charts for day trading
3. Use both calibrated indicators together for confirmation
---
Final Tips for Beginners
1. Start Small : Calibrate one indicator (like RSI) first.
2. Use Free Tools : TradingView has thousands of free scripts to automate calculations.
3. Keep Records : Document what settings work for which assets.
4. Be Patient : Finding the right calibration takes time, but the results are worth it.
Calibration isn't about being perfect—it's about making your tools work better for specific markets . Happy trading!

Using The CRADLE Pattern To Time/Execute TradesThis simple video highlights one of my newest pattern definitions - the Cradle Pattern.
In addition to the many other patterns my technology identified, this Cradle Pattern seems to be a constant type of price construct.
I'm sharing it with all of you so you can learn how to identify it and use it for your trading.
Ideally, this pattern represents FLAGGING after a trend phase.
It is a consolidation of price within a flag after a broad trending phase.
It usually resolves in the direction of the major trend, but can present a very solid reversal trigger if the upper/lower pullback range is broken (see the examples in this video).
Learn it. Use it.
Price is the ultimate indicator.
Learn to read price data more efficiently to become a better trader.
Get some.
#trading #research #investing #tradingalgos #tradingsignals #cycles #fibonacci #elliotwave #modelingsystems #stocks #bitcoin #btcusd #cryptos #spy #gold #nq #investing #trading #spytrading #spymarket #tradingmarket #stockmarket #silver

Trend Changing Pattern (TCP) ExplainedIntroduction
One of the most important skills in forex trading is learning how to read price action and understand what the market is telling you. Price is not just numbers — it’s the collective perception of traders, making it the most reliable leading indicator available.
Today, I want to explain a powerful concept known as the Trend Changing Pattern (TCP) — a crucial tool for identifying potential market reversals and shifts in trend direction.
📈 What Is a Trend Changing Pattern?
In any trending market, whether it's an uptrend or downtrend, the trend won’t change easily. The strength of the trend and the timeframe you're trading on will determine how long it takes for a true reversal to occur.
One key signal of a trend change is a shift in momentum:
In an uptrend, when a momentum low forms during a pullback, it can be a sign that the trend is beginning to reverse.
In a downtrend, a momentum high during a pullback can signal a potential bullish reversal.
These are what we refer to as Trend Changing Patterns (TCPs) — moments where the structure of the market starts to shift.
⚠️ Watch for Manipulation After the TCP
After a TCP appears, it's common to see price manipulation before the new trend fully takes hold:
In an uptrend, price may return to manipulate the previous high before continuing down.
In a downtrend, price often dips to manipulate the previous low before reversing higher.
Being aware of this common liquidity grab helps traders avoid being trapped and instead position themselves in alignment with the new trend.
🧠 Final Thoughts
Understanding how to spot and interpret a Trend Changing Pattern gives you a major edge in forex trading. It helps you stay ahead of the market and make informed decisions based on price action, not emotion.
🎥 In the video, I go into more detail about momentum highs and lows, and how to recognize these key patterns in real time. Be sure to check it out if you want to sharpen your trend reversal strategy.
Wishing you success on your trading journey! 🚀

Ultimate Guide to Mastering Chart PatternsChart patterns are essential tools for traders looking to identify high-probability setups based on price action. Among the most reliable continuation and reversal patterns are triangles, wedges, and flags. These formations help traders anticipate market direction and make informed decisions based on breakout potential, trend strength, and volume confirmation.
In this guide, we’ll explore the key characteristics, trading strategies, and confirmation techniques for each of these patterns to improve trade execution and risk management.
Triangle Patterns
Types of Triangle Patterns
Triangles are consolidation patterns that indicate a period of indecision before price continues in the direction of the breakout. There are three main types of triangle patterns:
Ascending Triangle – A bullish continuation pattern where the price forms higher lows while resistance remains flat.
Descending Triangle – A bearish continuation pattern where the price forms lower highs while support remains flat.
Symmetrical Triangle – A neutral pattern where price forms lower highs and higher lows, squeezing into an apex before breaking out.
How to Trade Triangles
Identify the Triangle Formation: Look for at least two touchpoints on each trendline (support and resistance) to confirm the pattern.
Wait for Breakout Confirmation: The price should break above resistance (bullish) or below support (bearish) with strong volume.
Set Entry & Stop-Loss Levels: Enter the trade after a candle closes beyond the breakout point. Set a stop-loss below the most recent swing low (for bullish trades) or above the swing high (for bearish trades).
Measure Target Price: The expected move is typically equal to the height of the triangle measured from the widest part of the pattern.
Wedge Patterns
Types of Wedge Patterns
Wedges are similar to triangles but are characterized by sloping trendlines that converge in the same direction. They indicate a potential trend reversal or continuation depending on the breakout direction.
Rising Wedge – A bearish reversal pattern that forms during uptrends. The price makes higher highs and higher lows, but the slope narrows, signaling weakening momentum before a breakdown.
Falling Wedge – A bullish reversal pattern that forms during downtrends. The price makes lower highs and lower lows within a narrowing channel before a breakout to the upside.
How to Trade Wedges
Identify the Wedge Pattern: Look for a contracting price range within two sloping trendlines.
Watch for a Breakout: The price should break either above (for falling wedges) or below (for rising wedges) with increasing volume.
Confirm the Breakout: Use additional indicators such as RSI divergence or moving average crossovers to validate the move.
Set Entry, Stop-Loss, and Target: Enter after the breakout candle closes beyond the trendline, with a stop-loss outside the opposite side of the wedge. Target the height of the wedge projected from the breakout point.
Flag Patterns
Characteristics of Flag Patterns
Flag patterns are continuation patterns that occur after a strong impulsive move (flagpole), followed by a period of consolidation (flag) before price resumes the trend. Flags can be classified as:
Bullish Flag – Forms after a strong upward move, followed by a downward-sloping consolidation.
Bearish Flag – Forms after a strong downward move, followed by an upward-sloping consolidation.
How to Trade Flag Patterns
Identify the Flagpole: Look for a sharp price move in one direction, which forms the base of the flag.
Confirm the Flag Formation: Price consolidates within parallel trendlines that slightly slope against the prior trend.
Wait for the Breakout: Enter when price breaks out of the flag pattern in the direction of the previous trend with strong volume.
Measure Target Price: The price target is typically equal to the length of the flagpole projected from the breakout point.
Set Stop-Loss: Place the stop-loss below the lower boundary of the flag (for bullish flags) or above the upper boundary (for bearish flags).
Common Mistakes & How to Avoid Them
Trading Before Confirmation: Many traders enter too early without waiting for a breakout confirmation, leading to false signals.
Ignoring Volume: Breakouts should be accompanied by a volume surge for validation; weak volume can indicate a fake breakout.
Setting Tight Stop-Losses: Giving the trade enough room to breathe by placing stops outside key support/resistance levels prevents getting stopped out prematurely.
Forgetting to Manage Risk: Always follow proper risk-reward ratios (at least 1:2) to ensure profitable long-term trading.
Final Thoughts
Triangle, wedge, and flag patterns are powerful tools for traders who understand their structure and breakout behavior. By combining these patterns with volume analysis, trend confirmation indicators, and proper risk management, traders can increase their chances of success. Whether you're trading stocks, forex, or crypto, mastering these patterns will enhance your ability to navigate the markets efficiently.
__________________________________________
Thanks for your support!
If you found this guide helpful or learned something new, drop a like 👍 and leave a comment, I’d love to hear your thoughts! 🚀
Make sure to follow me for more price action insights, free indicators, and trading strategies. Let’s grow and trade smarter together! 📈

2 April Liberation Day: USA-Europe War Impact on ForexHi, I'm Forex Trader Andrea Russo and today I want to talk to you about an event that is shaking global markets: the tariff war between the United States and Europe.
Sunday, April 2, we started in force and new American news, celebrating "Liberation Day" by President Donald Trump. These data, which include 25% tariffs on your steel, aluminum and automobiles, look to rebalance the trade deficit of the United States. However, Europe is not ready to be saved. Ursula von der Leyen, president of the European Commission, has said that Europe has not started this matter, but is ready to defend its interests with a strong plan for control2.
The tension between the economic power has caused a significant impact on the market. The European stock exchange has not recorded consistent losses, with Milan having lost 16.4 million euros. Europe has responded with tariffs to its strategic American products, such as whiskey, motorcycles and legumes, and is evaluating further measures to protect its own industry4.
Forex Impact
This commercial war will bring about repercussions directly on the Forex market. Here's what to expect:
Removal of the American Dollar (USD): Protectionist tariffs tend to reforce the dollar, as they reduce the command of foreign currencies for imports. In addition, the increase in the price could lead the Federal Reserve to modify its own monetary policy, increasing interest rates.
Volatility of European Currencies: The euro (EUR) may rise in pressures due to economic uncertainties and European constraints. Also the value of the Swedish crown (SEK) may be negatively influenced.
Opportunity for the Trader: The volatility generated by these tensions offers opportunities for the Forex trader. Significant movements and exchange rates can be completed with trading strategies soon, but fundamentally adopt rigorous risk management.
Conclusion
The tariff war between the United States and Europe represents a significant loss for the global economy and the Forex market. Tomorrow will be a crucial day, and the trader will not carefully monitor the resources to adapt their own strategy. Always advise me to do my own analysis and operate with prudence.
Happy trading everyone!

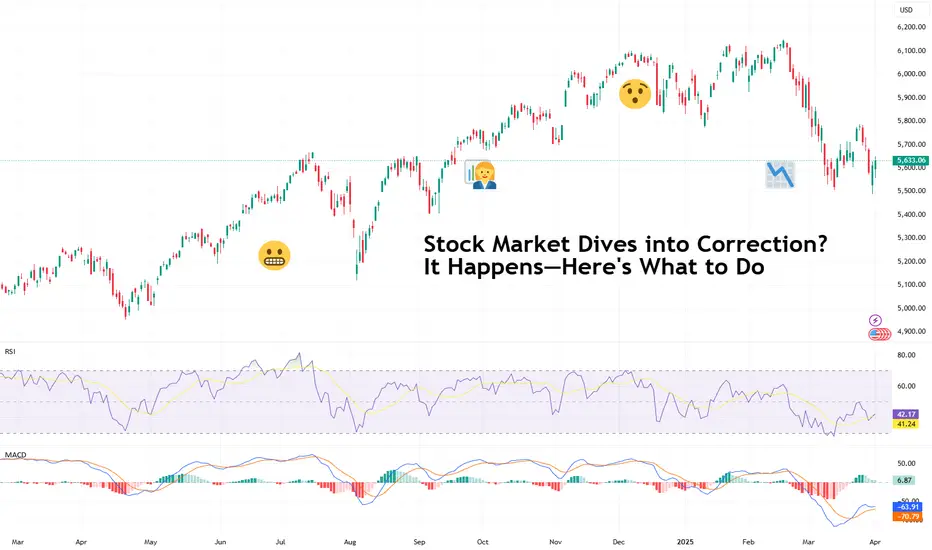
Stock Market Dives into Correction? It Happens—Here's What to DoYou wake up, check your portfolio, and see a sea of red. The market’s down, your stocks are taking a nosedive, and CNBC is running apocalyptic headlines about an impending crash. Sounds familiar?
It’s maybe because we’re in (or super close to) a correction right now — the S&P 500 SP:SPX was down 10% from its record high two weeks ago and a lot of people are unsure what to do.
The truth of the matter is, stock market corrections are routine—not as often as the meeting that should’ve been an email, but also not as rare as a winning trade in the Japanese yen ( widow maker is real, yo ).
And, most importantly, they’re usually not as catastrophic as they feel in the moment.
So, before you hit the panic button (or worse, start revenge trading to “win it all back”), let’s talk about what’s shaking the market right now and how to navigate corrections like a pro.
🤔 First Things First: What’s a Correction?
A stock market correction is a drop of 10% or more from a recent high. It’s not a crash, it’s not the end of capitalism, and it’s definitely not a sign that you should liquidate your entire portfolio and move to a remote cabin in the woods.
Corrections happen regularly, typically once every year or two. They’re a natural part of market cycles, shaking out excessive speculation and resetting valuations to more reasonable levels.
For the record, a drop of 20% is considered a bear market.
🤝 Why the Market’s Getting Jittery
Markets don’t move in straight lines, and sometimes they hit turbulence. Lately, two big themes have been dominating headlines:
Trump’s Hard-Line Tariffs Hit Hard (And Markets Are Nervous About It)
If there’s anything Trump knows how to do is say things online or on-site and move markets. And his hostile and straight up combatant approach to handling international relations has sent traders scrambling to offload risk.
With hiked tariffs on China, Europe, and Mexico and Canada, businesses are bracing for severe supply chain disruptions, higher costs, and tighter margins. When tariffs go up, corporate earnings tend to go down—and the market doesn’t like that math.
Inflation Just Won’t Quit
The Federal Reserve spent most of the last two years trying to tame inflation, and just when it seemed like things were cooling off, it’s creeping back up. The latest readout of the personal consumption expenditures (PCE) report showed prices ticked up more than expected at 2.8% in February.
Higher inflation means the Fed might keep interest rates elevated for longer than expected, making borrowing more expensive and slowing down growth. Every new inflation release has investors guessing: Will the Fed cut rates, hold steady, or—worst case—hike again?
Between trade wars and stubborn inflation, uncertainty is running high, and that dynamics breeds volatility. But a correction doesn’t mean the market is broken—it just means sentiment has shifted.
⚠️ How NOT to React (aka: Rookie Mistakes to Avoid)
When corrections hit, bad decision-making is at an all-time high. Here’s what not to do:
Panic selling – Selling at the bottom is a classic rookie move. If you weren’t planning to sell at the highs, why dump everything when it’s down?
Trying to time the exact bottom – Good luck. Nobody, not even Warren Buffett, can catch the bottom (not that he’s trying). If you’re waiting for the “perfect” dip, you’ll likely miss the rebound.
Going all-in on one asset – Thinking of putting everything into one stock or crypto because it’s “cheap” now? Please don’t. Diversification exists for a reason .
Getting glued to financial news – Watching every market update during a correction is like doom-scrolling Google after a mild headache—you’ll only freak yourself out more.
Now that we’ve covered what not to do, let’s focus on the smart plays.
💪 So, What Should You Do?
If you want to come out of a correction with your sanity (and portfolio) intact, here’s your game plan:
1️⃣ Zoom Out—Corrections Are Temporary
The market moves in cycles, and corrections are just part of the game. Historically, corrections last a few months, while bull markets last years. If you’re investing for the long term, a correction is a blip on the chart, not an extinction event.
2️⃣ Review Your Portfolio Like a Hedge Fund Manager
Corrections are a great excuse to audit your holdings. Ask yourself:
Is this stock/ETF/index still worth holding?
Has anything fundamentally changed, or is this just temporary market noise?
Do I have too much exposure to one sector?
Think of it as spring cleaning for your investments. It's also an opportunity to make some good use of the handy Stock Screener or Stock Heatmap to spot the best (and worst) performers. If something was a FOMO buy and doesn’t belong in your portfolio, consider trimming it.
3️⃣ Buy Selectively, Not Blindly
Corrections create opportunities, but that doesn’t mean you should just throw money at every stock that’s down. Some companies deserve their declines ( looking at you, Nikola )—others are just collateral damage in a broader selloff.
Look for quality companies with strong earnings, manageable debt, and real growth potential. If they were solid before the correction, they’ll likely recover faster than the overhyped names.
Example: Remember when Amazon stock NASDAQ:AMZN tanked 90% in 2000, the dot-com bubble? No, because you were too busy being 2 years old instead of loading up on Jeff Bezos’s dream. And look where the guy’s now.
4️⃣ Do Some Good Old DCA
Instead of dumping all your cash into the market at once, use dollar-cost averaging (DCA). Buying in small increments at regular intervals helps you avoid the stress of trying to time the bottom. If prices drop further, you can buy more at an even better price.
5️⃣ Keep Emotions in Check
Corrections test your patience and discipline. The best investors don’t let fear dictate their strategy. If you’re getting emotional about your trades, step away from the screen and take a breath. The market will be there when you come back.
👍 The Market Always Bounces Back—Eventually
Every correction feels like the worst one while it’s happening. But let’s look at history:
The S&P 500 has faced 30+ corrections since 1950. It survived them all.
The average correction lasts four months before a recovery begins.
After a correction, markets typically rally higher within a year.
Unless you believe the global economy is permanently broken (hint: not yet, at least), every major downturn has eventually turned into a new bull run.
🦸♂ Final Thought: Be the Hero, Not the Victim
Market corrections separate the professionals from the wannabes. The people who panic and sell at the bottom? They usually regret it. The ones who keep a level head, stick to their strategy, and take advantage of good opportunities? They come out stronger.
And finally, if you need to take away one thing it’s this: Corrections aren’t the enemy. They’re the price of admission for long-term gains.
👉 Let’s hear it from you!
How do you handle corrections, what’s your strategy when the market is in a downturn and what’s in your portfolio then? Share your experience in the comment section!