Wave Analysis
10Y Bond Yield Long (Bond Short): Another recession signal?Take note that I do have a bias on when analyzing the bond yield. But the counts are valid nonetheless, except that another leg down is also valid (as briefly mentioned). Take this as a part 2 to the multi-assets analysis that I made on 11th April.
BRIEFING Week #15 : Arbitrages on the lookoutHere's your weekly update ! Brought to you each weekend with years of track-record history..
Don't forget to hit the like/follow button if you feel like this post deserves it ;)
That's the best way to support me and help pushing this content to other users.
Kindly,
Phil
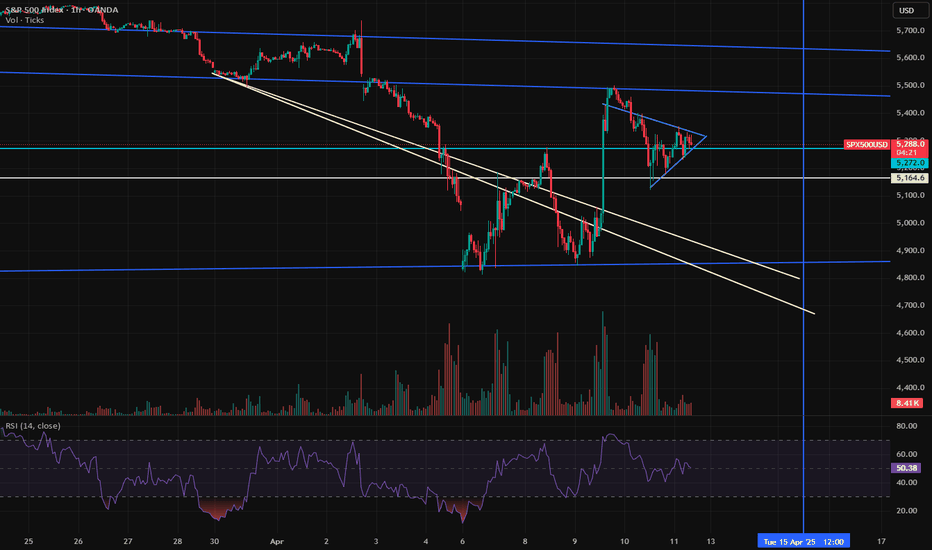
S&P500 Still a Short: Be mindful of Alternate CountI discuss how the additional wave up could have a larger implication on the entire outlook of S&P500 and could cause a re-labelling of the entire wave structure. What we want to see in order to keep our primary count, is a breakdown below the low of where I plotted wave 1 of C. That is, below 5119.8.
But no matter the primary count or the alternate count, it is still a short opportunity. But there is an implication on the Take Profit target.
Trading A Divergence Trade (Breakdown) with Pivots and LiquidityTrading divergences was always a problem for me in the past. I did the same thing you did and got it wrong every time. I was trading divergences when i saw them instead of realizing a divergence is a flip of support and resistance levels. I just needed to know where they are.
In this video:
Internal vs External Pivot divergence confirmation:
You can have two types of pivots on your chart. One for long term and one for short term.
Using them to confirm short and long term price action is intuitive as youll be able to see the market squeezing on the short term while knowing where your long term price structure exists.
Price action to Divergence Confirmation:
A divergence on a short term pivot is an indication of short term loss of trend or reversal.
If the short term has no divergence but the long term does, you are about to end up with some pretty large price moves.
Youll be confirming the divergence by looking for highs, lows, and closes moving the wrong way from current price action.
This video will give you a method you can use to draw out your support zone / resistance zone / divergence zone and use them to your advantage.
The "Divergence Zone" that you draw out is the very reason why so many people fail at divergences.
Bare in mind that when you have a divergence, support and resistance are on the WRONG sides as their normally are so you'll learn here how to find those zones as well.
Then in the end of the video ill show you how to use lower timeframes to confirm the new move of the market.
Thanks, everyone. For coming through to the CoffeeShop.
Dow Jones - Value Is The King Of 2025!Dow Jones ( TVC:DJI ) withstands all bearish struggles:
Click chart above to see the detailed analysis👆🏻
All major U.S. indices have been weakening lately but the Dow Jones is clearly the strongest of all. It seems like big institutions are shifting back to value stocks and therefore the Dow Jones remains very strong. Looking at technicals, this trend is rather likely to continue during 2025.
Levels to watch: $40.000, $50.000
Keep your long term vision,
Philip (BasicTrading)
* BTC Elliot Waves Update: 2 scenarios *Hello again degenerates,
I promise you i am trying to make shorter videos hehe, but in this video I had to explain 2 scenarios that I can see happening, I give you some insight on what to be careful on both scenarios, and I go back to our SPY chart to do a quick review of how it support our scenarios.
Let me know what you think!


