* BTC Elliot Waves Update: 2 scenarios *Hello again degenerates,
I promise you i am trying to make shorter videos hehe, but in this video I had to explain 2 scenarios that I can see happening, I give you some insight on what to be careful on both scenarios, and I go back to our SPY chart to do a quick review of how it support our scenarios.
Let me know what you think!
Wave Analysis
Connecting Your Tickmill Account to TradingView: A Step-by-Step In this step-by-step guide, we’ll show you exactly how to connect your Tickmill account to TradingView in just a few seconds.
✅ Easy walkthrough
✅ Real-time trading from charts
✅ Tips for a smooth connection
Don’t forget to like, comment, and subscribe for more trading tutorials!
All Strategies Are Good; If Managed Properly!
~Richard Nasr
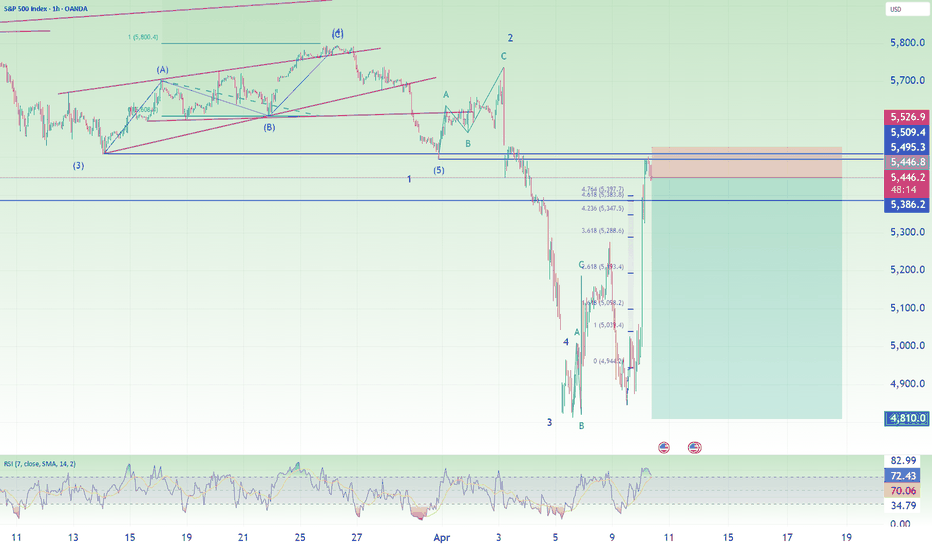
Nasdaq and S&p500 short: Completion of B waveI mentioned in my previous analysis that we are waiting for a short (the previous one was a long-then-short linked with this idea). I did not post any short idea yesterday after that NOT because I am good and recognize a double combination. It's really because I was too busy with work and I am glad my last was a long-then-short.
Back to this, remember that the huge volatility has caused the points in the chart to compress and thus even though the stop loss looks small, it is actually still quite a number of points away. So my suggestion is to manage your size and keep it small relative to your account.
Good luck!
USDCHF's 4H Bullish Structure Break – Is It Time to Buy?After a bearish phase, the USDCHF has turned its momentum around following Trump's announcement of a 90-day tariff pause. This news injected fresh optimism into the markets, triggering a rally that overturned previous downtrends. On the four-hour chart, we observe a break of structure that hints at a bullish reversal. The ideal entry point appears to be the pullback to the 50% Fibonacci retracement level—a historically reliable support zone—setting up a clean long opportunity. Current market sentiment, bolstered by easing geopolitical tensions and renewed risk appetite, supports this bullish outlook. As always, use appropriate risk management strategies and treat this analysis as a trade idea rather than financial advice. 🚀📈💹
XAGUSD Trade Plan: 1D Support, Liquidity Grab, & Bullish Setup!Silver (XAGUSD) is currently exhibiting signs of being overextended, as evidenced by its recent price action on the daily and 4-hour timeframes. The metal has traded into a critical support zone, marked by previous lows on the daily chart. This zone represents a significant area of interest, as it has historically acted as a key level for buyers to step in. However, the current price action has dipped below these lows, eating into sell-side liquidity in the form of stop-loss orders placed beneath this level. This liquidity grab is a classic move often seen in markets before a potential reversal.
On the 15-minute timeframe, the price is consolidating within a range, suggesting a possible accumulation. A break above this range, accompanied by a bullish market structure shift, could signal the beginning of a reversal and provide a compelling buy opportunity. This aligns with the idea of a "spring" in Wyckoff theory, where price manipulates liquidity before reversing direction.
Traders should remain patient and wait for confirmation of a bullish breakout on the lower timeframe before entering long positions. Key factors to monitor include strong bullish momentum, a clear break of the range, and the formation of higher highs and higher lows. Until these conditions are met, caution is advised, as the current downtrend could persist. 📉➡️📈
Key Levels to Watch:
Support Zone: Previous daily lows (now acting as a liquidity zone).
Resistance Zone: The upper boundary of the current 15-minute range.
Trading Plan:
Wait for a break of the 15-minute range to the upside. 🚀
Look for a bullish market structure shift (higher highs and higher lows). 📊
Enter long positions with a tight stop-loss below the range low. 🛡️
Target key resistance levels on the 4-hour and daily timeframes for potential take-profit zones. 🎯
This analysis highlights the importance of patience and discipline in trading. While the current setup is promising, confirmation is key to avoid premature entries. As always, this is not financial advice, and traders should conduct their own due diligence before making any decisions. ⚠️
Avalanche (AVA): Overextended! Is This Ready for a Bullish Move?Avalanche (AVAX) is currently presenting an intriguing setup, with price action showing signs of being overextended on the daily and 4-hour timeframes. The cryptocurrency has recently traded into a critical support zone, defined by previous swing lows on the daily chart. This area has historically acted as a strong demand zone, attracting buyers. However, AVAX has now dipped below these lows, triggering sell-side liquidity in the form of stop-loss orders placed beneath this level. This liquidity grab could be a precursor to a potential bullish reversal. 🚀
On the 15-minute timeframe, AVAX is consolidating within a tight range, reflecting indecision among market participants. A break above this range, coupled with a bullish market structure shift, could signal the start of a reversal and provide a high-probability buy opportunity. This setup aligns with the concept of a "liquidity sweep," where price manipulates stop orders before reversing direction.
Key Observations:
Daily Timeframe: Price has dipped below key swing lows, eating into sell-side liquidity.
4-Hour Timeframe: Overextension is evident, with price trading into a significant support zone.
15-Minute Timeframe: Consolidation within a range, awaiting a breakout.
Trading Plan:
Wait for Confirmation: Monitor the 15-minute timeframe for a bullish breakout above the current range. 📈
Market Structure Shift: Look for higher highs and higher lows to confirm bullish intent. 🔍
Entry Strategy: Enter long positions after a confirmed breakout, with a stop-loss placed below the range low. 🛡️
Target Levels: Aim for resistance zones on the 4-hour and daily timeframes as potential take-profit areas. 🎯
Key Levels to Watch:
Support Zone: Previous daily swing lows (now acting as a liquidity zone).
Resistance Zone: The upper boundary of the 15-minute range and key levels on the 4-hour chart.
This setup highlights the importance of patience and discipline in trading. While the liquidity grab below support is a promising signal, confirmation of a bullish breakout is essential to avoid false moves. As always, this is not financial advice, and traders should conduct their own research before making any decisions. ⚠️
Bitcoin’s Sharp Drop—What’s Next After the Crash? Bitcoin’s Sharp Drop—What’s Next After the Crash?
Bitcoin has plunged below $77,000, marking a significant downturn as global markets react to Trump’s tariff policies.
Cryptocurrencies sold off sharply heading into the week in Asia, underscoring a clear risk-off sentiment across markets. The slide comes as US president Donald Trump dug in on sweeping tariffs that have already wiped trillions in value from US equities. US equity-index futures slumped and the yen surged in a sign of deepening turmoil throughout financial markets.
You may watch the analysis for further details!
Thank you and Good Luck!
❤️PS: Please support this analysis with a like or comment if you find it useful for your trading day. ❤️
Nasdaq Pending Short: Completion of Wave 1 of CLike I mentioned in the video, we have completed a 5-wave structure for wave 1 of C. We are currently in wave 2 of C. And while this is a long-then-short idea, I feel that the risk to go long at this point of my posting is too risky, so it's better to wait for a short opportunity.
Dogecoin - This Candle Decides Everything!Dogecoin ( CRYPTO:DOGEUSD ) is about to close above support:
Click chart above to see the detailed analysis👆🏻
When we look at the chart of Dogecoin, we can again see that this bullish cycle was starting with a clear rounding bottom formation. This simply means that there is a 100% chance that a bullish parabolic rally will follow and this monthly candle might just be the beginning.
Levels to watch: $0.15, $0.5
Keep your long term vision,
Philip (BasicTrading)


