BITCOIN - The Bearish Scenario - Sign's of a Possible Top...In this video, I explore the possibility that Bitcoin may have already hit a temporary peak.
My perspective comes from initially building a bullish case—only to uncover subtle flaws that I chose to set aside.
But as I meticulously documented my observations, those cracks in the bullish argument became impossible to ignore. When I switched to a bearish wave count, some thing began to align, shedding light on areas of the chart that previously seemed uncertain.
These market waves are intricate, requiring patience and a fresh perspective to decipher where we truly stand in the broader pattern.
Only after stepping back and allowing time for meaningful price action does the picture start to come into focus.
I also touch on Ethereum's pattern and the Dow Jones.
Wave Analysis
Nikkei, S&P500, Nasdaq, Hang Seng Short: Educational UpdateThis is really an extra video that I made because I see some educational value. I use Nikkei 225 to show repeating of patterns and the fractal nature of the market, S&P and Nasdaq to demonstrate the usage of Fibonacci levels and study of historical support and resistance, and finally Hang Seng to discuss on placing stop losses and how noise in lower time frames may require us to ignore certain "unclean" waves.
Overall, I still put this idea as a short because all the indices used are still short ideas in my opinion.
Good luck!
FTSE 100: Can April's Seasonal Surge Overcome Fiscal Tightening?🌸 April: A Historically Bullish Month for the FTSE 100 📈
Over the past 25 years, April has consistently been the strongest month for the FTSE 100, delivering an average return of 2.28% and boasting a 76% win rate. 🌟 This seasonal strength is driven by several key factors:
📊 Earnings Season Momentum: April is a pivotal month for corporate earnings, with many FTSE 100 companies benefiting from a post-first-quarter earnings boost. 💼
💷 Fiscal Year-End Flows: UK-based funds often adjust their portfolios at the end of the tax year in early April, leading to a reallocation into equities. 🔄
💸 Dividend Reinvestment: As a high-dividend-yielding index, the FTSE 100 typically experiences dividend reinvestment flows in April, further supporting stock prices. 📈
Despite the challenging macroeconomic environment, these seasonal drivers suggest that the FTSE 100 could maintain its historical trend of strong April performance. Notably, even in years with intra-period declines of up to 6.88%, the index has managed to deliver positive returns during this period. 💪
🇬🇧 UK Fiscal Policy and Market Implications 💡
This year, the bullish seasonal trend for the FTSE 100 coincides with significant fiscal developments. On March 26, UK Chancellor Rachel Reeves delivered the Spring Statement, outlining measures to stabilize public finances amidst mounting economic pressures. 📜 According to the Office for Budget Responsibility (OBR), the UK is at risk of missing key fiscal targets, prompting the government to model spending cuts of up to 11%. Welfare programs and green investments 🌱 are expected to bear the brunt of these reductions.
Additionally, the Bank of England's stance on inflation remains a critical factor. 📉 Persistent inflation risks could lead to a more hawkish monetary policy, potentially weighing on rate-sensitive sectors within the FTSE 100. However, the index's strong seasonal pattern, driven by earnings momentum, fiscal year-end flows, and dividend reinvestments, provides a counterbalance to these headwinds. ⚖️
🔮 Outlook for April 2025 🌟
As of late March 2025, the FTSE 100 has shown resilience, with sectors such as energy ⚡ and homebuilders 🏠 leading gains ahead of the Spring Statement. While fiscal tightening and inflationary pressures present challenges, the historical strength of April, combined with supportive seasonal factors, suggests that the FTSE 100 could still deliver positive returns this month. 📅 Investors will closely monitor the impact of fiscal policy adjustments and the Bank of England's monetary stance as they navigate this critical period. 🧐
Not Financial Advice.
Dollar Index Bullish to $111.350 (VIDEO UPDATE)If you remember on the last update, I showed the possibility of the previous Wave 4 low getting taken out, which did happen. I’ve now re-counted the waves, as analysed on the video above.
⭕️3 Sub-Wave Correction (A,B,C) relabelled.
⭕️Wave 4 Low relabelled.
⭕️Main Supply Zone highlighted.
BITCOIN - Key Buying Area 74K - 76K Range At Wave iv Low...In this video, I break down a potential scenario that could initiate a major surge in Wave v of Wave 5.
If this is the final move, it should be strong—possibly even sharper than Wave iii.
I outline the key buying zone, which represents the lowest point price may reach before reversing into a powerful impulsive move.
My plan is to go long within the $74K–$76K range, adding to the position as momentum builds.
Ideally, I’m targeting $120K, as it aligns with the length of Wave iii.
Based on my analysis, the low for Wave iv is likely around March 31st, with $73,880 acting as key support. Stay tuned for more updates!
GOLD TOP IS NEARGold appears to be distributing on all timeframes excepting daily , this added to the extensive media coverage recently makes me think that a significant all time top is near , gold still maintains support on all timeframes but that is probably the only thing holding it from a big crash.
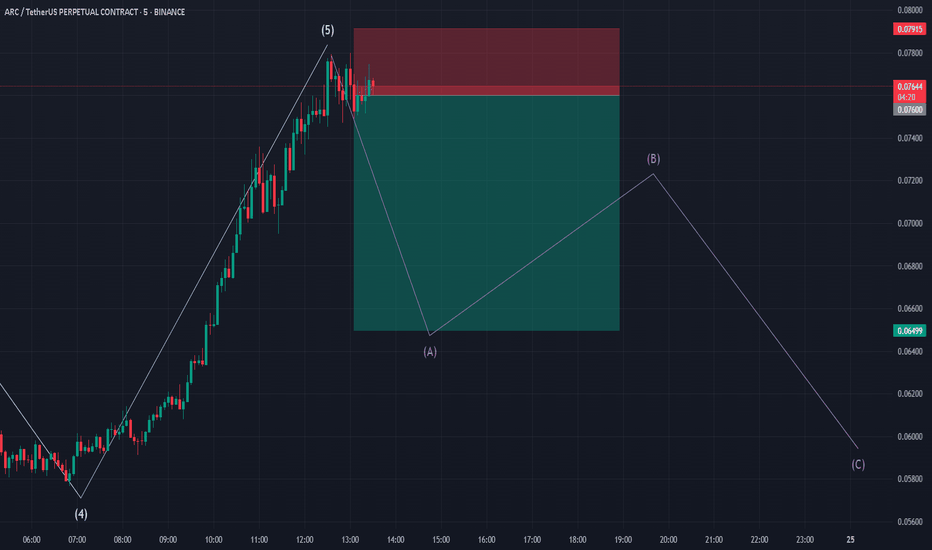
ARC/USDT - Elliott Wave Completion and ABC Correction ExpectedThe ARC/USDT perpetual contract on Binance has completed a classic 5-wave Elliott impulse pattern, peaking at wave (5). Based on Elliott Wave Theory, a corrective ABC pattern is expected, with wave A initiating a decline.
Entry: Short position near wave (5) peak
Target: Wave C completion zone around 0.056
Stop Loss: Above recent high near 0.0817
The retracement aligns with Fibonacci levels and prior support zones, suggesting a potential pullback before further trend continuation. Manage risk accordingly.


