Wave Analysis
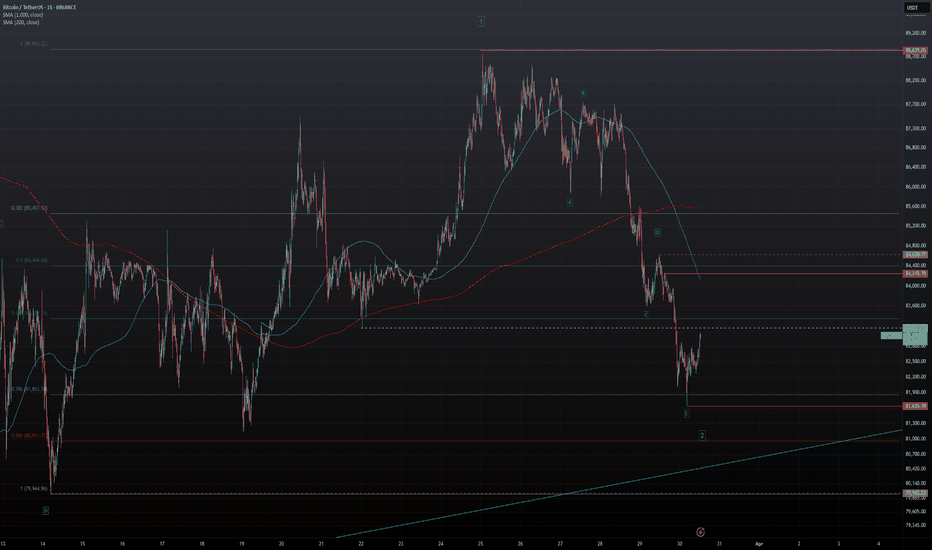
BITCOIN - Key Levels To Watch If You Expect A Bounce...Due to the lack of sustained downward momentum overnight and the overall weak move, I have relabeled the decline from $88,839 as a sharp correction, potentially marking the end of Wave 2 in a Wave E corrective bounce.
Wave 1 appears to be a Type-2 Weak 5-Wave move that began at $79,962.
To confirm this bounce, we need a break above $84,630, with a protective stop set at the last low, currently $81,635, aligning with the 0.786 retracement level.
BITCOIN - Small Long Trade Within Wave iii Zig-Zag...In this video, I break down a straightforward long trade based on an internal corrective zig-zag pattern.
This setup demonstrates how to capitalize on short-term trades with a solid risk-reward ratio, securing profits before looking for a re-entry opportunity.
The trade aligns with the anticipation of Bitcoin approaching its recent highs, potentially forming a double top. Currently, the trade has a protective stop at $83,169 and a target of $89,176.
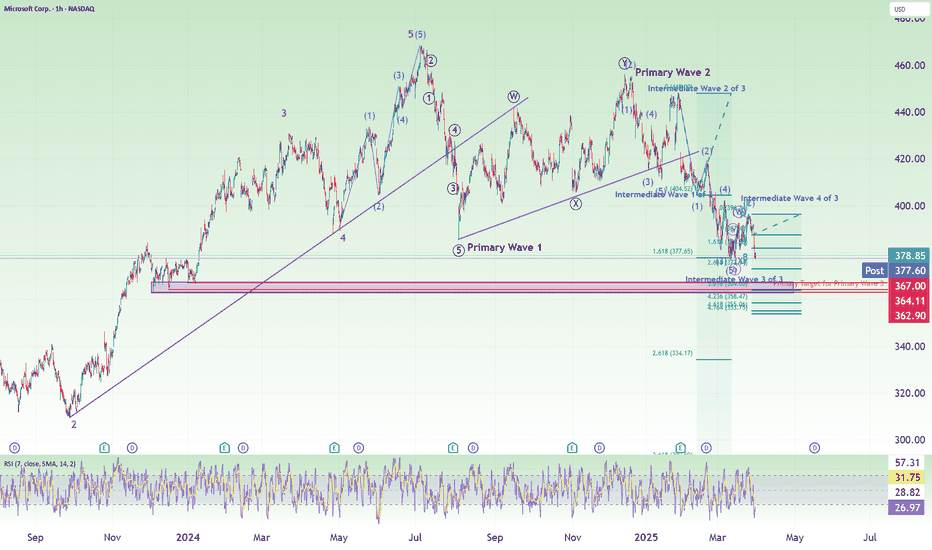
MSFT Short to Neutral: Last Wave 5 of 3 (Target: $364)A video update to Elliott Wave Counts and Price target for MSFT (and Nasdaq).
A summary:
1. Intermediate wave 3 of 3 has ended.
2. Intermediate wave 4 of 3 has ended in a double combination.
3. We are in Minor wave 3 of Intermediate wave 5 of Primary wave 3.
4. Using Fibonacci Extension from Minor wave 1 of against overall Intermediate wave 5 gives us a target of $364, which is within a support zone. This is the Primary Wave 3 completion target.
5. Using Nasdaq, we also noted that we still have a little bit more to our final target.
CRWD 3 hours idea expecting exact up and downThis analysis provides insights into the future movement of Pulp (CRWD) stock based on the 3-hour chart. By examining key technical indicators, price action, and support/resistance levels, we anticipate potential price fluctuations in the short term. The 3-hour chart offers a closer view of the stock’s momentum, helping traders make informed decisions on entry and exit points. Keep an eye on upcoming price patterns and trend shifts that could indicate potential opportunities for profit or risk management.
CADJPY Bullish Surge: Key Levels to Watch Following a strong Canadian GDP report and weaker-than-expected U.S. consumer sentiment data from the University of Michigan, CADJPY has shown significant bullish momentum. Additionally, positive discussions between former U.S. President Trump and PM of Canada Carney have contributed to market optimism.
After bouncing off a 1-hour order block, CADJPY has surged over 50% from its weak opening. If this bullish momentum persists, the pair could target the 106.000–106.500 range in the near term. Traders should watch for continued strength and potential retracements for optimal entries.
CADCHF Bullish Momentum: Will 0.63000 Be the Next Target?The Canadian dollar continues to show strength despite the 25% tariff imposed by the United States. Meanwhile, the DXY opened bearish today, and with ongoing tariff uncertainty, this weakness may persist. As investors gain clarity on policy direction, CAD could further appreciate. Given this momentum, CADCHF has the potential to reach at least 0.63000. However, multiple resistance levels could come into play, making it crucial to monitor lower time frames for partial profit-taking opportunities.
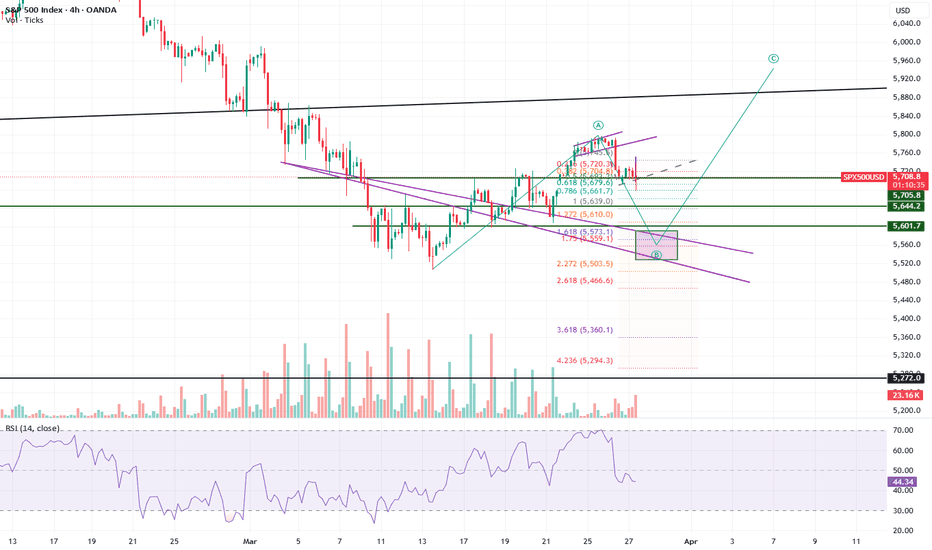
Market Neutral: Nasdaq, S&P500, Nikkei225, Hang SengThe equity indices has fallen to our target and we are seeing 5-wave completions. So I think it is a good time to reduce your shorts and move from a short to a more neutral stance. The current price is also a good support for the indices.
Remember that there is a weekend risk here also.
Good luck!
EURGBP: A Multi-Time Frame AnalysisEURGBP: A Multi-Time Frame Analysis
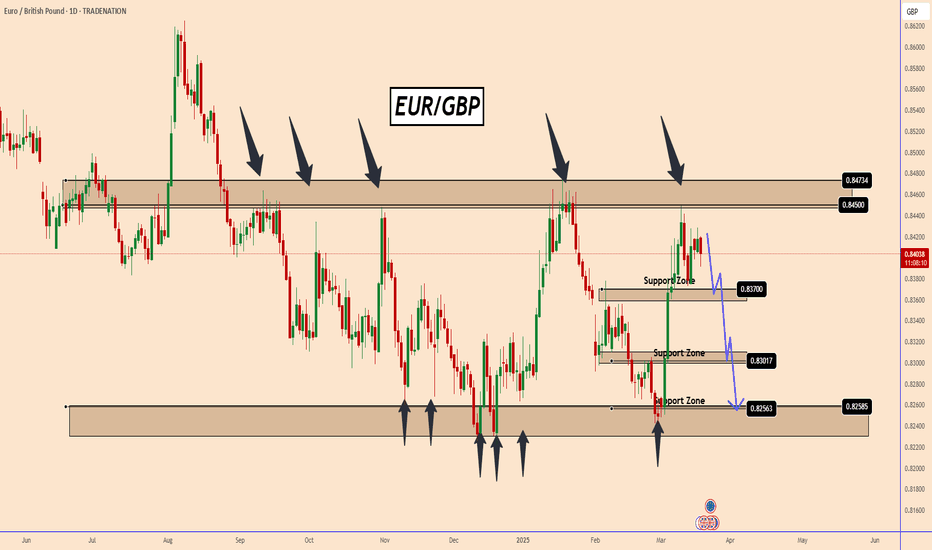
EUR/GBP recently tested a strong resistance zone near 0.8440, prompting a notable price reaction. Based on historical price behavior, there is potential for the pair to move downward again.
The bearish momentum could gain further support from tomorrow's Bank of England (BoE) decision, which may influence market sentiment and drive additional movement in this currency pair.
You may watch the analysis for further details!
Thank you!
❤️PS: Please support with a like or comment if you find this analysis useful for your trading day❤️
Disclosure: I am part of Trade Nation's Influencer program and receive a monthly fee for using their TradingView charts in my analysis.
Nikkei 225 (existing short): Adjust your stop lossThis is the video update that I promised in my previous video. I have mentioned that when prices is reaching the personal target, I will update again.
So for those of you who are still holding a short position, and you want to hold on and see if this is gonna be a big ride down, my suggestion is to adjust your stop loss and maybe reduce you position (i.e. take some profits first).
How you want to manage this trade will be based on your personality and trading style. Good luck!
Gold Wave 5 Bull Complete?! (4H VIDEO UPDATE)As you can see from the video analysis, we’ve re-counted 5 Sub-Waves within the Major Wave 5 bull run. Now we’re waiting for some form of reversal📉
STRICT RULES GIVEN ON THE VIDEO AT WHAT PRICE WE WILL ENTER AGAIN. IF WAVE 3 HIGH BOS IS NOT BREACHED, THEN WE WON’T ENTER❌
Wave 3 BOS: $3,057
Bitcoin - Please Just Listen To The Charts!Bitcoin ( CRYPTO:BTCUSD ) remains in a bullish market:
Click chart above to see the detailed analysis👆🏻
Despite literally everybody freaking out about cryptos lately, big brother Bitcoin is still creating bullish market structure. During every past cycle we witnessed a correction of at least -20% before we then saw a parabolic rally. So far, Bitcoin is just doing its normal "volatility thing".
Levels to watch: 70.000, $300.000
Keep your long term vision,
Philip (BasicTrading)


