European Stocks Rise Amid Positive NewsEuropean stock markets are experiencing a steady rise, buoyed by a series of encouraging developments that have boosted investor confidence and driven share prices higher. This wave of optimism is being fueled by both internal economic signals and an improving global environment, including stabilized interest rates and signs of a business rebound.
What's Driving the Growth?
One of the primary catalysts behind the rally is recent economic data showing a slowdown in inflation across the eurozone, alongside a revival in consumer demand. These indicators have strengthened expectations that the European Central Bank may soon pivot from a tight monetary stance to a more accommodative approach. Investors have welcomed these signals as evidence that the regional economy is adjusting well to challenging conditions and avoiding a deeper downturn.
Additionally, stronger-than-expected quarterly earnings reports have played a key role in lifting stock prices, particularly in the banking, technology, and industrial sectors. Major players such as Siemens, BNP Paribas, and SAP have posted solid gains, reflecting broader confidence in corporate resilience.
Renewed Investor Interest in Europe
Improving macroeconomic indicators are drawing renewed attention to European assets. With risks appearing more contained and equity yields remaining attractive, many investors are beginning to view the region as a compelling opportunity. Stock exchanges in Germany, France, and the Netherlands have stood out, showing consistent growth and high trading volumes.
Geopolitical factors are also contributing to the market’s upbeat tone. Gradual normalization of trade relations with key partners and the strengthening of the euro on foreign exchange markets are adding to investor enthusiasm.
What’s Next?
Analysts suggest that if current trends continue, European indices could reach new yearly highs. Key factors to watch in the near term include upcoming central bank decisions and fresh data on GDP growth and employment. Nevertheless, the present sentiment points toward confidence in the ongoing recovery.
Conclusion
The European stock market is entering a phase of stable growth, driven by favorable economic indicators, manageable inflation, and an improving business climate. Positive news continues to give investors reasons for optimism, and if momentum holds, Europe could emerge as one of the top-performing investment regions in the coming months.
Community ideas

Impatience Tax in Trading: The Costs of Clicking Too SoonHave you ever thought that maybe some of your losses don’t come from bad trades? Rather, they come from good trades, timed badly?
You see the setup, the signal’s almost there, the MACD is leaning in, the candle is flirting with support — and boom, you click. Early. Too early.
Price dips a bit more and then shoots upward like a rocket. Your stop gets triggered — you just paid the impatience tax.
Welcome to the place where you get taxed for being impatient — a very real, very expensive fee traders pay when their fingers move faster than their reasoning.
🤫 The Impatience Tax — A Silent Killer Dressed as Urgency
The impatience tax doesn’t appear on your statement. You won’t see it listed in your commissions, or under slippage, or labeled in red ink like a realized loss. But rest assured, it’s there — nibbling away at your P&L every time you front-run your own strategy.
And the worst part? It feels productive. You’re taking initiative, showing conviction, being bold. Except what you're really doing is lighting good setups on fire because you couldn’t wait for one more candle to close.
🧬 The Anatomy of an Early Click
Here’s how it usually goes:
You spot a setup.
You get excited.
You skip the checklist.
You enter on the 3rd candle instead of the 5th.
The market fakes out.
You get stopped out.
The market then does exactly what you expected — without you.
Every trader has lived this story. And it hurts more than a loss from a bad trade. Because this wasn’t a bad idea. It was a good idea butchered by bad timing.
🤝 Impatience Loves Company (And Volatility)
Impatience tends to thrive in fast markets. When the price is moving, you feel like you need to act. You notice some breaking news that moves markets, charts start to jiggle and tickers flash — suddenly your FOMO glands kick in.
You’re not waiting for confirmation. You’re reacting — to price, to emotion, to fear of missing out.
It’s not just beginners either. Even seasoned traders occasionally get sucked in. Why? Because the brain is wired to avoid missing opportunities more than it’s wired to avoid losses. We want in. Now. Before it's “too late.”
But here’s a pro secret: the markets tend to always give second chances. You just have to be around to take them.
⏰ Why the Best Traders Wait
Let’s talk about patience. Not the zen-monk, meditate-in-a-cave-for-years kind. The market kind.
The kind that says: “Nope, not yet.”
The kind that closes the platform until the London session starts.
The kind that lets a trade go because it didn’t meet all the criteria — even if it was close.
Top traders aren’t paid for activity. They’re paid for precision. The entry is 90% of the battle. If you win there, the rest is just management.
🧐 How to Identify an Impatience Habit
Want to know if you’re paying the impatience tax regularly? Try this:
Look at your last 10 triggered stop loss orders: How many were within a few ticks of reversal?
Count your trades per day: Are you averaging more than your strategy demands?
Review your entry notes: Did you say things like “close enough” or “looks good”?
If the answer is yes, you’re a tax-paying member of the Impatience Society.
👷♂️ Build a Buffer: Taming the Trigger Finger
So how do you stop paying the Impatience Tax?
Start with structure:
Use time-based confirmations. Wait for the candle to close. A candle halfway formed is a lie detector test mid-question.
Have a rule-based checklist. If a trade doesn’t meet every item, you don’t take it. No exceptions.
Use alerts , not entries. Let the price come to you. Your job is to hunt, not chase.
Trade fewer setups, better. Less is more when each trade has meaning and clarity.
And when in doubt? Wait. The worst that happens is you miss one trade. The best that happens is you finally stop losing money edge by edge.
💵 Impatience Is Expensive. Patience Is Profitable.
The market is designed to reward discipline, not urgency. Speed might help you scalp news reactions, but even that requires planned execution. Unchecked impatience is just impulse with a brokerage account.
It's important to always remember that you’re not trying to win this trade. You’re trying to win this game for the long run.
And winning the game means surviving long enough to let your edge play out — with patience, not panic.
💎 Final Thoughts: Don’t Confuse Action with Progress
The financial markets are a cruel place for dopamine seekers. They offer constant motion, flashing lights, and infinite temptation to click before thinking.
But progress isn’t about how many trades you take — it’s about how many good ones you wait for.
So next time your mouse finger twitches, ask yourself: Is this the plan? Or is this impatience disguised as opportunity seeking instant gratification?
Because every early click is a donation to someone else’s P&L.
👉 Your turn : What’s your best (or worst) story of jumping the gun? How have you built patience into your process — or are you still wrestling with the trigger? Let us know in the comments!

Why Gold Is Pulling Back Now – May 2025 Update⚡️After surging above $3,500/oz in late April, gold has since declined over 8%, recently breaking below key levels and now trading near $3,210. The retracement reflects fading panic buying and growing attention to fundamental drivers: U.S. monetary policy, the strong dollar, easing geopolitical risks, and completed trade agreements. Here’s a breakdown of the leading catalysts and their current impact (ranked 0–10).
1. Fed “Higher for Longer” Bias Strength: 9/10 The Fed kept interest rates at 4.25–4.50% at its June policy meeting and reiterated its cautious stance. The absence of cuts combined with persistent inflation pressure is lifting real yields and undercutting gold’s appeal as a non-yielding asset.
2. U.S. Dollar Resurgence Strength: 8/10The U.S. Dollar Index (DXY) has climbed above 101 as investors digest the Fed’s hawkish tone. A stronger dollar reduces global gold demand, especially from non-USD buyers.
3. U.S.–China Trade Agreement Reached in Switzerland Strength: 7.5/10 A formal trade deal was announced in Geneva in May, easing longstanding tariff tensions. While specific tariff rollback details are pending, markets welcomed the de-escalation, pushing investors away from gold and into risk assets.
4. U.S.–U.K. Trade Deal Signed Strength: 7/10 The U.S. and U.K. finalized a bilateral trade agreement in early May, boosting global sentiment and further reducing the geopolitical premium priced into gold.
5. India–Pakistan Border De-escalation Strength: 6.5/10 After brief clashes in Kashmir in mid-May, both sides have since released statements of restraint. The calm has helped cap gold’s safe-haven bids.
6. Iran–U.S. Nuclear Talks Update Strength: 6/10 Talks resumed in Vienna in May with cautious optimism. While no concrete deal has been signed, progress and diplomatic language from both sides have eased fears of escalation.
7. Russia–Ukraine Ceasefire Developments Strength: 5.5/10 Localized ceasefires in eastern Ukraine, brokered by Turkey and the UN, have lowered near-term geopolitical risk. However, skepticism remains around long-term stability.
8. ETF Inflows & Institutional Demand Strength: 5/10 ETF inflows slowed in May (up just 48.2 tonnes), reflecting waning retail momentum. Still, central bank buying—especially from China—offers a medium-term cushion.
Catalyst Strength Rankings (May 2025)
🔸Fed “higher for longer” bias 9
🔸U.S. dollar rebound 8
🔸U.S.–China trade agreement 5.5
🔸U.S.–U.K. trade deal signed 5
🔸India–Pakistan border easing 6.5
🔸Iran–U.S. nuclear diplomacy 6
🔸Russia–Ukraine ceasefire 5.5
🔸Global gold ETF & central-bank inflows 5
Where Next for Gold?
⚡️Current price: ~$3,210/oz
📉Recent support levels broken: $3,300 and $3,250
🎯Next technical floor: $3,150/oz
✨Upside triggers: Renewed dollar weakness, inflation surprise, or geopolitical flare-up
Gold’s recent drop reflects the market's rotation out of fear-driven trades into yield-bearing and risk assets. While the Fed and the dollar remain dominant forces, any shock—whether geopolitical or inflationary—could quickly reignite interest in gold as a hedge.

3 Deadly Trading Mistakes Every Trader Must Avoid NowDid you know that over 70% of trading decisions are influenced by unconscious emotions?
Fear of missing out (FOMO), greed, and external noise can easily steer traders away from rational decision-making. In this analysis, we explore the three most destructive psychological traps in trading—and how to effectively manage them.
Hello✌
Spend 3 minutes ⏰ reading this educational material. The main points are summarized in 3 clear lines at the end
🎯 Analytical Insight on Bitcoin: A Personal Perspective:
Bitcoin has recently established multiple daily resistance levels and has now executed a strong breakout above its long-standing descending channel. This move is backed by a significant increase in buying volume, signaling renewed bullish momentum. From a short-term perspective, I anticipate at least a 6% upside, with a target around the $110,000 zone. 📊🚀
Now , let's dive into the educational section,
1. Fear of Missing Out (FOMO): A Dangerous Impulse
FOMO can easily lead traders to make hasty decisions based on market hype or emotional reactions, rather than solid analysis. This often results in entering trades at the wrong time, chasing price movements, and ultimately suffering losses. 😟
How to Avoid It:
To manage FOMO, establish a well-defined trading strategy. Stick to your plan and avoid reacting to every market move. Focus on your predefined entry points, and resist the urge to "catch up" with the market. 📊
2. Greed and Its Impact on Decision-Making
Greed can cloud a trader's judgment, leading them to hold on to losing positions with the hope that prices will reverse. Alternatively, greed may push traders to enter positions at overextended price levels, anticipating further gains. This often results in greater losses or missed opportunities. 💸
How to Overcome It:
A clear risk management plan is essential. Set stop-loss and take-profit levels before entering any trade. By adhering to these boundaries, you can reduce emotional decision-making and improve the consistency of your trading approach. 📉
3. The Influence of Social Media on Trading Decisions
In today’s digital age, social media platforms are filled with opinions, rumors, and market hype that can lead traders astray. Often, unverified information or exaggerated claims can prompt traders to make impulsive decisions that don’t align with their strategies. 📱
How to Counteract It:
To combat the impact of social media, rely on credible sources of information. Always perform your own analysis and make decisions based on reliable data, not speculative posts. Surround yourself with professionals and resources that help you stay objective. 📚
Using TradingView Tools to Control Emotional Biases
One of the most effective ways to keep your emotions in check is to rely on objective technical indicators. Tools like RSI, MACD, and Bollinger Bands on TradingView can help you identify entry and exit points that align with your strategy rather than reacting to emotion. 📈
By incorporating trendlines, support/resistance levels, and alerts, you can stay disciplined and make decisions that are grounded in technical analysis. These tools guide you in staying on track, even when emotions run high.
The Vital Role of a Trading Plan
A well-structured trading plan is your shield against emotional trading. It provides clear guidelines on when to enter and exit trades, how much risk to take, and sets your financial goals. Without a plan, it’s easy to fall into the trap of impulsive decisions driven by fear or greed. 📝
How to Create One:
Define your strategy, risk management rules, and long-term objectives. A solid trading plan helps you stay focused, prioritize your financial goals, and avoid emotional disruptions. Sticking to it is crucial for sustainable success in the markets.
Conclusion : Mastering Trading Psychology for Long-Term Success
Psychological discipline is just as important as technical skills when it comes to successful trading. By understanding the emotional pitfalls that can cloud your judgment, you can make more rational, data-driven decisions. 📊
Using tools, sticking to your plan, and consistently managing your emotions are key to overcoming psychological barriers. With the right mindset and strategy, you’ll be better positioned to achieve your trading goals and build long-term success. 🚀
However , this analysis should be seen as a personal viewpoint, not as financial advice ⚠️. The crypto market carries high risks 📉, so always conduct your own research before making investment decisions. That being said, please take note of the disclaimer section at the bottom of each post for further details 📜✅.
🧨 Our team's main opinion is: 🧨
Over 70% of trading decisions are influenced by unconscious emotions, with FOMO, greed, and social media noise being major psychological pitfalls. These emotional biases can lead to impulsive decisions, resulting in losses. To avoid this, create a solid trading plan, use reliable tools like RSI, MACD, and Bollinger Bands, and stay disciplined with stop-loss and take-profit levels. 📉
Give me some energy !!
✨We invest countless hours researching opportunities and crafting valuable ideas. Your support means the world to us! If you have any questions, feel free to drop them in the comment box.
Cheers, Mad Whale. 🐋

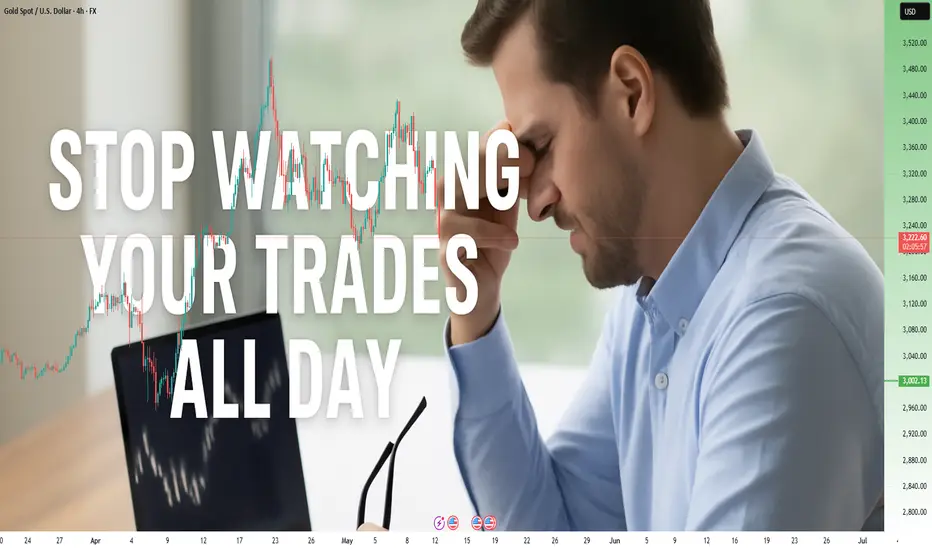
Stop Watching Your Trades All Day!How to Break Free from Screen Addiction and Become a More Focused, Profitable Trader
Have you ever found yourself glued to your screens, watching every tick of the market, feeling your stress levels spike with every price fluctuation?
If so, you’re not alone.
Most traders, at some point, fall into this trap.
It feels productive, even necessary, to monitor your trades constantly.
But the reality is that it’s one of the most damaging habits you can develop.
In this article, I’ll show you why this behavior is hurting your trading results and how to break free from it, so you can trade smarter, stress less, and live more.
________________________________________
⚠️ The Cortisol Trap – Why Watching Every Tick is a Psychological Minefield
Every time you check the market and see a fluctuation in your trades, your body releases cortisol, the primary stress hormone.
While cortisol is useful in fight-or-flight situations (like dodging a car on the street), it’s terrible for trading.
Here’s why:
• Cortisol reduces rational thinking – It pushes your brain into reactive mode, not analytical mode.
• It triggers impulsivity – You become more likely to close winning trades too early or move your stop loss in desperation.
• It burns your mental energy – Leaving you drained, unfocused, and emotionally volatile.
Simply put: Too much screen time = too much cortisol = bad trading decisions.
If you want to win consistently, you need to break this cycle.
________________________________________
🎯 Distraction from Higher Priorities – Why Trading Should Be a Part of Life, Not All of It
Trading is meant to give you freedom — not steal it.
Yet, too many traders become slaves to the screen, obsessing over every tick.
But here’s the truth:
You don’t need to be in front of your screen all day to be a great trader.
In fact, doing so can rob you of the mental clarity and emotional balance needed for high-quality trading.
When you step away from the charts:
• You give your strategic mind time to work,
• You focus on other important aspects of life — family, health, personal growth,
• You develop a longer-term perspective on the market, which is crucial for real success.
Balance is the key to sustainable success, both in trading and in life.
________________________________________
✅ 3 Benefits of Breaking Free from Screen Addiction
✅ Benefit #1: Better Decision-Making
When you stop reacting to every tick:
• You make calmer, more rational trading decisions,
• You avoid low-probability setups and revenge trading,
• You focus on quality over quantity.
Instead of jumping on every tiny move, you become a strategic sniper in the market, waiting for high-probability setups.
________________________________________
🧘 Benefit #2: Improved Quality of Life
Life is not just about trading.
Reducing screen time frees you up for other meaningful activities:
• Exercise,
• Hobbies,
• Time with family and friends.
A well-rounded life supports better mental health, which, in turn, improves your trading performance.
Remember, a clear mind is a profitable mind.
________________________________________
⏱️ Benefit #3: Increased Productivity
Believe it or not, less screen time = more productivity.
Why?
Because you’ll:
• Spend less time reacting and more time preparing,
• Conserve your mental energy for important decisions,
• Create time for deep market analysis instead of random impulse trades.
This disciplined approach leads to better trading outcomes over time.
________________________________________
🔔 How to Trade with Less Screen Time – 3 Practical Step s
🔔 Action #1: Use Alerts Wisely
Instead of staring at charts all day, let technology work for you:
• Set alerts at key price levels,
• Use trading apps to get notifications when your levels are hit,
• Let the market come to you — not the other way around.
Example: If you want to buy Gold at 3200 support, set an alert and go for a walk.
You’ll be notified when price approaches, so you can act, not react.
________________________________________
📅 Action #2: Create a Balanced Schedule
Build a daily routine that includes more than just trading:
• Morning exercise,
• Reading or journaling,
• Spending time with loved ones,
• Working on long-term goals.
When you’re mentally balanced, you’ll trade better and more profitably.
________________________________________
📊 Action #3: Review Your Trading Plan Regularly
Spend time reviewing your trades instead of watching them:
• Look at your journal,
• Analyze your stats,
• Identify mistakes and strengths.
This should only take once a week — and it’s far more valuable than hours of pointless screen time.
________________________________________
🧠 Final Words
As the saying goes:
“Sometimes, less is more.”
Stop watching your trades all day.
Lower your stress, regain your focus, and remember why you started trading in the first place — to build wealth and live freely, not to become a slave to the screen.
Trade well.
Build wealth.
Live fully. 🚀
Disclosure: I am part of Trade Nation's Influencer program and receive a monthly fee for using their TradingView charts in my analyses and educational articles.
Golden Rejection Candle Strategy–Catch Explosive Intraday Moves!Hello Trader!
Are you tired of buying options and watching premiums die slowly?
Or chasing breakouts that reverse the moment you enter?
Here’s your solution – the Golden Rejection Candle Strategy , designed especially for option buyers who want timed entries, fast momentum, and defined risk .
What is a Golden Rejection Candle?
A special candlestick that forms when price hits a strong level (like VWAP, trendline, or demand/supply zone) and gets instantly rejected.
It leaves behind a long wick (shadow), showing that buyers or sellers stepped in with force .
This candle often marks the start of a sharp intraday reversal .
It's not just a random wick — it’s a smart money footprint .
Live Chart Example – Nifty Spot vs Option Premium (23950 CE)
Date: 9th May 2025
Timeframe: 1 min (Spot), 1 min (Options)
Spot Chart Setup: Nifty approached a marked green support zone and created a strong wick rejection with a small body candle — classic sign of buyers defending the level.
Confirmation Candle: The next candle broke above the rejection candle’s high, confirming the reversal setup.
Premium Reaction: On the 1-min ATM Option chart (23950 CE), premiums jumped from 270 to 344 – a clean 26% gain within few minutes.
Risk-Reward Snapshot: Entry was at breakout, SL just below rejection wick, and target hit in a single momentum burst — the kind of move option buyers live for.
How to Trade It as an Option Buyer
Choose the Right Strike: Use ATM or slightly ITM options to get faster movement when price reverses.
Entry Strategy: Wait for the next candle to break the rejection candle’s high/low. No break = No trade.
SL Placement: Keep it just beyond the wick. Small loss if wrong, big reward if right.
Exit Plan: Aim for intraday resistance/support or spike-based exits — option premiums often give quick moves post-rejection.
What NOT to Do:
Don’t enter on the rejection candle itself — wait for confirmation.
Avoid trading this pattern in low volume or middle of the range.
Don’t hold blindly — if premium spikes, take the money and run!
Rahul’s Tip:
“Sudden reversals are where option buyers make money — not slow trends. The rejection candle shows intent. The breakout shows confirmation. Combine both.”
Conclusion:
The Golden Rejection Candle Strategy gives you an edge that most random trades lack — timing, context, and structure.
If you're an option buyer, this can be your go-to setup to avoid traps and enter only when smart money steps in.
No more guessing. No more fear.
Just clean, price-action-based entries that make sense.
👇 Have you ever used rejection-based setups? Drop your favorite trade below! Let’s learn together.
If you found this post valuable, don't forget to LIKE and FOLLOW!
I regularly share real-world trading setups, actionable strategies, and learning-focused content — all from real trading experience , not theory . Stay connected if you're serious about growing as a trader!

Capital First: The Golden Rule of TradingTrading is your business. And the most important rule in any business is this: don’t blow all your money. Always protect your capital — it’s the most valuable thing you have. You don’t want to be a baker without any bread, right?
In trading, capital preservation comes first. Making money is secondary.
1. Always use stop losses.
2. Don’t add margin if your account is underfunded.
A margin call is a clear signal that everything you’ve been doing up to this point was wrong. The worst thing you can do is keep doubling down on bad decisions. Stop. Take a break — a month, a year if needed.
3. Analyze your actions and their consequences.
4. Know your stats.
Numbers will tell you, honestly and without emotion, what kind of trader you really are and where your business is headed.

Why You Need to Know How the Markets Work Before TradingMany new traders jump into forex driven by excitement, but without a real grasp of how financial markets work. I know this because I did the same, and spent years trying to correct it.
When I first entered the forex market, it felt accessible, fast-moving, and flexible. The 24-hour trading cycle made it seem like an ideal fit. But what I didn’t realize was that trading success isn’t built on convenience. It’s built on understanding.
Knowing how the markets work isn’t just a nice-to-have — it’s foundational. Financial markets don’t exist in isolation. The forex market, for example, doesn’t move without being influenced by interest rates, global economic indicators, and even other markets like bonds or commodities. I didn’t understand this at first. I thought forex was self-contained — just charts, price action, and maybe some indicators. It’s not.
Over time, I started noticing patterns. Not just in price movement, but in my own behavior. I’d react emotionally, enter impulsive trades, or avoid certain setups because I didn’t really trust what I was doing. The missing piece was a true understanding of the broader market structure.
It’s also important to separate the idea of trading from investing. I used to think they were the same thing. They're not. Investing, to me, means long-term value holding. Trading is shorter-term speculation. Without understanding this difference, it's easy to misapply strategies meant for one into the other.
I also misunderstood the tools. At first, I avoided the stock market entirely because I didn’t know you could short stocks. I avoided options, bonds, and futures because they seemed too complicated. That lack of knowledge wasn’t just limiting — it shaped my entire trading path.
If I had taken the time early on to explore how the markets work — including what kinds of financial instruments are out there and how they behave — I would have made far more informed decisions. I would have known which tools fit my mindset, risk tolerance, and time commitment.
Today, I’m still trading forex, but with a calmer, more methodical mindset. I’ve accepted that trading requires a clear plan, an understanding of market context, and constant self-reflection. I’m no longer chasing excitement — I’m aiming for consistency.
If you’re just getting started, or if you feel stuck, pause and ask yourself: Do I truly understand how the markets function? Not just the one I’m trading in, but the financial ecosystem as a whole? The answer might change your entire approach — and that shift can be what helps you move from confusion to clarity.

Are You Using Technical Indicators All Wrong?Most indicators aren’t broken. Most traders use them wrong.
Thousands of traders rely on RSI, MACD, and moving averages — and most of them still lose money. Why? Because they use tools the wrong way, in the wrong context, with the wrong mindset.
Let’s break it down:
1. Indicators don’t predict — they react.
RSI hitting 30 doesn’t mean “buy”. It means selling pressure dominated recently.
2. One tool ≠ one strategy.
MACD or CCI alone won’t build you a system. Context, confluence, and confirmation matter.
3. Emotional confirmation kills discipline.
Seeing RSI 70 after price moves doesn’t mean you’re late. It means your emotions want to join the move — not your logic.
🚨 Solution?
Use indicators as filters, not triggers.
Build rules. Track what works. Trade the system — not your excitement.
Want to see more posts like this? Let us know — We're preparing a series of deep-dives into indicator psychology and structure.

Learn the 4 Best Strategies to Maximize Your Profits in Trading
In the today's article, we will discuss 4 classic yet profitable forex and gold trading strategies.
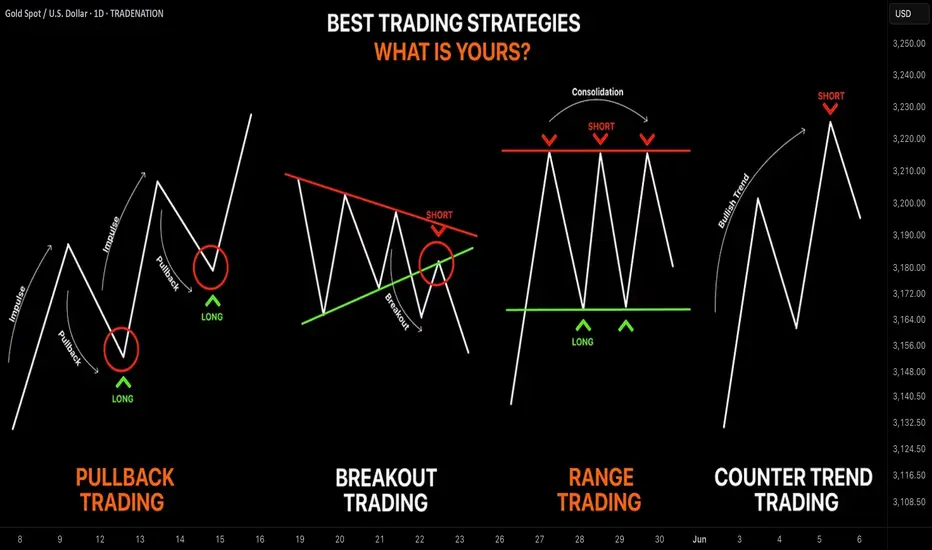
1️⃣Pullback Trading
Pullback trading is a trend-following strategy where you open the positions after pullbacks.
If the market is trading in a bullish trend, your goal as a pullback trader is to wait for a completion of a bullish impulse and then let the market correct itself. Your entry should be the assumed completion point of a correctional movement. You expect a trend-following movement from there.
In a bearish trend, you wait for a completion of the bearish impulse, let the market retrace, and you look for short-entry after a completion of the retracement leg.
Here is the example of pullback trading.
On the left chart, we see the market that is trading in a bearish trend.
A pullback trader would short the market upon completion of the correctional moves.
On the right chart, I underlined the buy entry points of a pullback trader.
That strategy is considered to be one of the simplest and profitable and appropriate for newbie traders.
2️⃣Breakout Trading
Breakout trading implies buying or selling the breakout of a horizontal structure or a trend line.
If the price breaks a key support, it signifies a strong bearish pressure.
Such a violation will trigger a bearish continuation with a high probability.
Alternatively, a bullish breakout of a key resistance is a sign of strength of the buyers and indicates a highly probable bullish continuation.
Take a look, how the price broke a key daily resistance on a daily time frame. After a breakout, the market retested the broken structure that turned into a support. A strong bullish rally initiated from that.
With the breakout trading, the best entries are always on a retest of a broken structure.
3️⃣Range Trading
Range trading signifies trading the market that is consolidating .
Most of the time, the market consolidates within the horizontal ranges.
The boundaries of the range may provide safe points to buy and sell the market from.
The upper boundary of the range is usually a strong resistance and one may look for shorting opportunities from there,
while the lower boundary of the range is a safe place to buy the market from.
EURCAD pair is trading within a horizontal range on a daily.
The support of the range is a safe zone to buy the market from.
A bullish movement is anticipated to the resistance of the range from there.
Taking into considerations, that the financial instruments may consolidate for days, weeks and even months, range trading may provide substantial gains.
4️⃣Counter Trend Trading
Counter trend trading signifies trading against the trend.
No matter how strong is the trend, the markets always trade in zig-zags. After impulses follow the corrections , and after the corrections follow the impulses.
Counter trend traders looks for a completion of the bullish impulses in a bullish trend to short the market, and for a completion of bearish impulses in a downtrend to buy it.
Here is the example of a counter trend trade.
EURJPY is trading in a bullish trend. However, the last 3 bearish moves initiated from a rising trend line. For a trader, shorting the trend line was a perfect entry to catch a bearish move.
Such trading strategy is considered to be one of the most complicated , because one goes against the crowd and overall sentiment.
With the experience, traders may combine these strategies.
❤️Please, support my work with like, thank you!❤️
I am part of Trade Nation's Influencer program and receive a monthly fee for using their TradingView charts in my analysis.
RSI 101: The Secret of RSI’s WMA45 Line and How to Use ItIn my trading method, I use the WMA45 line together with RSI to help spot the trend more clearly.
Today, I’ll share with you how it works and how to apply it — whether you're doing scalping or swing trading.
Why WMA45?
WMA (Weighted Moving Average) is a type of moving average where recent prices are given more importance.
WMA45 simply means it takes the average of the last 45 candles (could be 45 minutes, 45 hours, or 45 days depending on your chart).
Because it moves slower than RSI, it helps reduce the “noise” and gives you a better idea of the real trend.
This idea is not new — many traders have tested RSI strategies also use this line. I just applied and adjusted it in my own way.
👉 How to set it up on TradingView (very simple):
What WMA45 Tells You
Trending
This line shows you the overall direction of the market:
📉 If WMA45 is going down, the price is likely going down.
📈 If WMA45 is going up, the price is likely going up.
Also, the steeper the line, the stronger the trend is:
Looking at the example above, the WMA45 line starts from the same level in two different phases, but the slope is different. The steeper line shows a larger price range.
This happens because the price was more volatile, which caused the RSI to move more sharply, and that, in turn, made the WMA45 slope steeper.
In multi-timeframe analysis, when the trend on the higher timeframe is strong (shown by a steep WMA45 line), the RSI on the lower timeframe will usually move within a tighter range and react more accurately to key levels.
If you’re not sure what these key RSI levels are, check out my previous post here:
For example, in a strong downtrend on H1, RSI on M5 might not even reach 50:
✅ What does this mean for trading?
Use WMA45 on higher timeframes to define trend bias.
On lower timeframes, watch RSI responses at key zones for optimal entries.
When holding positions, WMA45 helps determine whether to stay in the trade.
Moving Sideways
Here’s something important to note: when WMA45 is flat, RSI will keep crossing back and forth over it.
Depending on where WMA45 is flat, RSI tends to move within that range and creates different sideways price patterns. Here are the main types:
Around 50 → price moves in a box: According to RSI theory, the 50 level is the balance between buyers and sellers. RSI fluctuating around this causes price to move sideways in a rectangular box range.
Above 50 → price goes up in a rising channel: Above 50 is where buyers dominate sellers. RSI operating in this zone will continually create bullish candles pushing the price upward.
Below 50 → price goes down in a falling channel: Below 50 is where sellers dominate buyers. RSI in this zone will consistently form lower highs and lower lows, pushing the price downward.
Trend Reversal of WMA45
WMA45 is calculated from the average of 45 candles, so it's almost impossible for it to reverse direction suddenly. When it's sloping (trending), it takes time for RSI to fluctuate enough to "flatten" it before it can reverse.
As shown in the example, after WMA45 slopes up, before it turns downward, RSI must cross back and forth through it to reduce the steepness => flatten it => then reverse.
Does this align with Dow Theory? It represents the phases: Trend > Sideway > Trend. Sideway is when the WMA45 line is flattened.
✅ What does this mean for trading?
After a trend forms, if you want to enter a counter-trend trade, patiently wait for WMA45 to flatten to confirm the previous trend has ended.
Dynamic Support and Resistance
In addition to being a trend indicator for RSI, WMA45 also serves as a dynamic support/resistance level for RSI.
You will often observe RSI reacting when it encounters the WMA45 line.
In an uptrend, WMA45 acts as support for RSI.
In a downtrend, WMA45 acts as resistance for RSI.
Notably, if the reactions occur at higher RSI values, the resulting price support is stronger. Conversely, if reactions happen at lower RSI values, the price is pushed down further.
In the above example, in the first reaction around RSI 60s, RSI dropped by 9.6 points and price dropped by 12 points. In the second reaction at RSI 40s, RSI dropped similarly, but the price dropped by 25 points.
✅ What does this mean for trading?
You can use WMA45 as an entry zone for your trade: Wait for reactions with WMA45 on the higher timeframe, then switch to a lower timeframe to find a trade entry.
Use WMA45 as a take-profit or stop-loss level: For a short trade near WMA45, you can stop out if RSI crosses above it.
When monitoring these reactions, pay attention to the number of reactions—more reactions require more caution in trading.
Some Trade Setups Using WMA45 and RSI
1. Intraday trading
Trend: Follow the trend on the H1 chart.
Entry zone: At WMA45 of H1.
Entry confirmation: 2 methods:
On M5: when WMA45 of RSI is already flattened, and RSI has crossed above WMA45.
On M5: when a divergence appears in RSI.
2. Scalping
With the RSI’s reaction to WMA45, even on smaller timeframes (M1, M5), you can scalp when RSI touches WMA45.
When WMA45 has a slope and RSI returns to touch it, you can enter a trade with SL behind the candle close (10–20 pips to avoid stop hunts and spread), and TP to the nearest peak.
As mentioned, the first touch gives the best reaction.
My trading system is entirely based on RSI, feel free to follow me for technical analysis and discussions using RSI.

You want to be a trader but you have a 9-5 Educational purpose only. You want to be a day trader but can't trade market open because you have a job or you are too busy. The daily bar can give you just as much profits as the 5 min charts. In this video ill teach you how to find support and resistance zone on any market. Opening a line chart starting from the weekly and then looking for areas where price has repeatedly reverse gives you a clue of where price may go in the future on a daily chart. Watch till the end to see how this strategy is applied to all markets.

7 reasons why people may still struggle to make money in crypto Why people may still struggle to make money in #crypto
1. ** #Market Volatility**
- The cryptocurrency market is highly volatile, with prices fluctuating dramatically. This can lead to significant losses if investments are not timed well.
2. **Lack of Information**
- Insufficient information can hinder investment decisions, making it difficult to identify profitable opportunities.
3. **Fraud and Scams**
- The crypto space is rife with scams and fraudulent schemes. It's crucial to be able to distinguish between legitimate projects and scams.
4. **Lack of Long-term Perspective**
- Many investors focus on short-term gains, which can lead to impulsive decisions and losses, rather than holding for the long term.
5. **Emotional Trading**
- Emotional reactions to market changes can lead to poor decision-making, such as panic selling or chasing after trends.
6. **Regulatory Uncertainty**
- Ongoing regulatory changes can impact the market and create uncertainty, affecting investment strategies.
7. **High Transaction Fees**
- Transaction fees can eat into profits, especially for smaller trades.
Conclusion
Investing in cryptocurrency requires careful research, a clear strategy, and an understanding of the risks involved.

Support and Resistance Levels: A Beginner Trader's GuideSupport and Resistance Levels: A Beginner Trader's Guide
Hello!
If you’re just starting your journey in trading, you’ve probably already heard about "support" and "resistance." These terms might sound intimidating, but their essence is simple. Think of an asset’s price as a ball bouncing between a floor and a ceiling. The floor is support , and the ceiling is resistance . Let’s break down how this works and how to use these levels in your trading.
1. What Are Support and Resistance?
- Support is a price level where buyers (bulls) are strong enough to halt a decline.
→ Example: Suppose the GBP/USD price drops to resistance line multiple times but bounces back each time. This line is a strong support level.
- Resistance is a level where sellers (bears) take control, preventing the price from rising further.
Why is this important?
These levels help you anticipate where the price might reverse or continue moving. They’re like road signs on your chart!
2. How to Identify Support and Resistance on a Chart
Start by analyzing price history. Support and resistance levels form where the price has repeatedly stalled.
- Step 1: Open a daily or hourly chart . The larger the timeframe, the more significant the level.
- Step 2: Look for points where the price reversed . For example, lows (for support) and highs (for resistance).
- Step 3: Draw horizontal lines through these points.
→ Visual Example:
On the GBP/USD chart, the price tested the level multiple times and bounced. This is clear support. The resistance level, where upward momentum stalled, acts as resistance.
3. How to Trade Using Support and Resistance
There are two main scenarios: *bouncing off a level* and *breaking through a level*.
Scenario 1: Bouncing Off Support or Resistance
- If the price approaches support, consider opening a long position (buying), expecting a rebound.
- If the price nears resistance, consider opening a short position (selling), anticipating a drop.
Scenario 2: Breaking Through a Level
If the price breaks support or resistance with high volume, it’s a signal to act:
- Breaking resistance → Buy.
- Breaking support → Sell.
→ Example:
GBP/USD breaks above resistance at 2.01050. You enter a short position, placing a stop-loss below 2.04040 order-block.
4. Common Beginner Mistakes to Avoid
- Overloading the chart with lines . Don’t mark every minor swing—focus on key levels.
- Ignoring volume . A breakout without increasing volume is often a false signal.
- Impatience . The price may test a level repeatedly—wait for confirmation before trading.
5. Practice Is the Key to Success
1. Study historical data . Open past charts and practice identifying levels retrospectively.
2. Use a demo account . Test your strategies risk-free.
3. Keep a trading journal . Note why you chose specific levels and analyze your mistakes.
6.Conclusion
Support and resistance levels are your best allies in trading. They reveal market structure and guide your decisions. Don’t get discouraged if it feels challenging at first—practice will sharpen your intuition. Remember, even professionals make mistakes. Focus on risk management and continuous learning.
Good luck! You’ve got this!

Fibonacci Extensions: Mapping Market Psychology Beyond the TrendHello, traders! 💫
Fibonacci numbers have traveled far from ancient Italian math to modern trading charts. In technical analysis, Fibonacci Extensions aren’t just mystical ratios; they’re a structured way to project potential price targets based on crowd psychology and trend continuation.
But what are they really, and why do so many traders draw those lines with near-religious fervor?
🧠 A Quick Historical Detour
Leonardo Fibonacci introduced the sequence to the West in the 13th century based on patterns he observed in Indian mathematics. The key idea is that each number in the sequence is the sum of the two before it: 1, 1, 2, 3, 5, 8, 13, 21...
When you divide specific numbers in the sequence, you get ratios that repeat throughout nature — and, intriguingly, financial markets. These include:
0.618 (the “golden ratio”)
1.618
2.618, and so on.
While Fibonacci Retracements look backward to gauge potential pullbacks, Fibonacci Extensions look forward to mapping possible continuation levels after a price move.
📊 Fibonacci Extensions
To use Fibonacci Extensions, you need three points:
The Start of a Trend (Point A)
The End of the Trend or Impulse Move (Point B)
A Retracement Low/High Where Price Bounces or Consolidates (Point C)
This ABC move applies Fibonacci ratios to project levels beyond point B, helping traders visualize where the price might go if the trend continues.
Common Extension Levels Include:
1.272
1.618 (golden ratio)
2.0
2.618
Each level acts as a kind of psychological milestone — not a guarantee, but a place where market participants may take profits, reassess, or react.
🔎 Let’s Take a Real Example: BTC/USDT Weekly
It's not that Fibonacci numbers have magical power. The theory is based on self-fulfilling behavior. When enough traders watch the same levels — and act on them — they can influence real outcomes.
The chart illustrates how Fibonacci retracement levels can be used to understand the depth and structure of a correction during a bullish cycle.
Low (~$4,783) in March 2020 (COVID-19 Сrash)
to the High (~$65,834) in November 2021 (Bull Market Peak)
From there, the price corrected throughout 2022–2023. Let’s look at what happened at each level — and what it tells us on the graph.
🔍 Why This Matters
Your retracement levels aren’t just lines — they mapped the psychology of the market:
Investors Testing Conviction at 0.5
Panic at 0.618
Capitulation Near 0.786 — but Without Full Breakdown
And Finally: A Rebound in 2023, Leading to New Highs in 2025
This kind of structure is textbook Fibonacci behavior — and is part of why retracement levels remain a core part of institutional technical analysis.
⚖️ Final Thought
Fibonacci Extensions are not about telling you where the price will go — they’re about framing where the price might go if the current trend keeps moving. It’s a lens through which to read market psychology, momentum, and expectation. Combined with volume, structure, and broader trend context, they potentially help analysts build a more nuanced market narrative.
And maybe Leonardo Fibonacci would have appreciated that his 800-year-old math is still trying to decode modern human emotion, just on candlestick charts.

BTCUSDT 13R Trade Breakdown: Deep Crab Pattern + SMC Precision Hello Traders!
If you enjoyed my previous post on combining Harmonic Patterns with Smart Money Concepts (SMC) for high-precision, high-risk-to-reward trades, then you're going to love this breakdown on BTCUSDT.
If you haven’t checked out my earlier content, make sure to scroll below this post and see that first—it sets the foundation for what we’re diving into here.
📈 BTCUSDT Trade Breakdown: Harmonic x SMC Precision Entry
This analysis was originally shared around three weeks ago on my YouTube channel, and if you were with me live, you’ll remember I was closely watching for a Bullish Deep Crab Pattern to complete before considering a LONG position.
Let’s walk through the setup and outcome step-by-step:
🕰 WEEKLY TIMEFRAME:
Price was reacting to a Weekly Fair Value Gap (FVG) and had filled the imbalance.
As shown in the chart:
🔍 SETUP: Strategy Confirmation
Important Reminder:
Just because price hits a key level doesn’t mean we jump in to buy or sell.
✅ There must be a confirmed Harmonic Pattern that aligns with the key SMC level.
On the Daily Chart, we identified a valid Bullish Deep Crab Pattern:
B-point at 0.886
PRZ (Potential Reversal Zone) at 1.618 FIB Extension
This PRZ aligned perfectly with the key level identified on the Weekly chart.
🎯 ENTRY STRATEGY (15-Minute Chart):
We zoomed into the 15M chart for an SMC-based entry.
Supply-to-demand flip confirmed with a visible liquidity inducement—textbook confirmation.
Entry was just a few pips below the recent swing low to limit downside risk in case of invalidation.
Take Profits (TPs) were set using standard Deep Crab targets, based on FIB retracements from A to D:
✅ TP1 at 0.382
✅ TP2 at 0.618
✅ TP3 at 0.786
✅ TRADE OUTCOME:
Entry was cleanly triggered and the price followed through as expected.
All three profit levels were successfully hit:
✅ TP1
✅ TP2
✅ TP3
We secured an impressive 13R on this single BTCUSDT trade —a solid example of what happens when Harmonics and Smart Money Concepts are aligned.
💬 Your Turn:
Did you take this BTC trade using a different strategy?
Or did you spot the pattern and enter alongside me?
Drop your thoughts and experiences below this analysis—let’s learn together!

Mastering Fair Value Gaps (FVG) - How to use them in trading?In this guide, I’ll explain the concept of the Fair Value Gap (FVG), how it forms, and how you can use it to identify high-probability trading opportunities. You'll learn how to spot FVGs on a chart, understand their significance in price action, and apply a simple strategy to trade them effectively.
What will be explained:
- What is a FVG?
- How can a FVG occur?
- What is a bullish FVG?
- What is a bearish FVG?
- How to trade a FVG?
-------------------------------
What is a FVG?
A FVG is a technical concept used by traders to identify inefficiencies in price movement on a chart. The idea behind a fair value gap is that during periods of strong momentum, price can move so quickly that it leaves behind a "gap" where not all buy and sell orders were able to be executed efficiently. This gap creates an imbalance in the market, which price may later revisit in an attempt to rebalance supply and demand.
A fair value gap is typically observed within a sequence of three candles (or bars). The first candle marks the beginning of a strong move. The second candle shows a significant directional push, either bullish or bearish, often with a long body indicating strong momentum. The third candle continues in the direction of the move, opening and closing beyond the range of the first candle. The fair value gap itself is defined by the price range between the high of the first candle and the low of the third candle (in the case of a bullish move), or between the low of the first candle and the high of the third (in a bearish move). This range represents the area of imbalance or inefficiency.
-------------------------------
How can a FVG occur?
There are several factors that can trigger a fair value gap
- Economic news and announcements
- Earnings reports
- Market sentiment
- Supply and demand imbalances
-------------------------------
What is a bullish FVG?
A bullish FVG is a specific type of price imbalance that occurs during a strong upward move in the market. It represents a zone where the price moved so aggressively to the upside that it didn’t spend time trading through a particular range, essentially skipping over it.
This gap usually forms over the course of three candles. First, a bullish candle marks the beginning of upward momentum. The second candle is also bullish and typically has a large body, indicating strong buying pressure. The third candle opens higher and continues moving upward, confirming the strength of the move. The bullish fair value gap is the price range between the high of the first candle and the low of the third candle. This area is considered an imbalance zone because the market moved too quickly for all buyers and sellers to interact at those prices.
-------------------------------
What is a bearish FVG?
A bearish FVG is a price imbalance that forms during a strong downward move in the market. It occurs when price drops so rapidly that it leaves behind a section on the chart where little to no trading activity happened.
This gap is identified using a three-candle formation. The first candle typically closes bearish or neutral, marking the start of the move. The second candle is strongly bearish, with a long body indicating aggressive selling pressure. The third candle opens lower and continues the move down. The bearish fair value gap is the price range between the low of the first candle and the high of the third candle. That range is considered the imbalance zone, where price skipped over potential trade interactions.
-------------------------------
How to trade a FVG?
To trade a FVG effectively, wait for price to retrace back into the gap after it has formed. The ideal entry point is around the 50% fill of the FVG, as this often represents a balanced level where price is likely to react.
During the retracement, it’s helpful to see if the FVG zone aligns with other key technical areas such as support or resistance levels, Fibonacci retracement levels, or dynamic indicators like moving averages. These additional confluences can strengthen the validity of the zone and increase the probability of a successful trade.
Enter the trade at the 50% level of the FVG, and place your stop loss just below the most recent swing low (for a bullish setup) or swing high (for a bearish one). From there, manage the trade according to your risk-to-reward preferences—whether that’s 1:1, 1:2, or a higher ratio depending on your strategy and market conditions.
-------------------------------
Thanks for your support.
- Make sure to follow me so you don't miss out on the next analysis!
- Drop a like and leave a comment!

GOLD: The Timeless Asset Every Trader Should Master"Empires rise, currencies fall—but Gold never forgets its value."
From ancient temples to central bank vaults, Gold has stood as a pillar of wealth and power. But beyond its glitter lies a dynamic market driven by tradition, emotion, and macroeconomic forces. Today, we explore Gold's deeper story, from its roots to its geopolitical and cultural drivers and why it continues to be one of the most fascinating instruments in the financial world.
🏛️ A Brief History: When Gold Became a Tradable Asset
Gold has been used as money for over 5,000 years, but it became a formal trading instrument in modern financial markets in the 1970s, after the collapse of the Bretton Woods system. This shift allowed Gold to float freely against the US Dollar, opening it up to speculative trading.
Initially dominated by institutions, Gold became accessible to retail traders in the early 2000s, thanks to:
The rise of online trading platforms
The introduction of CFDs (Contracts for Difference)
Brokerages offering leveraged accounts with low capital requirements
📈 Gold was then added to TradingView, empowering global traders with institutional-grade tools to analyze and trade Gold markets in real time.
📍 COMEX vs Spot Gold: What’s the Difference?
Many traders don’t realize they’re looking at two closely related—but different—Gold markets.
🔍 Why it matters:
Spot Gold is what most retail traders buy and sell via brokers. COMEX Gold futures show institutional positioning and often lead the trend during high-volume sessions.
🔁 Pro Tip: Spot Gold (XAU/USD) and COMEX Futures (GC1!) typically move together, but watching both can help spot:
Volume spikes before big moves
Divergences in short-term sentiment
Roll-over or expiration volatility
🧭 Consider charting both together to better understand market dynamics across retail and institutional flows.
China & India: The Powerhouses Behind Physical Demand
Together, India and China account for over 50% of global consumer Gold demand, making their influence enormous, especially during cultural and seasonal peaks.
India: Gold as Religion, Wealth & Legacy
In India, Gold is more than an investment, it’s sacred. It plays a central role in:
Weddings: Millions of marriages occur annually, with families gifting large amounts of Gold.
Festivals: Especially Diwali and Akshaya Tritiya, where buying Gold is seen as auspicious.
Dowries & inheritance: Gold is passed down across generations, reinforcing cultural and financial value.
Gold demand spikes seasonally from September to February, driven by marriage season and religious celebrations, creating bullish tailwinds globally.
China: From Tradition to Strategic Reserve
China, the world’s top Gold producer, is also one of its biggest consumers. Gold plays both a traditional and tactical role:
Cultural: Common gifts for births, weddings, Lunar New Year, and other key events.
Strategic: Used to hedge wealth amid real estate slowdowns, market turbulence, or strict capital controls.
Demand peaks during Lunar New Year (Jan–Feb) and Golden Week (Oct)—key seasonal catalysts in Gold’s annual cycle.
🌍 Seasonal Demand Windows: The Cultural Gold Cycle
Gold’s demand is deeply seasonal due to traditions in China and India:
Jan–Feb: Chinese New Year buying
Aug–Oct: Indian festival prep + wedding season
Nov: Diwali in India
Dec: Global rebalancing, safe-haven inflows
These cycles often precede bullish waves in price, even before macroeconomic news hits the wires.
🧭 What Moves Gold? (Beyond Culture)
Cultural demand isn’t the only force. Gold is influenced by:
📉 Interest rates & inflation
💵 US Dollar strength/weakness
🌍 Geopolitical tension
🏦 Central bank buying (especially from Russia, China, and Turkey)
These macro drivers make Gold both a defensive hedge and a speculative asset.
🏦 Top Global Gold Reserves (2025)
Central banks continue to accumulate Gold, a clear sign of long-term strategic value amid de-dollarization and rising debt.
📈 Long-Term Bullish Outlook: The Golden Momentum
Zooming out on the monthly chart, Gold remains in a long-term bullish momentum considering the factors we have just discussed with continued demand from both East and West.
🔮 Many analysts project a bullish long term continuation, especially if inflation resurges or geopolitical risk intensifies.
🔚 Final Thoughts
Gold is not just a metal, it’s a mirror reflecting culture, history, and human fear. As retail traders, understanding its deep-rooted demand, global influences, and institutional dynamics gives us an edge.
✅ Quick recap:
Gold trading exploded post-1970s and became retail-accessible in the 2000s.
China and India’s seasonal cycles create repeatable opportunities.
Spot vs COMEX adds clarity for traders.
The long-term trend remains bullish with macro support.
💬 How do you use seasonal demand or futures sentiment in your Gold analysis? Drop your thoughts in the comments below.

BTC Bulls vs Bears – Critical Level Tested, What’s Next?🚀📈 BTC Bulls vs Bears – Critical Level Tested, What’s Next? 🐂🐻
Hi everyone! New day, new charts – and once again, our levels played out beautifully! 🎯 The 102,777 zone was the battleground, and after nearly 40 price interactions at that level, the bulls took control. However, all is not settled yet!
We are currently observing multiple divergences across key indicators:
📉 MACD
📉 Histogram
📉 RSI
📉 MOM (Momentum)
📉 MFI
This suggests caution despite the bullish momentum. My expectation is for a retest of the 102,777 level, which remains the key decision point.
Here’s the updated probability outlook:
➡️ 65% chance we push higher toward the next target at 105,962, with sights ultimately set on 113,000.
⬅️ 35% chance we see a rejection and head lower.
Keep an eye on these key levels:
⚔️ 102,777 – The battleground (Bulls vs Bears)
📌 105,962 – Next target
🎯 113,000 – Ultimate target
Before I wrap up, even on the 8-hour chart, there are signs of divergences, so let’s stay sharp and move carefully. Step by step, we’ll navigate this market together!
One Love,
The FXPROFESSOR 💙
ps. WE ARE STAYING LONG! OK?

USA-UK: Trade Agreement and Impact
Hello, I am Trader Andrea Russo and today I want to talk to you about the meeting that will take place today, May 9, 2025, between the USA and the UK. The announcement of a new trade agreement between the United States and the United Kingdom by Donald Trump has immediately attracted the attention of global investors. Its economic scope could have significant repercussions on the main currencies, in particular on the GBP/USD pair.
The components of the agreement and the reactions of the markets
According to initial information, the agreement aims to strengthen trade relations between Washington and London, simplifying regulations on goods and services, reducing duties and incentivizing bilateral investments.
Immediate impact on the pound (GBP)
The GBP/USD pair has shown an initial reaction of volatility, with investors evaluating the details of the new agreement. If the agreement leads to greater economic stability and growth in the United Kingdom, the pound could benefit from a bullish trend in the short term. However, some analysts warn that the pound could suffer from more in-depth negotiations in the future, especially if the deal puts renewed pressure on UK financial markets.
The US dollar and the Fed’s monetary policy
The deal comes amid economic uncertainty in the US, with the Federal Reserve monitoring inflation and growth. If bilateral trade between the US and UK were to expand significantly, it could have a positive effect on the dollar’s strength, even against other currencies.
Economic sectors involved and impact on FX
The deal could affect several sectors:
Energy and raw materials: If trade in natural gas or oil between the two countries increases, it could have an impact on commodity futures and therefore on currencies linked to these markets, such as the CAD and AUD.
Technology and financial services: Expanded cooperation between technology and financial firms could attract investment on Wall Street and support the dollar.
Manufacturing and Exports: If the UK manages to secure favorable export terms, the pound could see increased demand in Forex.
Outlook
In the short term, the deal could lead to increased volatility in GBP/USD as investors await further details. In the long term, much will depend on the economic policies that follow the deal and the effects on the trade balances of the two countries.
Forex market analysts will continue to monitor investor reaction and future statements from the governments involved.

Leo XIV: Impact on the Forex Market
Hello, I am Forex trader Andrea Russo and today I want to talk to you about the election of the New Pope.
The election of a new Pope is an event with implications not only religious and social, but also economic. With the rise of Leo XIV, the financial world is closely watching the possible repercussions on global currencies and investment strategies.
Immediate effects on Forex volatility
Historically, major political and institutional events can generate fluctuations in international currencies. Italy, home to the Vatican, could see movements on the EUR/USD pair, especially based on the first statements of the new Pontiff regarding the economic policies of the Vatican.
Some investors may react with initial caution, leading to temporary volatility in the Forex market, similar to what happens during political elections or other leadership transitions. However, this volatility could be limited in the short term, unless Leo XIV announces substantial changes in the management of the Vatican finances.
Vatican Financial Policies and Their Impact on Currencies
The Vatican holds significant wealth, with real estate investments and stakes in international companies. If the new Pope decides to adopt a more transparent or ethical strategy in his investments, this could influence the financial sector, prompting global funds to review their investment strategies.
EUR/USD and the Role of the ECB: Possible Vatican interventions on economic and social policies in Europe could prompt the ECB to assess the macroeconomic picture more carefully.
Safe Haven Currencies (CHF, JPY, Gold): If the election generates economic uncertainty, we could see an increase in investments in safe haven assets, such as the Swiss Franc (CHF) and the Japanese Yen (JPY).
Economic Sectors Impacted
Ethical Finance and ESG: If Leo XIV emphasizes the importance of sustainable investments, companies linked to the ESG sector could see increased interest and capital inflows.
Real Estate: With the Vatican being one of Europe’s largest property owners, any reforms in asset management could have repercussions on real estate markets, influencing the value of the EUR and other related assets.

PEPE - This is why price explode - Speed Index ReadingThere is always a reason why price explodes either true or fake. The criteria to look at are:
- Location - very important - where is the price locate - higher probability trades accomplished when the price leaves a significant location such us Fib, Sup/Res, AVWAP
- The volume waves - nothing moves without volume - sometimes is not so visible by the volume waves alone because they distribute or accumulate little by little, that's why we have Speed Index
- Reading Speed Index
- The proper entry signal
In the attached chart I will demonstrate how I read it using the above criteria (annotations are in sync with the chart):
1. Price entering Fib Area 50-61.8 - possibility of buyers to come in
2. Price touching AVWAP (three blue lines) coming from the bottom of a previous swing acting as resistance - another possibility of buyers to come in.
3. Speed Index 6.4, that's an abnormal speed index , that what I call first push up or PU, price never drops below the beginning of this wave
4. Speed Index 11.1, that's another abnormal speed index and that's what I call a hard to move down (HTMD) . What's happening here is that all the sell orders are absorbed by buy orders and price breaks on the up wave the origin of the HTMD wave.
5. Finally the entry Long with a PRL (Plutus Reversal Long) signal an up,up,up, we go!!!
I hope my years of work helps you out on reading charts!
Enjoy!

AMP Futures - Sync multiple chartsIn this idea we will demonstrate how to use the sync in layout feature with Tradingview.
